Abstract
Acoustic form factors have been used to model the frequency dependence of acoustic scattering in phantoms and tissues. This work demonstrates that a broad range of scatterer sizes, individually well represented by Faran theory or a Gaussian form factor is not accurately described by a single effective scatterer from either of these models. Contributions from a distribution of discrete scatterer sizes for two different form factor functions (Gaussian form factors and scattering functions from Faran’s theory) were calculated and linearly combined. Composite form factors created from Gaussian distributions of scatterer sizes centered at 50 µm with standard deviations of up to σ = 40µm were fit to each scattering model between 2 MHz and 12 MHz. Scatterer distributions were generated using one of two assumptions: the number density of the scatterer diameter distribution was Gaussian distributed, or the volume fraction of each scatterer diameter in the distribution was Gaussian distributed. Each simulated form factor was fit to a single diameter form factor model for Gaussian and exponential form factors. The mean squared error (MSE) between the composite simulated data and the best-fit single diameter model was smaller with an exponential form factor model, compared to a Gaussian model, for distributions with standard deviations larger than 30% of the centroid value. In addition, exponential models were shown to have better ability to distinguish between Faran scattering model-based distributions with varying center diameters than the Gaussian form factor model. The evidence suggests that when little is known about the scattering medium, an exponential scattering model provides a better first approximation to the scattering correlation function for a broad distribution of spherically symmetric scatterers than when a Gaussian form factor model is assumed.
Introduction
Quantitative ultrasound (QUS) expands the capabilities of ultrasound beyond simple analysis of relative B-mode image brightness by computing the power spectrum of backscattered ultrasound echo signals and performing further data processing to produce quantitative results. Applications have been explored in various tissues including eyes, kidney, liver, heart and bone.1–7 QUS allows for the measurement of specific parameters within a given medium to obtain more specific and detailed information beyond that available in a typical B-mode image. Among these parameters are quantitative measures of acoustic scattering and parameters derived from these estimates. One such parameter is the effective scatterer diameter (ESD) which has been used to study specific scattering sources in, for example, kidney, lymph nodes, red blood cells and breast tissue.8–11
The effective scatterer diameter is a quantitative metric estimated by comparing the measured data to a scattering model, called a form factor function, that describes the frequency dependence of backscatter. Specifically, the form factor describes deviations in the frequency dependence of the backscatter coefficient from that of Rayleigh scattering and is proportional to the Fourier transform of the autocorrelation function of acoustic impedance variations within a given medium.12 It is known that when the scattering source is small compared to the wavelength (a « λ where a is the scatterer radius), the scattering sources act as Rayleigh scatterers. Rayleigh scatterers display a frequency dependence of f4, and no more information is available about size or detailed shape. If the scattering source is large compared to the wavelength (a » λ), then the acoustic wave is essentially interacting with an interface, and the frequency dependence of scattering goes as f0 (frequency-independent). When the size of the scattering source is between these limiting conditions, it is possible to extract information about its size and shape based on properties of the scattered waves.
Several different models corresponding to different scatterer geometries or different boundary conditions can be used to calculate an effective diameter from form factor data. Models derived from the theory of Faran,13 a fluid sphere,14 or a spherical shell12 assume discrete scatterers within a uniform background. In addition to modeling discrete scattering structures, the form factor approach can also be used to describe the correlation function for variations within a continuum by modeling scattering with simple, continuous functions like a Gaussian or exponential.6,7,15 In cases where the scattering is from a continuum, the form factor approach models the correlation function of the underlying acoustic impedance distribution – not an individual scattering structure.
Insight into correlation functions of random media can be found in an analogous system of x-ray scattering. Work by Debye et al. shows that in a completely random scattering medium made of only material and voids, the resulting correlation function takes the form of an exponential, e−r/a, where the free parameter a is directly related to the volume fraction of voids within the scattering medium -- which ranged between 15% and 50%.16 Within the field of acoustics, researchers later used the exponential correlation function as a default form when fitting experimental correlation function results.17–19 In these cases, the free parameter, a, was used as a default correlation length for systems where a was assumed to be related to the mean scatterer size within the system as opposed to being measure of scatterer volume fraction.
Each method of form factor calculation is based on estimates of the power spectrum of the received echo signals. An implicit assumption in this analysis is that the underlying interactions that produce the echo signals arise from (at least) a weakly stationary random process. This is a good assumption in homogenous, isotropic phantoms and is applied to backscatter analysis in many soft tissues.12, 20
When an ESD is calculated from experimental form factor data obtained from media with discrete sources, the assumption is made that the dominant scatterers within a given region of interest (ROI) are of a single size (or have a very narrow size distribution) and are fit to a model which describes a single effective size. This effective scatterer diameter approach produces predictable results when the scatterer properties within the observed media are known.12
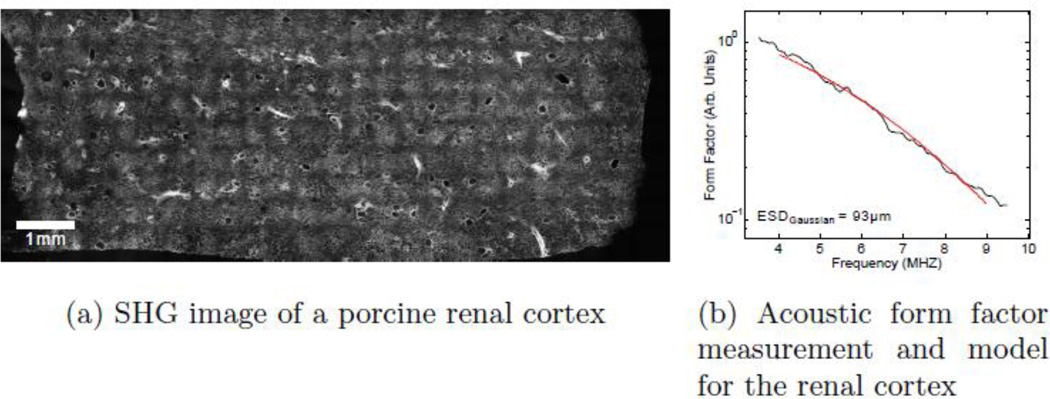
Previous work with an emphasis on ESD analysis has been successfully performed on renal tissue.2, 20–25 In these tissues the assumptions of local homogeneity, system stationarity, and discrete scattering sources were adequately met. The series of investigations of backscatter from the renal cortex was particularly successful in using ESD analysis to measure and track changes in microstructural elements within tissue.2, 20–25 This analysis worked particularly well because of the relative homogeneity of the tissue samples and the sparse, regular nature and discrete circular symmetry of the scatterers being measured: the larger glomeruli and smaller afferent and efferent arterioles. Figure 1 shows a second harmonic generation (SHG) microscopy image of a 200 µm thick slice of porcine renal cortex tissue along with sample acoustic data from the same tissue sample.26 Lighter areas within the image correspond to areas with a higher concentration of collagen,26 a major contributor to acoustical scattering in biological tissues.27,28 Many of the larger, roughly 200 µm features within this image are examples of the glomeruli. Note that over the course of many millimeters, the character of the aggregate microstructure remains unchanged.
Figure 1.
(a) An SHG image of a fixed 200 µm thick slice of porcine kidney cortex tissue. Many of the larger, sparse 200 µm features seen throughout the sample are glomeruli, one of the dominant acoustical scatterers within this tissue. The cross-hatch pattern seen is an artifact due to both the relatively large fields of view imaged and stitching process. (b) The acoustic form factor data are shown to fit very well to the Gaussian model, as had been found in early ESD studies.
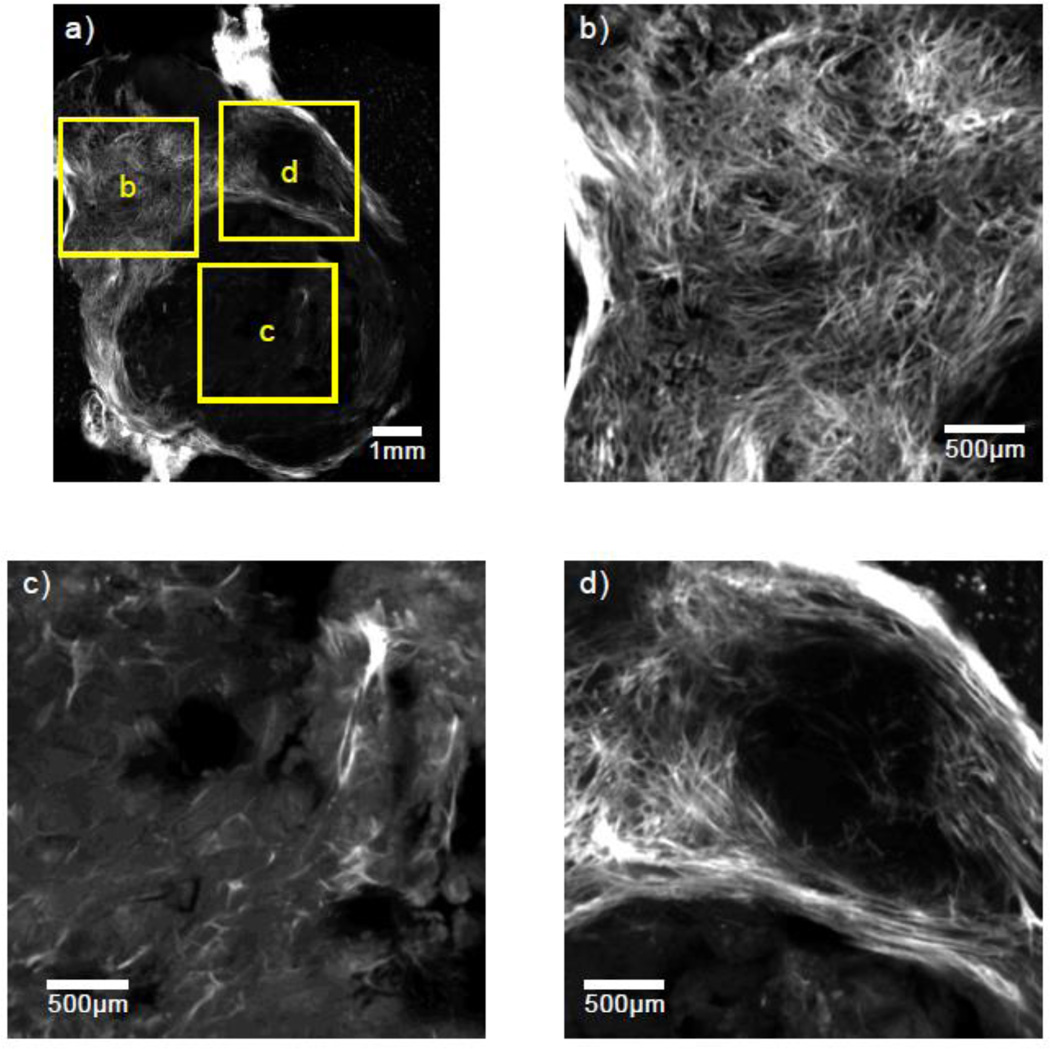
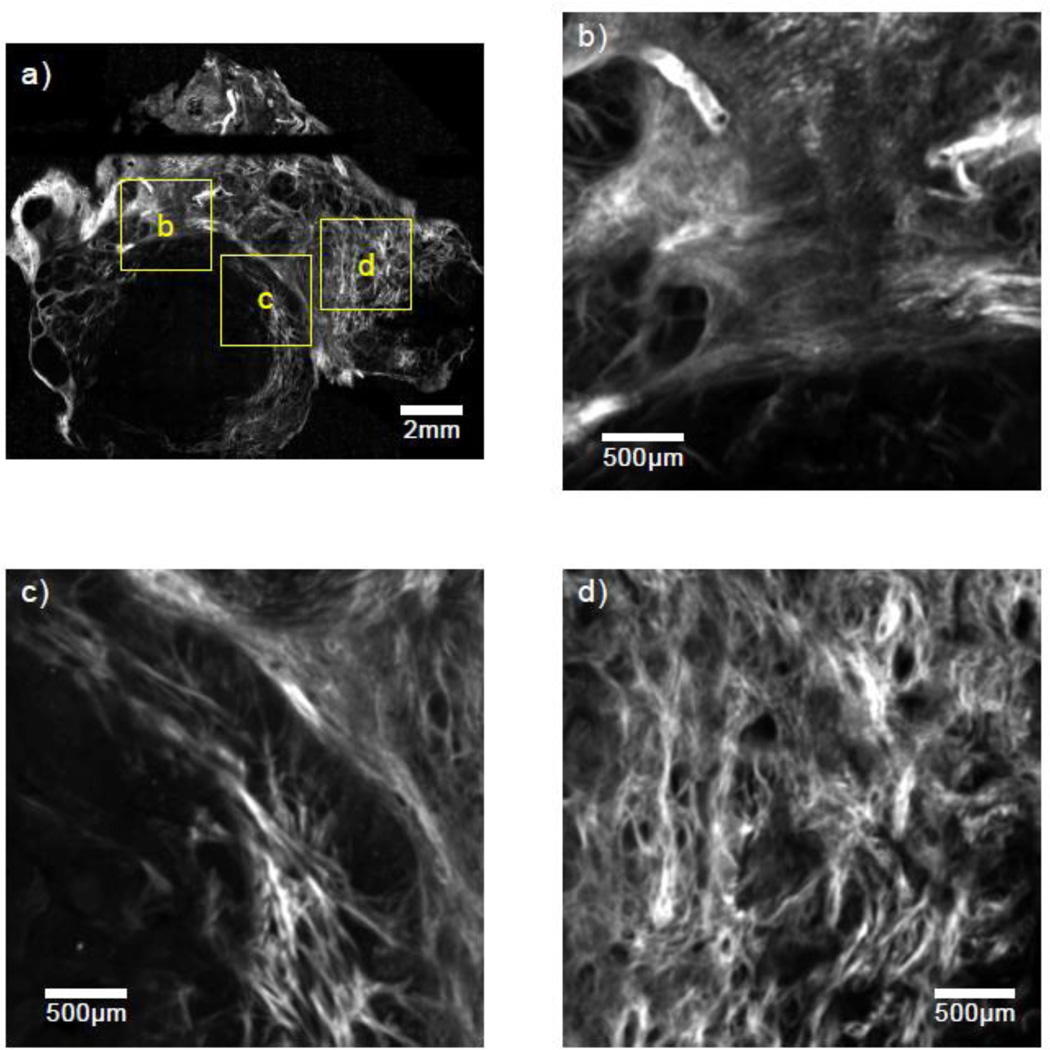
The relative homogeneity of the renal cortex stands in stark contrast to that of many other tissue types. Figures 2 and 3 show SHG images from two rodent mammary tumors from separate animals. These tumors were obtained from transgenic mice with an expressed polyoma middle-T oncoprotein inducing spontaneous mammary tumor generation and growth. These tumors, which have a high rate of metastasis, have been shown to be good models for similar diseases in humans.29 In contrast to Fig. 1, the tumor tissues shown in Figs. 2 and 3 are much more inhomogeneous — with drastic changes occurring over millimeter length scales. This behavior violates the assumption of a weakly stationary random process employed in the derivation of the signal processing methods for ESD estimation. Calculating a form factor from the backscatter data with such media can yield useful, trackable parameters, but unlike phantom measurements, for instance, where the microstructure is known to be sparse, random and uncorrelated, a single size Gaussian form factor model may not offer insight into the specific dominant scattering structure being probed.
Figure 2.
(a) An SHG image of a 100 µm thick slice from a breast tumor in a mouse model with three separate 3 × 3 mm regions highlighted and magnified in (b)–(d).
Figure 3.
(a) An SHG image of a 100µm thick slice from a breast tumor in a second mouse model with three separate 3 × 3 mm regions highlighted and magnified in (b)–(d).
Early investigations into ESD estimation were intended as a method to characterize an effective size from a continuum lacking discrete scattering sources and were validated with phantoms containing discrete, well-characterized scatters (e.g. glass spheres with known diameters).12, 30 These early successes have led to the assumption that a correlation length derived from an experimental form factor should correspond to a specific object or objects within a given medium.31, 32 This assumption may or may not be the case with the tissue being studied.
When a scattering medium deviates from the assumption that only a single size of scatterer is dominant within a given ROI, and a broad distribution of scatterers is present, a single-size ESD model can cease to be a good descriptor of the microstructure within a given medium. One potential consequence of increasingly complex scattering media is the over-estimation of mean scatterer sizes. Assuming sufficient available signal bandwidth, as the distribution of scatterer sizes broadens and more, larger-diameter scatterers are introduced to the distribution, the larger scatterers dominate and ESD values increase resulting in a biased estimation of the mean size of the scatterers in the distribution.30, 31 It has also been shown that insufficient bandwidth can affect the ESD estimates for a continuum of scatterer diameters highlighting the need for the maximum available bandwidth when performing experiments involving ESD analysis.33
In order to gain an understanding of scattering media like the tumor tissue shown in Figs. 2 & 3, where scattering sources can have complicated shapes resulting in complicated acoustic autocorrelation functions, sample form factor data from relatively simple distributions were simulated and fit to empirical form factor models. A weakly scattering medium was assumed, allowing each different scatterer size to contribute independently to backscatter data as a whole. Effective scatterer sizes and bandwidths were chosen to reflect typical ranges found when laboratory and clinical systems are used.
In this paper we explore the behavior of backscatter data from simulated media with broad scatter size distributions. Form factor data was simulated under a single-scattering assumption by linearly combining the contributions of individual scatterer sizes and fitting those compound form factors to empirical form factor models. From these simulations we show that a single “effective” scatterer diameter using a Gaussian model for the acoustic form factor is a comparatively poor descriptor of the scattering medium as the distribution of scatter sizes broadens whereas a single-size exponential form factor model becomes an increasingly better fit. Although it should not be expected that the correlation length obtained from an exponential model describes any particular feature within a given scattering medium, in media with unknown microstructural properties a good fit to an exponential form factor model may indicate a relatively complicated and disordered microstructure. In addition, a single diameter exponential model has equal or better ability to track changes within a medium, as a distribution of scatterers changes, than if a single-size Gaussian model is used.
Methods
Backscatter coefficients for broad scatterer diameter distributions were simulated by calculating the frequency dependent backscatter coefficients (BSC) for a series of single scatterer sizes, weighting each individual size by a relative concentration, and summing the individual contributions as shown in Eqn. 1
| (1) |
where na is the relative concentration of the BSC of a single size, a. Individual BSCs were calculated using the theory of Faran under the assumption that solid glass spheres of a single size were randomly distributed within a uniform background medium. The concentration coefficients (normalized number density, na) were calculated assuming a Gaussian distribution around a median diameter (50 µm for this study).
For analysis, the summed BSC data were reduced to form factors, removing all dependencies but frequency and scatterer geometry. Form factors were calculated by dividing the backscatter coefficients by f4 (the frequency dependence of scattering by Rayleigh scatterers) and normalizing the data to an arbitrary value. For visual comparison, all simulated data was normalized to the zero-frequency limit. Mean squared error values between each potential single-size model and the simulated broad-distribution data were calculated after normalization. The single-size model and normalization that produced the lowest mean squared error (MSE) was selected as the best fit.
Two different scatter size distribution models were employed to calculate na: the Gaussian number density approach, and the Gaussian volume fraction approach. Using the Gaussian number density approach, the relative number of each scatterer diameter is weighted by a Gaussian:
| (2) |
where a0 is the median size and σ is the (variable) standard deviation of the size distribution. Using the Gaussian volume fraction approach, the total volume of scatterers of each diameter is weighted by a Gaussian:
| (3) |
In this approach, scatterers with smaller diameters will be more numerous, but still sum to the same volume contribution as each of the less numerous, larger scatterers at positions on opposite sides of the distribution’s centroid. Neither of these scatterer number density models should be expected to perfectly mimic a biological scattering medium; instead these two weighting scenarios should be thought of as idealized media that can act as guides when studying more complex tissues.
For both scaling models, the number of each scatterer diameter is relative and the total number unspecified. While size information is contained within the backscatter data, number density information (which is proportional to the magnitude of the backscatter coefficient) is lost when the BSC data is converted to a form factor. For these calculations, it is assumed that the total number of scatterers is small and contributes only a small volume fraction of the total medium, and that the scanning area is large enough to sample a statistically significant number of individual scatterers. These assumptions are commonly used when studying scattering behavior in soft tissues.12
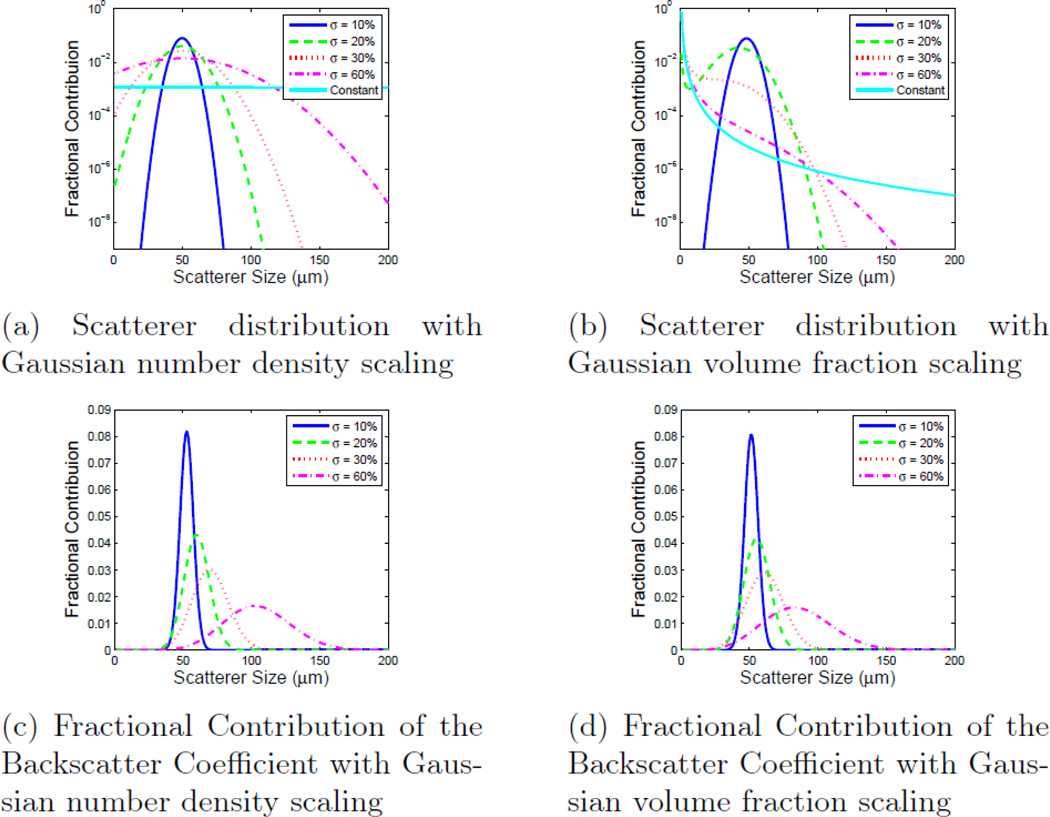
Figures 4a and 4b show the fraction of the total number of scatterers in the distribution as a function of size for each weighting method with four different standard deviations as a percentage of the central scatterer size: 10%, 35%, 50%, and 65%; and, for comparison, a 5th uniform scatterer diameter distribution is included. The step size for each distribution was 1 µm, which has been shown to produce theoretical backscatter coefficients in good agreement with experiment.34 Figures 4c and 4d show the contribution to the total BSC from each constituent scatterer diameter. When the scatterer diameter is much smaller than the incident wavelength, larger sizes have a larger impact on the resultant backscatter coefficient due to the backscatter coefficient having an a6 dependence. As a result, Gaussian volume fraction scaling includes a larger number of smaller scatterers in the medium and they provide a larger contribution to the total compound BSC than they do with Gaussian number density scaling.
Figure 4.
The fractional contribution of each individual scatter size to both the size distribution and the backscatter coefficient contribution for both Gaussian number density scaling and Gaussian volume fraction scaling. Each plot shows five distributions centered at 50 µm with standard deviations of 10%, 35%, 50%, and 65% as well as a uniform distribution. Shown here are a) the size distribution with Gaussian number density scaling, b) the size distribution with Gaussian volume fraction scaling, c) the fractional contribution to the backscatter coefficient with Gaussian number density scaling, and d) the fractional contribution to the backscatter coefficient with Gaussian volume fraction scaling.
Normalized compound BSCs with distribution standard deviations ranging from 0% to 70% were generated and log-compressed. Effective scatterer diameters (ESD) were found by fitting each data set to three single-size backscatter models: Faran theory, a Gaussian form factor,
| (4) |
and an exponential form factor,
| (5) |
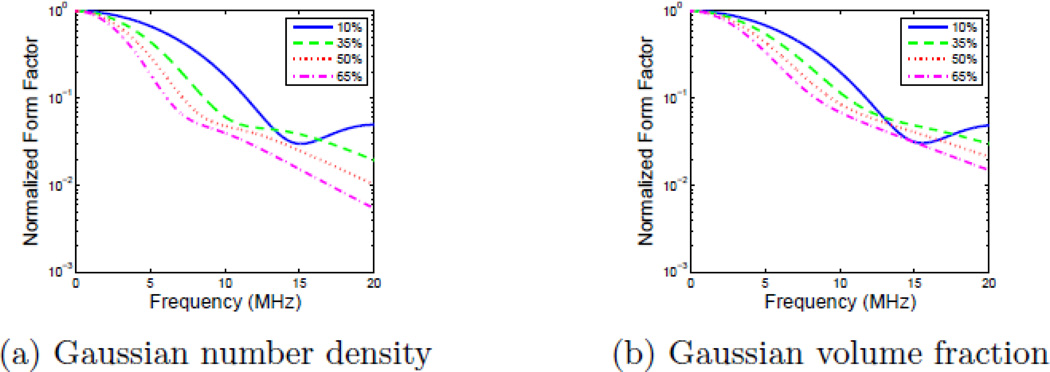
where k is the wave number and d is the characteristic distance of each model.13, 15 Each characteristic distance was converted to an effective diameter by scaling according to a spherical volume integral as discussed in the work by Insana et. al (1993).15 Fitting the Faran and exponential form factor models to compounded backscatter data was performed using previously generated lookup tables.*Gaussian form factor fits were performed analytically.35 Each fit used form factor data for frequencies between 2 MHz and 12 MHz with the center frequency corresponding to a ka~ 0.8 for 50 µm scatterers. While this is an optimistic bandwidth for current commercial clinical transducers,36 the large bandwidth allows more features to be captured by the simulated data. Example data created using Faran scattering functions with distributions corresponding to σ = 10%, 35%, 50%, and 65% of the center scatterer size are shown in Fig. 5.
Figure 5.
Example theoretical compound frequency dependent form factors calculated using Faran scattering functions with a) Gaussian number density scaling, and b) Gaussian volume fraction scaling. Each plot shows four different size distributions with standard deviations of 10%, 35%, 50%, and 65% of the centroid value.
Once the best fit (minimum MSE) form factor model was found, the resultant models were discussed qualitatively (shape and character of the single-parameter curve) and evaluated quantitatively (via mean-squared error) in order to identify trends. The MSE for each fit of the form factor for the simulated compound scatterer distribution to the single scatterer diameter model was calculated using the decadic logarithm of both:
| (6) |
where X̂ represents form factor values corresponding to the single-diameter model, X represents the compound distribution-based form factor values, and n is the total number of points. The fit quality as measured by mean-squared error is monitored with increasing scatter-diameter distribution standard deviation in order to compare the quality of fit provided by each model.
In order to gain additional information about how these fits behave when the centers of these distributions change, the single-size ESD parameter and MSE for the resulting fits were generated for distributions centered around 50 µm: 40 µm, 45 µm, 55 µm, and 60 µm. In addition to identifying best fit models, the degree to which the resultant ESD parameter of each model changed with broadening scatterer-diameter distribution was evaluated. Models more sensitive to changes in the center value of the scatterer diameter at different values of scatterer diameter distribution are identified. This simulation was performed for compound BSCs generated with the Faran model and Gaussian form factors.
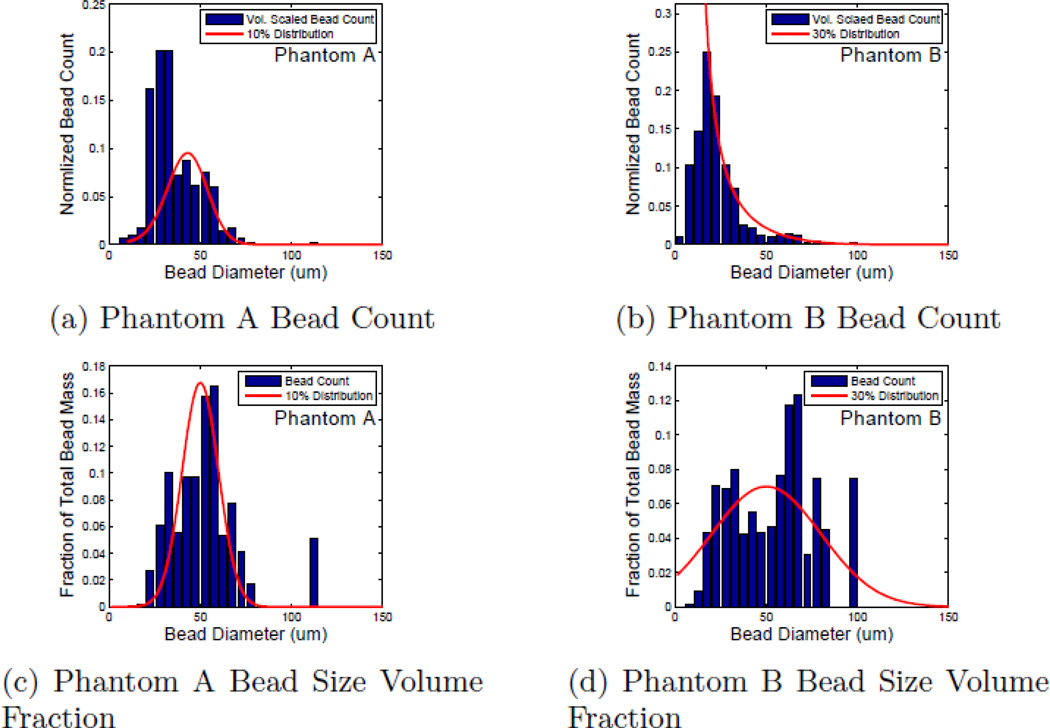
In order to verify some of the simulation results, two separate phantoms were created using glass beads in agar. Each phantom was created with bead-size distributions using Gaussian volume scaling centered around 50µm. Phantom A was designed to have a distribution standard deviation of approximately 10 µm, while Phantom B was designed to have a distribution standard deviation of approximately 30 µm. Sound speed and attenuation coefficients were measured using a narrow band through-transmission technique.37 Both phantoms contained the same total volume of beads.
The distributions of the scatterer diameters were measured manually using calibrated optical microscopy. A histogram of the bead count is shown in Fig. 6 along with the intended distribution overlaid as a continuous curve. Distributions for both Phantom A and Phantom B are plotted to display both the numerical count (Figs. 6a and 6b) and the normalized fractional volume (Figs. 6c and 6d) of the glass beads. The volume plots were calculated by scaling the numerical count histogram data by r. Despite the fact that most of the individual scatterers in Phantom B are smaller than 30 µm, when the volume fraction of each size is examined, it can be seen that a significant percentage of the scatterer volume is taken up by scatterers larger than 50 µm. This observation is in contrast to Phantom A were only a small fractional volume is taken up by these larger scatterers.
Figure 6.
Bead count histograms for phantoms A(a) & B(b). (c) and (d) have been renormalized to reflect the volume fraction of each size instead of raw count. Overlaid on each plot is the target distribution.(red).
The experimental backscatter coefficients and subsequent form factors were found using the reference phantom approach.38–40 Scanning was performed using a Siemens Acuson S2000 commercial ultrasound system (Siemens Medical Solutions USA, Malvern, PA) using two transducers (9L4 and 18L6) with a combined bandwidth ranging from 2MHz to 12MHz. Power spectra were estimated using the multitaper method.41,42
Results
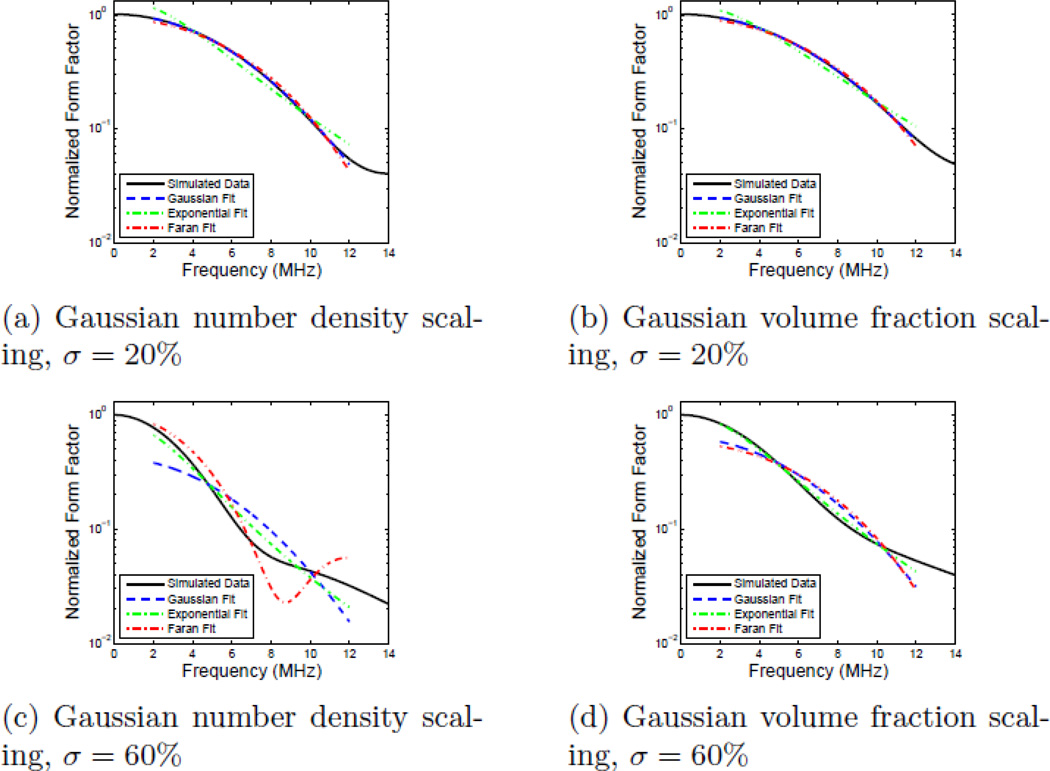
Figure 7 shows example form factor data created using Faran scattering functions (BSC/f4 normalized to its peak value) simulated from example distributions of scatterer diameters with fits using single-sized models. The resulting ESD values for each model are shown in Table 1.
Figure 7.
Example simulated form factors for compound scatterer diameter distributions created using Faran scattering functions. Each plot shows the simulated form factor from the distribution of scatterer diameters and the best-fit single-diameter using a Gaussian form factor model, an exponential form factor model, and a Faran form factor model.
Table 1.
Effective scatterer diameter estimates (corresponding to the data shown in Fig. 6) obtained using the Gaussian form factor model (σGauss), exponential form factor model (σExp), and Faran theory (σFaran).
| Distribution Model and Standard Deviation |
Effective Scatterer Diameter | ||
|---|---|---|---|
| σGauss | σExp | σFaran | |
| Gaussian number density scaling, diameter standard deviation of 20% | 78.2 µm | 67.6 µm | 56.0 µm |
| Gaussian volume fraction scaling, diameter standard deviation of 20% | 71.8 µm | 58.0 µm | 52.1 µm |
| Gaussian number density scaling, diameter standard deviation of 60% | 81.3 µm | 87.4 µm | 89.5 µm |
| Gaussian volume fraction scaling, diameter standard deviation of 60% | 77.8 µm | 73.3 µm | 55.2 µm |
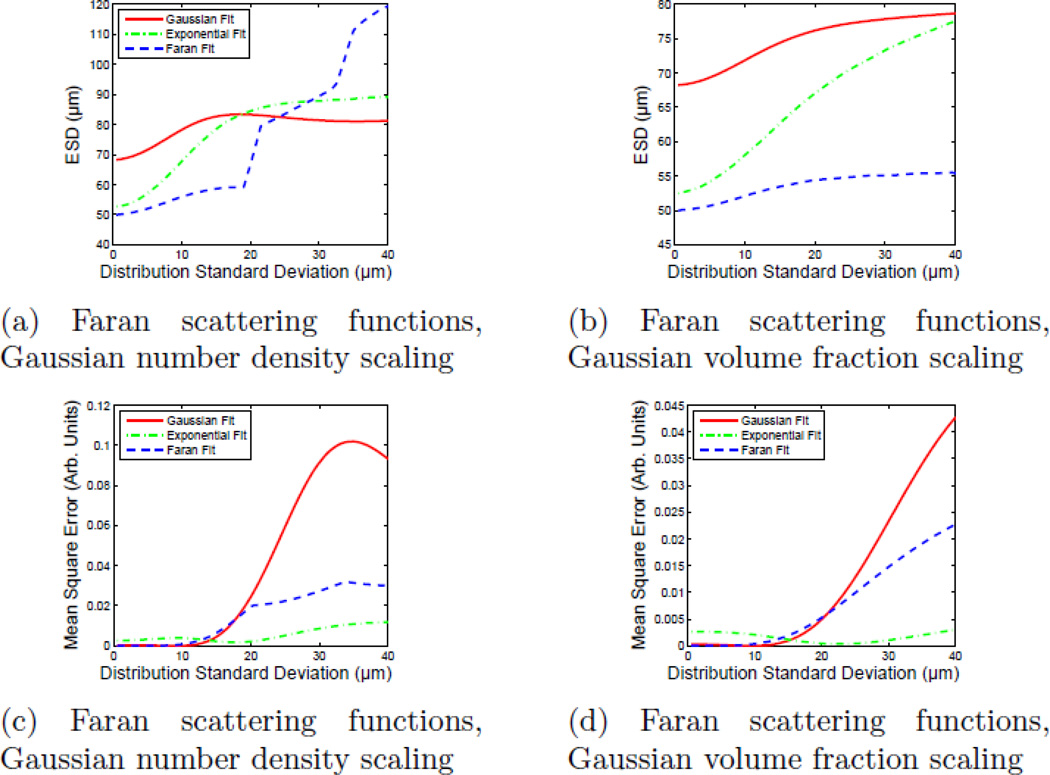
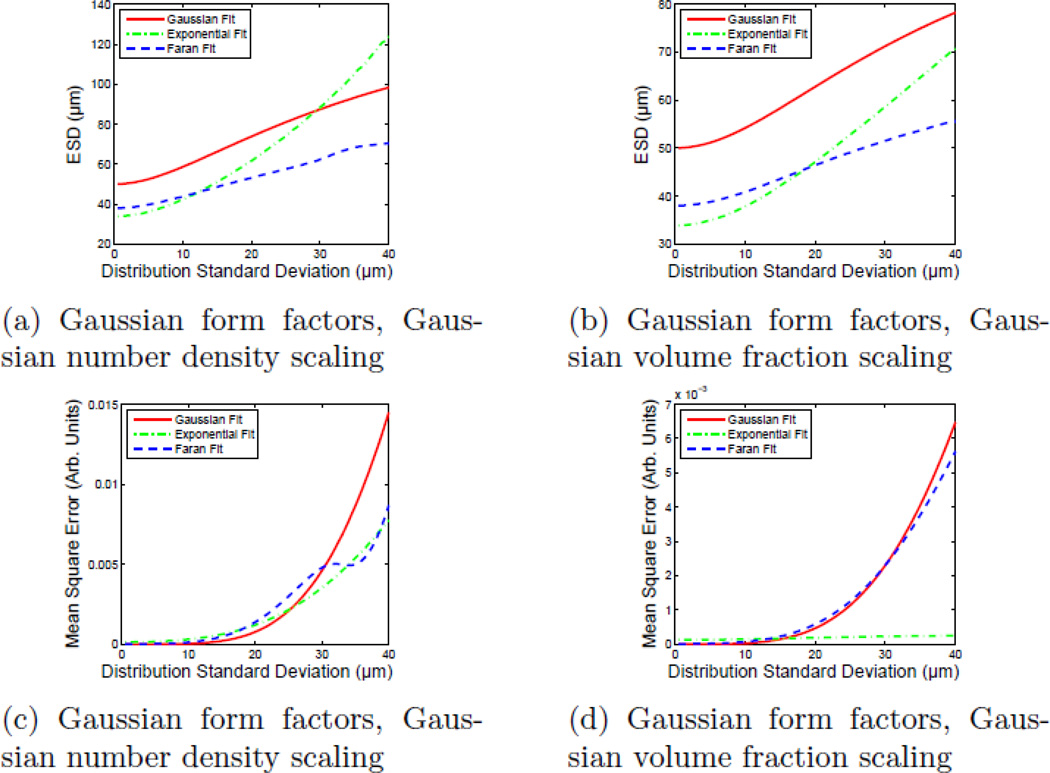
The ESD estimates and the MSE between the best-fit form factor model (for each model type), as a function of scatterer diameter distribution standard deviation are shown in Fig. 8. Figures 8a and 8b show the ESD parameter as a function of scatterer diameter distribution standard deviation for both scatterer distribution scenarios (Gaussian number density scaling and Gaussian volume fraction scaling). Discontinuities in the ESD value occur with the Faran model when the scatterer diameter distribution becomes wide enough to include scatterers for which ka < 2 (where another resonance in the backscatter coefficient appears) leading to potential ambiguity in which resonance fits best to the data. The ESD estimates with the Gaussian and exponential form factor models increase steadily from the initial values as the contribution from larger scatterers increases.
Figure 8.
ESD estimates and mean-squared error in the fit of single-diameter form factor models to simulated form factors corresponding to broad scatterer diameter distributions as a function of distribution standard deviation (σ). The scattering function of the individual scatterers was computed using the Faran scattering model. It should be noted that the exponential fit has the lowest MSE for broad scatterer diameter distributions.
Figures 8c and 8d show the MSE for each fit as a function of widening scatterer distribution. Consistent with the subjective assessment of scatterer size data, the MSE values obtained from the Faran models show discontinuities as the fit becomes more sensitive to the second (and eventually third) backscatter coefficient resonance. As such, after an initial increase, each discontinuity allows the fit to the Faran model to maintain a roughly constant MSE value. This experiment was repeated by compounding Gaussian form factor scatterers (instead of scatterers with Faran scattering functions) to generate data similar to those seen in Fig. 8. The results of those simulations are shown in Fig. 9.
Figure 9.
ESD estimates and mean-squared error in the fit of single-diameter form factor models to simulated form factors corresponding to broad scatterer diameter distributions as a function of distribution standard deviation. The scattering function of the individual scatterers was computed using a Gaussian scattering model. It should be noted that the exponential fit has the lowest MSE for broad scatterer diameter distributions.
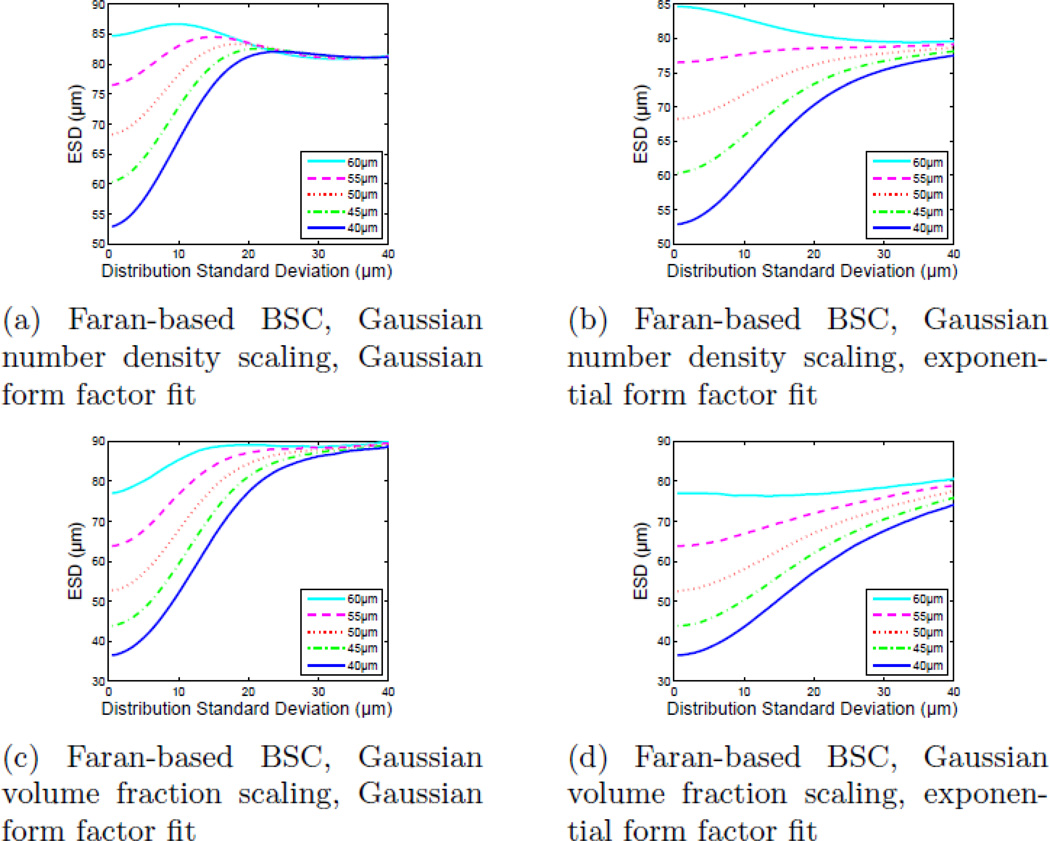
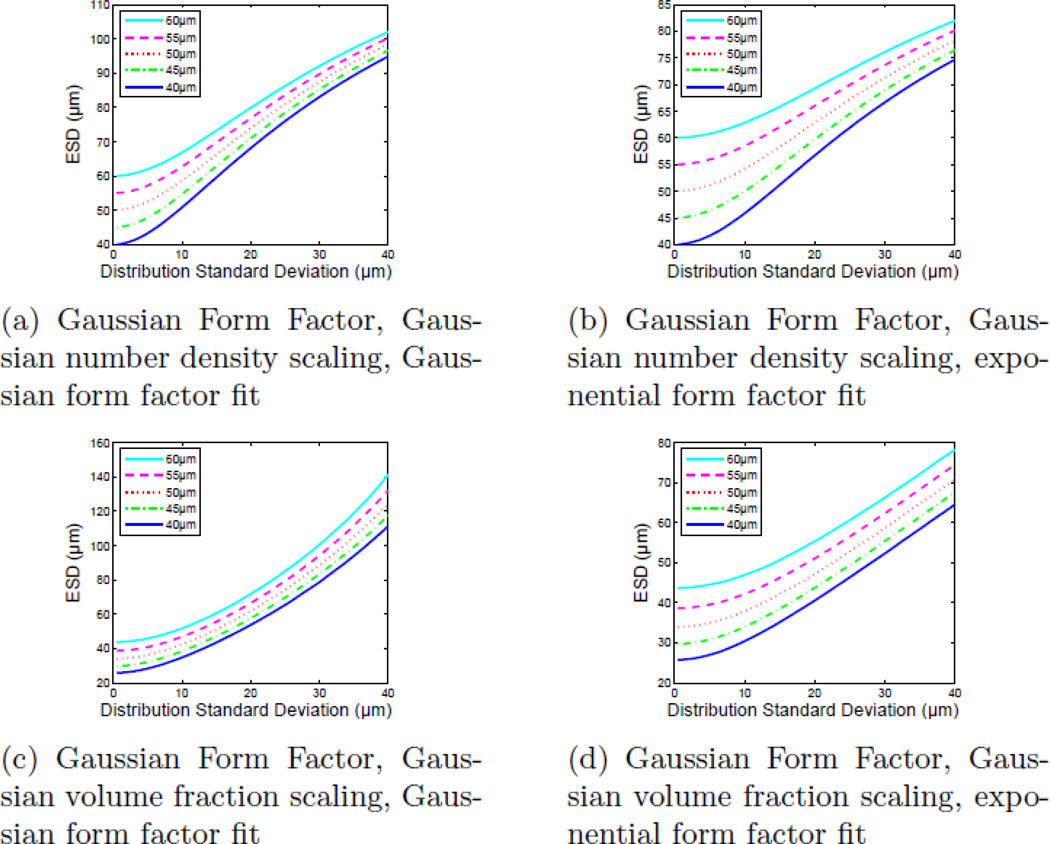
The simulation results shown in Figs. 8 and 9 were repeated for different mean scattered diameters around 50 µm: 40 µm, 45 µm, 55 µm, and 60 µm and the results are shown in Fig. 10. The intent of this simulation was to compare the relative changes in the Gaussian and exponential form factor model ESD fits and MSE as the center of the size distribution changed. Figures 10a and 10b show ESD fit values for Gaussian and exponential form factors, respectively, from BSCs generated using Faran scattering functions when the underlying scatterer diameter distributions have Gaussian volume fraction scaling. Figures 10c and 10d show the ESD values obtained when the underlying scatterer diameter distributions have Gaussian number density scaling. These calculations were repeated with a Gaussian scattering model. The results of those simulations are shown in Fig. 11.
Figure 10.
Estimated ESD values for a compound BSC composed of Faran-based particles as a function of scatterer distribution standard deviation at several center values (40 µm, 45 µm, 50 µm, 55 µm, and 60 µm). While it appears that all of the fits converge to a single value at broad distributions, it also appears that exponential fits offer the greatest ability to differentiate among the distributions (higher ‘contrast’ to distinguish between two broad distributions at two different center diameters).
Figure 11.
Estimated ESD values for a compound BSC composed of Gaussian form factor-based particles as a function of scatterer distribution standard deviation at several center values (40 µm, 45 µm, 50 µm, 55 µm, and 60 µm). In this case, it appears that there is neither a significant benefit nor penalty in using the exponential model instead of the Gaussian model.
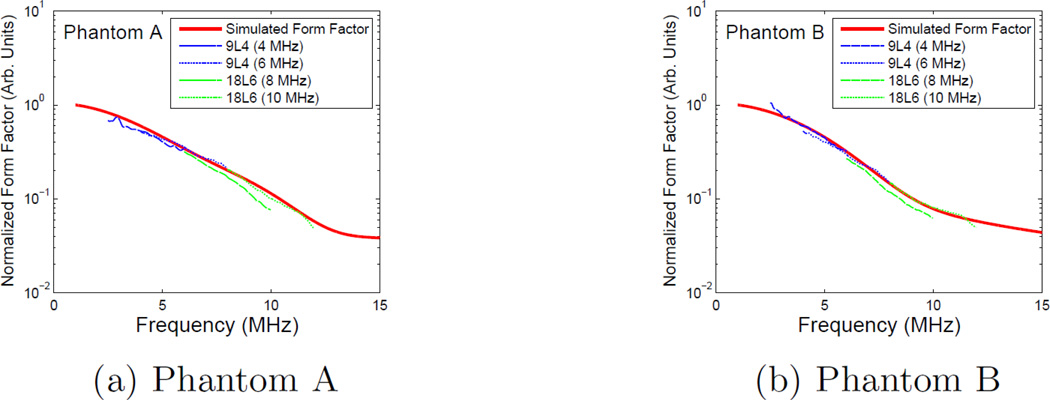
The experimental form factors obtained from Phantoms A& B are shown in Fig. 12a & 12b respectively. The experimental form factor data is plotted on top of a theoretical form factor calculated from the size data displayed in Fig. 6 using the theory of Faran. The experimental data for all transducers and bandwidths were normalized to the theoretical curve at 6MHz using the 9L4 6MHz center frequency data.
Figure 12.
Experimental form factor data for phantoms A(a) and B(b). The dotted and dashed data is experimental data obtained from transducers pulsed at 4MHz (blue, dashed), 6MHz (blue, dotted), 8MHz (green, dashed), and 10MHz (green, dotted) as indicated within the figure. Experimental data was normalized as a single unit in order to maintain relative magnitudes. The solid data (red) is a Faran calculation based upon the histograms results shown in Fig. 6.
Form factor data over the entire usable frequency range were averaged and fit to both Gaussian and exponential single-size form factor models. Phantom A, corresponding to a narrower distribution, nominally 10%, produced ESD values of 79 µm and 63 µm, respectively. Phantom B, corresponding to a broader distribution, nominally 30%, produced larger values of 88 µm and 81 µm as expected. More importantly, however, the MSE values of each of these fits changed from phantom to phantom in a manner consistent with the simulations presented in this paper. The Gaussian form factor fit produced an MSE value 11 times larger for Phantom B than Phantom A, whereas the exponential fit quality increased with an MSE in Phantom B 70% of the value in Phantom A. For the narrow distribution, the Gaussian model was the better fit with an MSE ratio between the Gaussian and exponential fits of 1:7, and for the broader size distribution, the exponential model was the better fit with an MSE ratio of 2.5:1. These results are summarized in Table 2 with the presented ESD values normalized to the Gaussian form factor fit of the data obtained from Phantom A for convenience.
Table 2.
The estimated effective scatterer diameter (ESD) and mean squared error (MSE) of the form factor fit to the aggregate experimental data obtained from Phantoms A and B. The MSE for each data set was normalized to the Gaussian form factor fit of the data obtained from Phantom A for convenience.
| Phantom | ESD | Mean Squared Error | ||
|---|---|---|---|---|
| ESDGauss | ESDExp | MSEGauss | MSEExp | |
| Phantom A | 78.7 µm | 63.1 µm | 1.0 | 6.9 |
| Phantom B | 87.9 µm | 81.0 µm | 11.8 | 4.8 |
Discussion
The Gaussian form factor model has been shown to be a reasonably accurate representation for the (spherical) Faran-like form factor over a limited bandwidth and has been used in lieu of Faran theory when there is a lack of sufficient input data.21 However, as shown in Figs. 8c and 8d, when the scatterer distribution is wider than about 20% of the center value, a single-diameter Gaussian or Faran form factor model becomes an increasingly poor descriptor of the composite scattering function. The exponential form factor, on the other hand, becomes an increasingly better match to the simulated data as the distribution widens. A similar trend is seen with Gaussian form factor based data, Figs. 9c and 9d. Even though each model was fit to data created using the theory of Faran, the zero width limit (single scatterer diameter in the distribution) will not necessarily produce an ESD value of 50 µm for models other than the single-size Faran model.
For the narrower size distributions, both the Faran and Gaussian models produce visually good fits and the exponential model is clearly an unsatisfactory option. The qualitative appropriateness of each model becomes more ambiguous for the broader scatterer diameter distributions, i.e. σ = 30 µm or about 60%. As the scatterer diameter distribution broadens, the composite scattering functions trend from concave-down in shape to concave-up in shape over the bandwidth studied. As seen in Fig. 6, single-diameter Gaussian form factor models also display a concave-down shape, whereas single diameter exponential form factor models show a concave-up shape.
The ESD values for each simulated scatterer diameter distribution created using Faran scattering functions began at distinct values and appear to progress toward a single, asymptotic value as the standard deviation of the scatterer diameter distribution increased (Fig. 10). The rate at which the ESD value for each size converges, however, depends both upon the model used to generate the BSC values and the form factor model used to fit the data. ESD values converge much more quickly when a Gaussian model is used to fit the data and when fitting Gaussian number density scatterer diameter distribution data, while exponential model and Gaussian volume fraction scatterer size distribution data both show a larger contrast for each size distribution.
Like the broad distributions of scatterers with Faran scattering functions, broad distributions of Gaussian scatterers yield ESD values that steadily increase with broadening scatterer size distribution (Fig. 9). Unlike the Faran scatterer distributions, however, when the Gaussian number density scaling is used, all models, including the exponential form factor model, produce increasingly poor fits as the size distribution widens. When a Gaussian volume fraction distribution is used, however, the exponential form factor fit gives a consistently low MSE as opposed to the Gaussian form factor and Faran model functions which increase drastically beyond σ > 15 µm (30%). When the center diameter of the Gaussian form factor scatterer distributions is shifted (Fig. 11), unlike Faran scatterers, no appreciable difference is seen when tracking changes with either Gaussian or exponential form factors.
In each of these scenarios (Figs. 5, 7, 8, and 9), the mean scatterer diameter is ostensibly a 50 µm sphere, but with very different scatterer size distributions. However, the resulting correlation length, i.e. ESD, for each scenario varied substantially. Many virtual phantoms produced correlation lengths corresponding to ESD values of about 50 µm, but many did not and showed substantially larger ESD values. Within each virtual phantom, scatterers existed equal to the calculated ESD value, though this particular size should not be argued to be the dominant scattering source. Based upon these results, caution must be used when trying to assign importance to a specific scattering source based on its size in relation to an experimentally obtained ESD. Until a system is well characterized and tests performed to validate the assertions of a dominant source of scattering, ESD should be viewed as a fit parameter that may or may not have a direct analog within the medium being studied.21–23
Within the experimental phantoms, Phantom B contained by far more scatterers in the range of 20–30 µm, while there were relatively few of those sizes in Phantom A. A microscopic analysis of each phantom with the intent of identifying a dominant scatterer may lead to very different results despite very similar experimental BSC and ESD estimates. The data from both phantoms appeared to line up well with the theoretical Faran calculations, and aligned well with the simulation results. However, despite very different scatterer distributions, the experimental backscatter coefficients of both Phantom A and Phantom B were still quite similar. A measurement with a smaller bandwidth would result in very similar results despite the very different scatterer distributions within each phantom.
The current default when performing ESD estimation is to use a single-size Gaussian form factor fit.9, 21, 43 In situations where the data is low bandwidth or relatively noisy, an ESD obtained from Gaussian form factor fit is a good empirical metric. It has been demonstrated that Gaussian form factor ESD estimates are reasonably accurate when the dominant source of backscatter has an observed circular acoustic cross section, there is a relatively narrow diameter distribution, and the scatterer size/acoustic frequency product result in a ka ≈ 1. The work by Chaturvedi, et al.44 also demonstrated the variance reduction in ESD estimates as the bandwidth increases (and there is, in effect, a single scatterer size). However, as improvements in commercial ultrasound systems are made and broader bandwidth, lower noise data becomes available, an exponential form factor ESD fit may be a better option for a default form factor model function when the scatterer size distribution is relatively wide (or there is no prior information regarding scatterer sizes). Using relatively broadband data, D. Nicholas found that an exponential model for the correlation function for backscatter from liver and spleen provided a better representation for the frequency dependence of scattering than was found using low order polynomials.6 That work further suggested that the scattering sources in the liver are likely a broad distribution of sizes from the bile canaliculi (about 20 µm) to the vascular structure with sizes on the order of 1 mm.
When performing clinical studies, the quality of a form factor fit and its implicit use as an indicator of microscopic feature sizes might be of secondary importance to the ability to track changes in backscatter data as tissue evolves with disease progression.45, 46 In these cases the ESD should be thought of as a quantity related to the correlation function of the scattering sources, but not necessarily representative of scattering size. As shown in Figs. 9 and 11, when the frequency dependence of scattering is consistent with either Faran-like, or Gaussian form factor models, ESD estimation with an exponential form factor model tracks changes in these simulated media at least as well as a Gaussian form factor fit (even when a Gaussian form factor is an objectively better fit), and shows a greater contrast in certain circumstances, e.g. when the exponential form factor is an objectively better fit.
The underlying structure of biological media with similarly wide scatterer diameter distributions will likely be difficult to discern from BSC estimates. Each of the BSCs generated are not singular solutions and, with the addition of noise, identifying the correct scattering source may become very difficult, if not impossible. It may be possible that with the addition of prior knowledge of the scattering sources within a given medium, by way of microscopy (like SHG imaging) or other sorts of characterizations, that enough constraints can be placed on a particular data analysis to adequately and non-invasively characterize the microstructure of a given biological medium.
Conclusions
Modeling the backscatter from a distribution of spherical scatterers using a single effective scatterer diameter was shown to be an accurate description of the simulated BSC when the scatterer distribution is relatively narrow (σ< 20%; 50 µm ± 10 µm in this study). However, as the scatterer diameter distribution is broadened, the simple form factor models with a single effective scatterer diameter become an increasingly poor descriptor of the scattering medium. In these artificial, idealized scattering media, it appears that this approach to the ESD parameter estimation (comparing the spatial Fourier transform of the correlation function for backscatter to a simple single-particle scattering model) is an inadequate means of gaining a full understanding of the microstructure within an unknown sample.
Despite the inability of simple analysis to perfectly describe the complex microstructure described above, several potentially useful empirical observations can be made. First, when an exponential form factor model is a good match to the experimental data, it suggests a wide scatterer distribution and/or a potentially complex scattering structure. Second, as these distributions broaden, the fit parameters — ESD and MSE — change making the tracking of changes within a given medium possible despite the fact that the actual microstructure may be unknown. In fact, if a broad distribution can be assumed, using an exponential form factor model may allow finer changes to be seen than if a Gaussian form factor model is used.
Acknowledgments
The authors would like to thank Kevin Elicieri, Joe Szulczewski, and the members of Laboratory for Optical and Computational Instrumentation for their help and assistance with tissue imaging throughout this project.
Funding
The author(s) disclosed receipt of the following financial support for the research, authorship, and/or publication of this article: This work was supported by NIH Grants R21HD061896, R01CA111289, T32CA009206 (A general training grant in radiological sciences related to cancer), and R01HD072077 (Assessment of collagen structure and tissue stiffness for cervical assessment with ultrasound).
Footnotes
The lookup table was generated using the Faran model for glass beads in a uniform background medium. Diameters ranged from 100 nm to 10 mm with logarithmic step sizes.
Declaration of Conflicting Interests
The author(s) declared the following potential conflicts of interest with respect to the research, authorship, and/or publication of this article: We have a long-standing collaborative research agreement with Siemens Ultrasound. From that agreement, we get technical support and, occasionally, equipment loans. Timothy J. Hall serves on an Advisory Board for Siemens Ultrasound.
References
- 1.Feleppa EJ, Lizzi FL, Coleman DJ, Yaremko MM. Diagnostic spectrum analysis in ophthalmology; a physical perspective. Ultrasound Med Biol. 1986;12(8):623–631. doi: 10.1016/0301-5629(86)90183-3. [DOI] [PubMed] [Google Scholar]
- 2.Insana MF, Hall TJ, Wood JG, Yan ZY. Renal ultrasound using parametric imaging techniques to detect changes in microstructure and function. Invest Radiol. 1993;28(8):720–725. doi: 10.1097/00004424-199308000-00013. [DOI] [PubMed] [Google Scholar]
- 3.Barzilai B, Sobel BE, Miller JG, Perez JE. Effects of myocardial-contraction on ultrasonic backscatter before and after ischemia. Am J Physiol. 1984;247(3):H478–H483. doi: 10.1152/ajpheart.1984.247.3.H478. [DOI] [PubMed] [Google Scholar]
- 4.Kimitsuki H, Parsons RE, Sigel B, Feleppa EJ, Golub RM, Justin J, et al. Effect of perfusion and blood content on ultrasonic backscattering in liver tissue. Ultrasound Med Biol. 1992;19(1):39–43. doi: 10.1016/0301-5629(93)90016-h. [DOI] [PubMed] [Google Scholar]
- 5.Bauer DC, Gluer CC, Cauley JA, Vogt TM, Ensrud KE, Genant HK, et al. Broadband ultrasound attenuation predicts fractures strongly and independently of densitometry in older women -A prospective study. Arch Intern Med. 1997;157(6):629–634. [PubMed] [Google Scholar]
- 6.Nicholas D. Evaluation of backscattering coefficients for excised human tissues: results, interpretation and associated measurements. Ultrasound Med Biol. 1982;8(1):17–28. [Google Scholar]
- 7.Lizzi FL, King DL, Rorke MC, Hui J, Ostromogilsky M, Yaremko MM, et al. Comparison of theoretical scattering results and ultrasonic data from clinical liver examinations. Ultrasound Med Biol. 1988;14(5):317–385. doi: 10.1016/0301-5629(88)90073-7. [DOI] [PubMed] [Google Scholar]
- 8.Insana MF, Wood JG, Hall TJ, Cox GG, Harrison LA. Effects of endothelin-1 on renal microvasculature measured using quantitative ultrasound. Ultrasound Med Biol. 1995;21(9):1143–1151. doi: 10.1016/0301-5629(95)02008-x. [DOI] [PubMed] [Google Scholar]
- 9.Mamou J, Coron A, Oelze ML, Saegusa-Beercroft E, Hata M, Lee P, et al. Three-dimensional high-frequency backscatter and envelope quantification of cancerous human lymph nodes. Ultrasound Med Biol. 2011;37(3):345–357. doi: 10.1016/j.ultrasmedbio.2010.11.020. [DOI] [PMC free article] [PubMed] [Google Scholar]
- 10.Fukushima T, Hasegawa H, Kanai H. Estimation of scatterer diameter by normalized power spectrum of high-frequency ultrasonic RF echo for assessment of red blood cell aggregation. Jpn J of Appl Phys. 2011;50:07HF02. [Google Scholar]
- 11.Nam K, Zagzebski JA, Hall TJ. Quantitative assessment of in vivo breast masses using ultrasound attenuation and backscatter. Ultrasonic Imaging. 2013;35(2):146–161. doi: 10.1177/0161734613480281. [DOI] [PMC free article] [PubMed] [Google Scholar]
- 12.Insana MF, Wagner RF, Brown DG, Hall TJ. Describing small-scale struc-ture in random media using pulse-echo ultrasound. J AcoustSoc Am. 1990;87(1):179–192. doi: 10.1121/1.399283. [DOI] [PMC free article] [PubMed] [Google Scholar]
- 13.Faran JJ. Sound scattering by solid cylinders and spheres. J AcoustSoc Am. 1951;23(4):405–418. [Google Scholar]
- 14.Anderson VC. Sound scattering from a fluid sphere. J AcoustSoc Am. 1950;22:426–431. [Google Scholar]
- 15.Insana MF, Brown DG. Biological Tissues as Ultrasonic Scattering Media. In: Shung KK, Thieme GA, editors. Ultrasonic Scattering in Biological Tissues. CRC Press; 1993. pp. 75–124. [Google Scholar]
- 16.Debye P, Anderson HR, Brumberger H. Scattering by an inhomogeneous solid. II. The correlation function and its application. J Appl Phys. 1957;28(6):679–683. [Google Scholar]
- 17.Sehgal CM, Greenleaf JF. Scattering of ultrasound by tissues. Ultrasonic Imaging. 1984;6:60–80. doi: 10.1177/016173468400600106. [DOI] [PubMed] [Google Scholar]
- 18.Liebermann L. The effect of temperature inhomogeneities in the ocean on propagation of sound. J AcoustSoc Am. 1951;23:563–570. [Google Scholar]
- 19.Pekeris CL. Note on the scattering of radiation in an inhomogeneous medium. Phys Rev. 1947;71:268–269. [Google Scholar]
- 20.Garra BS, Insana MF, Sesterhenn IA, Hall TJ, Wagner RF, Rotellar C, et al. Quantitative ultrasonic detection of parenchymal structural change in diffuse renal disease. Invest Radiol. 1994;29(2):134–140. doi: 10.1097/00004424-199402000-00002. [DOI] [PubMed] [Google Scholar]
- 21.Insana MF, Hall TJ, Fishback JL. Identifying acoustic scattering sources in normal renal parenchyma from the anisotropy in acoustical properties. Ultrasound Med Biol. 1991;17(6):613–626. doi: 10.1016/0301-5629(91)90032-r. [DOI] [PubMed] [Google Scholar]
- 22.Insana MF, Wood JG, Hall TJ. Identifying acoustic scattering sources in normal renal parenchyma in vivo by varying arterial and ureteral pressures. Ultrasound Med Biol. 1992;18(6–7):587–599. doi: 10.1016/0301-5629(92)90073-j. [DOI] [PubMed] [Google Scholar]
- 23.Insana MF, Wood JG, Hall TJ, Cox GG, Harrison LA. Effects of endothelin-1 on renal microvasculature measured using quantitative ultrasound. Ultrasound Med Biol. 1995;21(9):1143–1151. doi: 10.1016/0301-5629(95)02008-x. [DOI] [PubMed] [Google Scholar]
- 24.Wear KA, Garra BS, Hall TJ. Measurements of ultrasonic backscatter coefficients in human liver and kidney in vivo. J Acoust Soc Am. 1995;98(4):1852–1857. doi: 10.1121/1.413372. [DOI] [PubMed] [Google Scholar]
- 25.Hall TJ, Insana MF, Harrison LA, Cox GG. Ultrasonic measurement of glomerular diameters in normal adult humans. Ultrasound Med Biol. 1996;22(8):987–997. doi: 10.1016/s0301-5629(96)00142-1. [DOI] [PubMed] [Google Scholar]
- 26.Williams RM, Zipfel WR, Webb WW. Interpreting second-harmonic generation images of collagen I fibrils. Biophys J. 2005;88(2):1377–1386. doi: 10.1529/biophysj.104.047308. [DOI] [PMC free article] [PubMed] [Google Scholar]
- 27.Hall CS, Scott MJ, Lanza GM, Miller JG, Wickline SA. The extracellular matrix is an important source of ultrasound backscatter from myocardium. J Acoust Soc Am. 2000;107(1):612–619. doi: 10.1121/1.428327. [DOI] [PubMed] [Google Scholar]
- 28.Fields S, Dunn F. Correlation of echographic visualizability of tissue with biological composition and physiological state. J. Acoust. Soc. Am. 1973;54:809. doi: 10.1121/1.1913668. [DOI] [PubMed] [Google Scholar]
- 29.Lin EY, Jones JG, Li P, Zhu L, Whitney KD, Muller WJ, et al. Progression to malignancy in the polyoma middle T oncoprotein mouse breast cancer model provides a reliable model for human diseases. Am J Pathol. 2003;163(5):2113–2126. doi: 10.1016/S0002-9440(10)63568-7. [DOI] [PMC free article] [PubMed] [Google Scholar]
- 30.Insana MF, Hall TJ. Parametric ultrasound imaging from backscatter coefficient measurements: image formation and interpretation. Ultrasonic Imaging. 1990;12:245–267. doi: 10.1177/016173469001200402. [DOI] [PubMed] [Google Scholar]
- 31.Lizzi FL, Ostromogilsky M, Feleppa EJ, Rorke MC, Yaremko MM. Relationship of ultrasonic spectral parameters to features of tissue microstructure. IEEE Trans Ultrason Ferroelectr Freq Control. 1986;34(3):319–329. doi: 10.1109/t-uffc.1987.26950. [DOI] [PubMed] [Google Scholar]
- 32.Mamou J, Oelze ML, O’Brien WD, Jr, Zachary JF. Extended three-dimensional impedance map methods for identifying ultrasonic scattering sites. J Acoust Soc Am. 2008 Feb;123(2):1195–1208. doi: 10.1121/1.2822658. [DOI] [PMC free article] [PubMed] [Google Scholar]
- 33.Lavarello R, Oelze M. Quantitative ultrasound estimates from populations of scatterers with continuous size distributions. IEEE Trans Ultrason Ferroelectr Freq Control. 2011;58(4):744–753. doi: 10.1109/TUFFC.2011.1867. [DOI] [PubMed] [Google Scholar]
- 34.Insana MF, Madsen EL, Hall TJ, Zagzebski JA. Tests of the accuracy of a data reduction method for determination of acoustic backscatter coefficients. J Acoust Soc Am. 1986;79(5):1230–1236. doi: 10.1121/1.393702. [DOI] [PubMed] [Google Scholar]
- 35.Oelze ML, Zachary JF, O’Brien WD. Characterization of tissue microstructure using ultrasonic backscatter: Theory and technique for optimization using a Gaussian form factor. J Acoust Soc Am. 2002;112(3):1202–1211. doi: 10.1121/1.1501278. [DOI] [PubMed] [Google Scholar]
- 36.Oralkan O, Ergun AS, Cheng CH, Johnson JA, Karaman M, Lee TH, et al. Volumetric ultrasound imaging using 2-D CMUT arrays. IEEE Trans Ultrason Ferroelectr Freq Control. 2003;50(11):1581–1594. doi: 10.1109/tuffc.2003.1251142. [DOI] [PubMed] [Google Scholar]
- 37.Anderson JJ, Herd MT, King MR, Haak A, Hafez ZT, Song J, et al. Interlaboratory comparison of backscatter coefficient estimates for tissue-mimicking phantoms. Ultrasonic Imaging. 2010;32:48–64. doi: 10.1177/016173461003200104. [DOI] [PMC free article] [PubMed] [Google Scholar]
- 38.Yao LX, Zagzebski JA, Madsen EL. Backscatter coefficient measurements using a reference phantom to extract depth-dependent instrumentation factors. Ultrasonic Imaging. 1990;12:58–70. doi: 10.1177/016173469001200105. [DOI] [PubMed] [Google Scholar]
- 39.Nam K, Rosado-Mendez IM, Wirtzfeld LA, Pawlicki AD, Kumar V, Madsen EL, et al. Ultrasonic attenuation and backscatter coefficient estimates of rodent-tumor-mimicking structures: comparison of results among clinical scanners. Ultrasonic Imaging. 2011;33:233–250. doi: 10.1177/016173461103300403. [DOI] [PMC free article] [PubMed] [Google Scholar]
- 40.Nam K, Rosado-Mendez IM, Wirtzfeld LA, Ghoshal G, Pawlicki AD, Madsen EL, et al. Comparison of ultrasound attenuation and backscatter estimates in layered tissue-mimicking phantoms among three clinical scanners. Ultrasonic Imaging. 2012;34(4):209–221. doi: 10.1177/0161734612464451. [DOI] [PMC free article] [PubMed] [Google Scholar]
- 41.Thomson DJ. Spectrum estimation and harmonic analysis. P IEEE. 1982;70(9):1055–1096. [Google Scholar]
- 42.Rosado-Mendez IM, Nam K, Hall TJ, Zagzebski JA. Task-oriented comparison of power spectral density estimation methods for quantifying acoustic attenuation in diagnostic ultrasound using a reference phantom method. Ultrasonic Imaging. 2013;35(3):214–234. doi: 10.1177/0161734613495524. [DOI] [PMC free article] [PubMed] [Google Scholar]
- 43.Wirtzfeld LA, Ghoshal G, Hafez ZT, Nam K, Labyed Y, Anderson JJ, et al. Cross-imaging platform comparison of ultrasonic backscatter coefficient measurements of live rat tumors. J Ultrasound Med. 2010;29:1117–1123. doi: 10.7863/jum.2010.29.7.1117. [DOI] [PMC free article] [PubMed] [Google Scholar]
- 44.Chaturvedi P, Insana MF. Error bounds on ultrasonic scatterer size estimates. J. Acoust Soc Am. 1996;100(1):392–399. doi: 10.1121/1.415958. [DOI] [PubMed] [Google Scholar]
- 45.Hall TJ, Khant HA, Insana MF, Wood JG, Zhu Y, Preston D, et al. The utility of quantitative ultrasound for tracking the progression of polycystic kidney disease. Proceedings of the SPIE -The International Society for Optical Engineering. 2000;3982:161–171. [Google Scholar]
- 46.Sadeghi-Naini A, Papanicolau N, Falou O, Zubovits J, Dent R, Verma S, et al. Quantitative ultrasound evaluation of tumor death response in locally advanced breast cancer patients receiving chemotherapy. Clin Cancer Res. 2013;19(8):2163–2174. doi: 10.1158/1078-0432.CCR-12-2965. [DOI] [PubMed] [Google Scholar]


