

Abstract
For proper distribution of preventative resources, a more robust method of cardiac risk stratification should be encouraged in addition to merely reduced ejection fraction. To this end, the QRS‐T angle, an electrocardiogram‐derived measure of the difference in mean vectors of depolarization and repolarization, has been found associated with sudden cardiac death and other mortal and morbid outcomes in multiple observational studies over the past decade. The use of both frontal and spatial QRS‐T angle in the prediction of future cardiac events including sudden cardiac death, all‐cause mortality, and further cardiac morbidity is reviewed here.
Keywords: noninvasive techniques, electrocardiography, clinical, electrophysiology, cardiac arrest, sudden death
In this era of device cardiology, appropriate risk stratification equals proper distribution of resources, such that those with the highest risk have the clearest indication for various technologies. One prominent example is risk of sudden cardiac death (SCD) and use of implantable cardiac defibrillators (ICDs). Tools are available to assist in this process of risk stratification. The electrocardiogram (ECG) has proven to be high yield in stratifying patients to a greater or lesser degree of risk for a variety of cardiac morbidity and general mortality as it remains inexpensive, noninvasive, quick to perform, and quick to result. Vectorcardiography (VCG)—though an aged method of ECG analysis—has reemerged with the advent of digital electrocardiography. VCG visualizes movement of the heart vector through cardiac cycle as loops. The QRS loop reflects depolarization, whereas the T loop reflects repolarization. By VCG, one can measure a spatial angle between depolarization and repolarization, specifically a spatial angle between the spatial QRS vector and spatial T vector, namely spatial QRS‐T angle. An abnormally wide QRS‐T angle has emerged as a prominent variable in stratifying cardiac risk.
HISTORY AND MECHANISM
VCG emerged as a field of electrocardiography in the 1920s when Hubert Mann coined the concept of “loops” to express potential vectors during the cardiac cycle.1 Einthoven had also indicated that a vector quantity could define electric forces from the heart recorded on the surface of the body a decade prior.2 Multiple lead systems for measuring the VCG then developed, but the Frank system—emerging in the 1950s—became the most commonly used.3 The QRS‐T angle, a value obtained through VCG analysis, has been studied extensively since 1934, when Wilson et al. developed a concept of “ventricular gradient,” which is a vectorial sum of a spatial QRS‐T angle.4 He postulated that spatial ventricular gradient (1) expresses the heterogeneity of the action potential morphology, (2) is largely independent of the ventricular activation sequence, and (3) characterizes a “primary T‐wave,” or primary heterogeneity of repolarization, which was confirmed by later experimental and theoretical studies.5, 6, 7 Unlike spatial ventricular gradient, spatial QRS‐T angle characterizes a “secondary T‐wave,” i.e., secondary repolarization heterogeneity, whereby repolarization abnormalities secondary to depolarization abnormalities—i.e., changes in ventricular conduction—are highlighted including premature ventricular contraction, ventricular pacing, and bundle branch block, in the absence of primary action potential morphology heterogeneity. In this way QRS‐T angle complements the ventricular gradient, where both might be used to adequately assess a patient with either a primary, secondary, or mixed (e.g., left ventricular hypertrophy [LVH]) repolarization abnormality. Given that the mechanistic assertions above are based on somewhat antiquated primary research, there is a need for modern studies into the mechanisms of both ventricular gradient and QRS‐T angle.
METHODS OF MEASUREMENT
The spatial QRS‐T angle can be derived from manipulations of the VCG. Briefly, the VCG is either constructed using the orthogonal Frank leads or transformed from a digital 12‐lead ECG. Spatial QRS‐T angle could be directly measured as spatial “peak” QRS‐T (SP QRS‐T) angle, or calculated as a spatial “mean” QRS‐T (SM QRS‐T) angle. We briefly review differences between these two approaches below. For additional details we refer reader to the manuscript by Cortez and Schlegel.8
SP QRS‐T Angle
SP QRS‐T angle measures QRS‐T angle at the moment of maximum magnitude of the spatial QRS vector and T vectors within a three‐dimensional QRS loop and T loop, respectively. As an example, details of the measurement of SP QRS‐T angle, as performed in Tereshchenko laboratory, were described by Sur et al.9 First, the origin point is detected as halfway between the two points in one cardiac cycle that are closest in space but separated in time on a vectorcardiographic loop. Then, the peak of the spatial QRS and T vectors are detected as the furthest points from the origin point in the QRS‐loop and T‐loop, respectively (Fig. 1). The SP QRS‐T angle is calculated using the definition of the normalized inner product of spatial peak QRS and T vectors.
| (1) |
Figure 1.
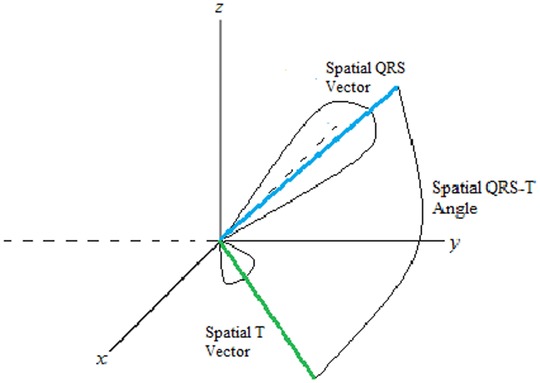
Schematic presentation of a spatial QRS‐T angle.
SM QRS‐T angle
Alternatively, spatial QRS‐T angle could be measured as an SM QRS‐T angle. SM QRS‐T angle uses the mean value of the spatial QRS vector over time during the QRS loop, and the mean value of the spatial T vector over time during the T loop, accordingly.9 In case of symmetrical loop “peak” and “mean” vectors are equal to each other.
| (2) |
The same equation could be expressed in several other ways:
| (3) |
| (4) |
Spatial “Simple” QRS‐T Angle
For those investigators who do not have readily available recorded or transformed XYZ leads, Rautaharju et al.10 developed simplified approach to compute spatial QRS‐T angle, which uses leads aVF, V2, V5, and V6. This approach includes several steps. First, “net” values of QRS complex amplitudes are calculated in each of aVF, V2, V5, and V6 leads as QRSnet = Ramp − |S/QSamp|. “Net” values of the T wave are calculated by measuring positive and negative T wave amplitudes, accordingly: Tnet = (+)Tamp − |(−)Tamp |. Then, spatial magnitudes of QRS and T are calculated according to equations: QRSsm = [(QRSnetV6)2 + (QRSnetaVF)2 + (QRSnetV2)2]1/2 and Tsm = [(TnetV5)2 +(TnetaVF)2 + (TnetV2)2]1/2. Finally, simple spatial QRS‐T angle (SS QRS‐T angle) is calculated as following:
Planar Frontal QRS‐T Angle
Projection of three‐dimensional spatial QRS and T vectors onto the frontal plane produces frontal QRSf and Tf vectors, respectively. The angle between the frontal QRSf and Tf vectors is designated the frontal QRS‐T angle (Figure 2). Frontal QRS‐T angle can be easily calculated from a standard 12‐lead ECG as the absolute value of the difference between the frontal plane QRS axis and T axis. If such a difference exceeds 180 degrees, then frontal QRS‐T angle is calculated as 360° minus the absolute value of the difference between the frontal plane QRS axis and T axis.
Figure 2.
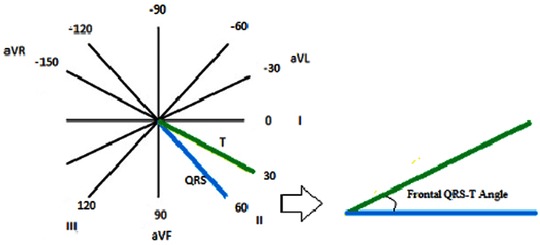
Measurement of a planar frontal QRS‐T angle.
Frontal versus Spatial QRS‐T Angle
Multiple observational studies have included in their analyses both frontal and spatial methods of computing QRS‐T angle,11, 12, 13, 14 often directly comparing their diagnostic and prognostic utility. Cross‐study comparison has proven challenging as each study often defines its own normal angles, not to mention significant population variance between studies. A 2011 observational study by Brown et al.11 compared the operating characteristics of spatial and frontal QRS‐T angle as a diagnostic tool for predicting underlying hypertrophic cardiomyopathy, left ventricular systolic dysfunction, and coronary heart disease (CHD). Digital ECGs of 580 total subjects were analyzed (370 with disease and 210 without). Not unexpectedly, spatial QRS‐T angle was found to predict underlying cardiac disease more consistently than frontal angles, suggesting improved diagnostic utility.
As these measures have been lauded more for their prognostic utility than diagnostic, there have been more studies to compare value in this regard. A 2009 study of patients with ICDs for ischemic cardiomyopathy concluded that both frontal and spatial methods held prognostic utility, though spatial angle seemed to hold stronger predictive value for ventricular tachyarrhythmias—a reasonable surrogate for SCD—than frontal angle.14 The Atherosclerosis Risk in Communities (ARIC) study of cardiovascular disease (CVD)‐free participants indicated a statistically significant increased risk of mortality and incident CHD in men and women with abnormal spatial and frontal QRS‐T angles.12 When correcting for other clinical variables, however, the only value to retain statistical significance for these outcomes in this study was spatial QRS‐T angle in women, suggesting less utility for frontal QRS‐T angle in lower risk populations. A 2012 study of 7052 patients free of CVD indicated significant predictive capacity for total and cardiac mortality with widened spatial QRS‐T angle. The frontal angle was only predictive in the male population—a result discordant with the aforementioned ARIC study, which only retained significance in the female population. Unfortunately, these two studies did not use equivalent normal ranges for the values of frontal angle, a common difficulty encountered in study comparison on this topic.13
QRS‐T Angle in Healthy Individuals
The QRS‐T angle, whether it is measured by spatial or frontal methods, varies by gender and age. Generally, women have a smaller angle at baseline than men, and in both sexes, the angle widens with age. Normal frontal angles are generally smaller than normal spatial angles.
Data describing the normal ranges of spatial QRS‐T angle, from either the Frank lead system or new digital ECG transformation methods, are varied. An earlier study in 1964 using the Frank lead system to calculate the spatial QRS‐T angle on 510 healthy men who were on average 40 years of age arrived at an upper limit of normal around 105° for men.15 Other studies since that time have mainly used the inverse Dower method, arriving at values ranging (by population) from 75°12, 16 to 130°.17 The largest study to report normality for men was an ARIC cohort of 5434 men aged around 54 years with an upper limit of normal of 110°.16 The upper limit defined for women in this study was 90°. For women, most studies have been more recent, the largest being a cohort of postmenopausal women in the Women's Health Initiative (WHI), with an upper limit of normal of 73°.18 Unfortunately there are no studies to stratify spatial QRS‐T normality by age. Most argue that this range should be stratified by age, gender, and method of digital ECG transformation, as some methods systematically overestimate derived vectors from the digital ECG.8 Of note, typically Dower‐related reconstructions have ranged higher than other approximations of the Frank lead system, including the Frank lead system itself, such that if a set of normal ranges were defined with the Dower method, then there is a false negative risk if a patient's VCG were to be analyzed using different methods without this systematic error. As reported by Cortez and Schlegel, the Dower‐related reconstruction typically yields a spatial QRS‐T angle from 66° to 81°, whereas those derived from Kors’ regression‐related reconstructions have typically ranged from 44° to 65°, with values obtained from the true Frank leads being 35°–51°.8
Among studies included below, the upper limits of normal for the frontal angle have ranged (Tables 1, 2, 3). Historically, upper limits of normal have been between 45° and 60°.19 A 2012 cohort of older patients deemed free of CVD at the start of the study described the gender‐specific upper limits of normal as 39° for women and 81° for men.13
Table 1.
Summary of Observational Studies Relating Wide QRS‐T Angle to Sudden Cardiac Death (SCD)
| Study | Population Size | Average Age | Population Type | Follow‐up Period | Frontal vs. Spatial | Endpoint and Risk |
|---|---|---|---|---|---|---|
| de Bie et al.22 | 277 | 56 years | Dialysis patients | 2.1 years | Spatial (men >130°, women >116°) | SCD: HR 2.99 |
| Pavri et al.25 | 455 | 58 years | All patients with nonischemic cardiomyopathy. | 2.5 years | Frontal (>90°) | Composite (death, appropriate ICD or resuscitated arrest): HR 1.64 |
| Aro et al.23 | 10,957 | 44 years | General population | 30 years | Frontal (>100°) | SCD: HR 2.26 |
ICD, implantable cardiac defibrillator; HR, hazard ratio.
Table 2.
Summary of Observational Studies Relating Wide QRS‐T Angle to Cardiovascular Mortality
| Study | Population Size | Average Age | Risk | Follow‐up Period | Frontal vs. Spatial | Endpoint and Risk |
|---|---|---|---|---|---|---|
| Kors et al.20 | 6134 | 69 years | General population. | 6.7 years | Spatial (>135°) | Cardiac mortality: HR 3.7 |
| Yamazaki et al.26 | 46,573 | 57 years | VA ECGs obtained for any reason, | 6 years | Spatial (>100°) | Cardiac mortality: HR 3.6 |
| Rautaharju et al.24 | 38,283 | 62 years | Postmenopausal women. | 6.2 years | Spatial (>96°) | CHD mortality: HR 2.1 |
| Kentta et al.21 | 1297 | 56 years | Patients undergoing exercise stress test for CHF follow‐up. | 4 years | Total cosine R‐to‐T | Cardiac mortality: HR 5.6 |
| Aro et al.23 | 10,957 | 44 years | General population | 30 years | Frontal (>100°) | Cardiac mortality: NS |
| Whang et al.13 | 7052 | 56 years | Patients free of CVD | 14 years | Frontal (men >95°, women >43°) & spatial (men >135°, women >120°) | CV mortality: spatial, men: 2.08 spatial, women: 2.05 frontal, men: elevated* frontal, women: NS |
| Lipton et al.27 | 2347 | 61 years | Patients undergoing stress ECHO for CHD evaluation. | 7 years | Spatial (>135°) | Cardiac death: HR 1.9 |
CHD, coronary heart disease.
Table 3.
Summary of Observational Studies Relating Wide QRS‐T Angle to Total Mortality
| Study | Population Size | Average Age | Risk | Follow‐up Period | Frontal vs. Spatial | Endpoint and Risk |
|---|---|---|---|---|---|---|
| Kors et al.20 | 6134 | 69 years | General population | 6.7 years | Spatial (>135°) | Total mortality: HR 1.8 |
| de Torbal et al.28 | 2641 | 69 years | Patients evaluated for chest pain | 6.3 years | Spatial (>135°) | Total Mortality: HR 1.5 |
| Rautaharju et al. cohort18 | 38.283 | 62 years | Postmenopausal women | 6.2 years | Spatial (>96°) | Total mortality: HR 2.98 |
| Pavri et al.25 | 455 | 58 years | All patients with nonischemic cardiomyopathy | 2.5 years | Frontal (>90°) | Total mortality: NS |
| Borleffs et al.14 | 412 | 63 years | Patients with ICD in place | 2 years | Spatial (>100°) and frontal (>90°) | Total mortality: spatial: NS frontal: HR 2.3 |
| Zhang et al.12 | 13973 | 54 years | General population | 14.3 years | Spatial (>123 men, >110 women) and frontal (>73 men, >67 women) | Total mortality, men: planar‐2.3 spatial‐2.16 total mortality, women: planar‐ 2.57 spatial‐ 3.08 |
| Lipton et al. 27 | 2347 | 61 years | Patients undergoing stress ECHO for CHD evaluation. | 7 years | spatial (>135°) | Total mortality: HR 1.5 |
| Rubulis et al.29 | 187 | 58 years | Patients with CHD scheduled for first angioplasty. | 8 years | Spatial (>101°) | Non‐CV death: NS |
| Lown et al.30 | 1843 | 60 years | Patients with acute coronary syndrome. | 2 years | Frontal (>105°) | Total mortality: HR 1.9 |
| Aro et al.23 | 10.957 | 44 years | General population | 30 years | Frontal (>100°) | Total mortality: HR 1.57 |
| Whang et al.13 | 7052 | 56 years | Patients free of CVD | 14 years | Frontal (men >95°, women >43°) and spatial (men >135°, women >120°) | Total mortality, men: spatial HR 1.78, frontal HR 1.47, total mortality, women: spatial HR 1.46, frontal NS |
| de Bie et al.22 2013 | 277 | 56 years | Dialysis patients | 2.1 years | Spatial (men >130°, women >116°) | Total mortality: HR 2.33 |
| Gotsman et al.31 | 5038 | 75 years | Patients with CHF (bother preserved and reduced EF) | 1.5 years | Frontal (men >130°, women >125°) | Total mortality, men: HR 1.53 total mortality, women: HR 1.35 |
CHF = chronic heart failure; EF = ejection fraction, CVD = cardiovascular disease.
Association with SCD
Beginning with initial observational study by Kors et al. into the use of the spatial QRS‐T angle as an indicator of cardiac death,20 a variety of studies have looked at this question in various populations from low risk21 to high risk,14, 20 and all have discovered a concerning association with both cardiac mortality and SCD. See Table 1 for cross‐study comparisons.
The initial study from 200320 describing these associations in the Rotterdam population, a group of 6134 patients from the general population, discovered a statistically significant hazard ratio of 5.6 for SCD in patients with an abnormal spatial QRS‐T angle, which remained significant when controlling for clinical and other ECG risk factors. Of note, QRS‐T angle carried the highest ratio among other traditional ECG indicators of poor prognosis, including ST depression, T wave inversion, left ventricular hypertrophy by ECG criteria, abnormal T wave axis, and prolonged QTc.
A study conducted on 277 dialysis patients in 201322 also showed significantly increased risk in patients with an abnormally wide QRS‐T angle, with a hazard ratio of 4.5 that remained significant on multivariate analysis. This is to say that the spatial QRS‐T angle carries with it a higher predictive value among groups traditionally considered to be at higher risk of cardiovascular morbidity and mortality.
Frontal QRS‐T angle has been less rigorously studied as a predictive indicator of SCD. The largest study to ask this question involved the Finnish CHD cohort of 10,957 middle‐aged patients from the general population.23 A widened frontal QRS‐T angle (>100°) in this low‐risk group yielded a three‐times increased risk of SCD. A similar study in a somewhat lower risk, but older group of 7052 patients from the National Health and Nutrition Examination Survey III cohort deemed free of CVD at the start of the study yielded less impressive, but still significant hazard ratios, indicating a doubling of risk for cardiovascular death (including suspected SCD and other cardiovascular‐related causes).13 Though patients were initially screened to lower risk of baseline CVD, the average age was a decade greater than the Finnish cohort above, and one would expect this would drive hazard ratios up, but with the composite endpoint of CVD death as opposed to SCD, there may be some deaths included which QRS‐T angle did not predict, diluting its predictive power.
Association with Documented Ventricular Arrhythmias
Widened QRS‐T angle has been shown to predict ventricular arrhythmias. Borleffs et al. conducted this study14 in a higher risk population of 412 patients who all had ICDs implanted with an endpoint of first appropriate ICD therapy. The significance of an abnormal spatial QRS‐T angle was strong, as might be expected, with an adjusted hazard ratio of 7.3 that was also statistically significant.
Association with Cardiovascular Mortality
As one might expect, widened QRS‐T angle has been shown to be predictive of cardiovascular mortality as well (Table 2). This end‐point acts as a grab bag for multiple adverse events leading to death and is defined differently dependent on the study, with some overlap with SCD, but there was a large study of 38,283 postmenopausal women, which indicated a hazard ratio of 2.12 for death from myocardial infarction in women who had baseline CVD.24 A similar pattern for worsened cardiovascular mortality with widened spatial QRS‐T angle is observed in lower‐risk populations, as well as men. A study on 7052 men and women thought free of CVD at the onset of study indicated a significantly increased risk of cardiac death at 14 years with an abnormally wide spatial QRS‐T angle (men >135°, woman >120°), with hazard ratios of 2.05 and 2.08 for men and women, respectively.13
Though frontal angle has been shown to be predictive of total mortality, evidence to indicate predictive power for cardiac mortality is not as strong. In a study of 7052 men and women considered free of CVD prior to the study, an abnormally wide frontal QRS‐T angle (men >95°, women >43°) indicated increased risk for cardiac death in men, but did not retain significance on multivariate analysis in women. Further yet, a younger, general population study of 10,957 patients did not show a significantly increased risk of nonarrhythmic cardiac death with an abnormally wide frontal QRS‐T angle (>100°, not stratified by gender).23
Association with All‐Cause Mortality
Multiple studies (Table 3) have tracked total mortality as it relates to an abnormally wide spatial QRS‐T angle, with all studies positive. The largest study to show a positive association was performed in 38,283 postmenopausal women participating in the WHI cohort.18 Those with baseline CVD and a wide QRS‐T angle had a nearly three‐times increased risk of all‐cause mortality compared to those with a normal QRS‐T angle. This relationship was more modest, yet still significant, in those without baseline CVD with hazar ration of 1.28 for those with a wide spatial QRS‐T angle.
Frontal QRS‐T angle has been shown in multiple large, varied populations to be predictive of all‐cause mortality. The largest study to look at this question seems to be the Finnish CHD cohort.23 In this study of the general population, a widened (>100°) frontal QRS‐T angle yielded a hazard ratio of 1.8 for total mortality that remained statistically significant in multivariate analysis. However, another smaller study of 455 patients in the DEFINITE trial20 including patients nonischemic cardiomyopathy did not retain significance in multivariate analysis. Again, to emphasize study variance, this study defined abnormal as >90°, and did not stratify by gender.
Summary and Future Direction
Over the past decade, substantial evidence has accumulated for the use of QRS‐T angle measure in predicting adverse cardiac outcomes. There is suggestion of a stronger relationship in women. In the future, use of this measure in combination with other ECG risk markers of SCD is needed for development of ECG risk score of SCD, with subsequent evaluation of the ECG SCD risk score in prospective studies to guide preventive interventions.
Disclosure: This work was partially supported by the 1R01HL118277 (LGT).
REFERENCES
- 1. Mann H. A method of analyzing the electrocardiogram. Arch Intern Med 1920;25:283–94. [Google Scholar]
- 2. Einthoven W. Over de beteekenis der electro‐physiologie als een onderdeel van de leer der levensverrichtingen. Leiden Brill 1906, pp 1–34. [Google Scholar]
- 3. Frank E. An accurate, clinically practical system for spatial vectorcardiography. Circulation 1956;13:737–749. [DOI] [PubMed] [Google Scholar]
- 4. Wilson FN, Macleod AG, Barker PS, et al. The determination and the significance of the areas of the ventricular deflections of the electrocardiogram. Am Heart J 1934;10:46–61. [Google Scholar]
- 5. Geselowitz DB. The ventricular gradient revisited: relation to the area under the action potential. IEEE Trans Biomed Eng 1983;30:76–77. [DOI] [PubMed] [Google Scholar]
- 6. Plonsey R. A contemporary view of the ventricular gradient of Wilson. J Electrocardiol 1979. ;12:337–341. [DOI] [PubMed] [Google Scholar]
- 7. Burger HC. A theoretical elucidation of the notion ventricular gradient. Am Heart J 1957. ;53:240–246. [DOI] [PubMed] [Google Scholar]
- 8. Cortez DL, Schlegel TT. When deriving the spatial QRS‐T angle from the 12‐lead electrocardiogram, which transform is more Frank: Regression or inverse Dower? J Electrocardiol 2010;43:302–309. [DOI] [PubMed] [Google Scholar]
- 9. Sur S, Han L, Tereshchenko LG. Comparison of sum absolute QRST integral, and temporal variability in depolarization and repolarization, measured by dynamic vectorcardiography approach, in healthy men and women. PLoS One 2013;8:e57175. [DOI] [PMC free article] [PubMed] [Google Scholar]
- 10. Rautaharju PM, Prineas RJ, Zhang ZM. A simple procedure for estimation of the spatial QRS/T angle from the standard 12‐lead electrocardiogram. J Electrocardiol 2007;40:300–304. [DOI] [PubMed] [Google Scholar]
- 11. Brown RA, Schlegel TT. Diagnostic utility of the spatial versus individual planar QRS‐T angles in cardiac disease detection (STAFF Symposium). J Electrocardiol 2011;44:404–409. [DOI] [PubMed] [Google Scholar]
- 12. Zhang ZM, Prineas RJ, Case D, et al. Comparison of the prognostic significance of the electrocardiographic QRS/T angles in predicting incident coronary heart disease and total mortality (from the atherosclerosis risk in communities study). Am J Cardiol 2007;100:844–849. [DOI] [PMC free article] [PubMed] [Google Scholar]
- 13. Whang W, Shimbo D, Levitan EB, et al. Relations between QRS|T angle, cardiac risk factors, and mortality in the third National Health and Nutrition Examination Survey (NHANES III). Am J Cardiol 2012;109:981–987. [DOI] [PMC free article] [PubMed] [Google Scholar]
- 14. Borleffs CJ, Scherptong RW, Man SC, et al. Predicting ventricular arrhythmias in patients with ischemic heart disease: clinical application of the ECG‐derived QRS‐T angle. Circ Arrhythm Electrophysiol 2009;2:548–554. [DOI] [PubMed] [Google Scholar]
- 15. Draper HW, Peffer CJ, Stallmann FW, et al. The corrected orthogonal electrocardiogram and vectorcardiogram in 510 normal men (Frank lead system). Circulation 1964;30:853–864. [DOI] [PubMed] [Google Scholar]
- 16. Rautaharju PM, Prineas RJ, Wood J, et al. Electrocardiographic predictors of new‐onset heart failure in men and in women free of coronary heart disease (from the Atherosclerosis in Communities [ARIC] Study). Am J Cardiol 2007;100:1437–1441. [DOI] [PubMed] [Google Scholar]
- 17. Scherptong RW, Henkens IR, Man SC, et al. Normal limits of the spatial QRS‐T angle and ventricular gradient in 12‐lead electrocardiograms of young adults: dependence on sex and heart rate. J Electrocardiol 2008;41:648–655. [DOI] [PubMed] [Google Scholar]
- 18. Rautaharju PM, Kooperberg C, Larson JC, et al. Electrocardiographic predictors of incident congestive heart failure and all‐cause mortality in postmenopausal women: The Women's Health Initiative. Circulation 2006;113:481–489. [DOI] [PubMed] [Google Scholar]
- 19. Ziegler R, Bloomfield DK. A study of the normal QRS‐T angle in the frontal plane. J Electrocardiol 1970;3:161–167. [DOI] [PubMed] [Google Scholar]
- 20. Kors JA, Kardys I, van der Meer IM, et al. Spatial QRS‐T angle as a risk indicator of cardiac death in an elderly population. J Electrocardiol 2003;36 Suppl:113–114. [DOI] [PubMed] [Google Scholar]
- 21. Kentta T, Karsikas M, Junttila MJ, et al. QRS‐T morphology measured from exercise electrocardiogram as a predictor of cardiac mortality. Europace 2011;13:701–707. [DOI] [PubMed] [Google Scholar]
- 22. de Bie MK, Koopman MG, Gaasbeek A, et al. Incremental prognostic value of an abnormal baseline spatial QRS‐T angle in chronic dialysis patients. Europace 2013;15:290–296. [DOI] [PubMed] [Google Scholar]
- 23. Aro AL, Huikuri HV, Tikkanen JT, et al. QRS‐T angle as a predictor of sudden cardiac death in a middle‐aged general population. Europace 2012;14:872–876. [DOI] [PubMed] [Google Scholar]
- 24. Rautaharju PM, Kooperberg C, Larson JC, et al. Electrocardiographic abnormalities that predict coronary heart disease events and mortality in postmenopausal women: The Women's Health Initiative. Circulation 2006;113:473–480. [DOI] [PubMed] [Google Scholar]
- 25. Pavri BB, Hillis MB, Subacius H, et al. Prognostic value and temporal behavior of the planar QRS‐T angle in patients with nonischemic cardiomyopathy. Circulation 2008;117:3181–3186. [DOI] [PubMed] [Google Scholar]
- 26. Yamazaki T, Froelicher VF, Myers J, et al. Spatial QRS‐T angle predicts cardiac death in a clinical population. Heart Rhythm 2005;2:73–78. [DOI] [PubMed] [Google Scholar]
- 27. Lipton JA, Nelwan SP, van Domburg RT, et al. Abnormal spatial QRS‐T angle predicts mortality in patients undergoing dobutamine stress echocardiography for suspected coronary artery disease. Coronary Artery Dis 2010;21:26–32. [DOI] [PubMed] [Google Scholar]
- 28. de Torbal A, Kors JA, van Herpen G, et al. The electrical T‐axis and the spatial QRS‐T angle are independent predictors of long‐term mortality in patients admitted with acute ischemic chest pain. Cardiology 2004;101:199–207. [DOI] [PubMed] [Google Scholar]
- 29. Rubulis A, Bergfeldt L, Ryden L, et al. Prediction of cardiovascular death and myocardial infarction by the QRS‐T angle and T vector loop morphology after angioplasty in stable angina pectoris: An 8‐year follow‐up. J Electrocardiol 2010;43:310–317. [DOI] [PubMed] [Google Scholar]
- 30. Lown MT, Munyombwe T, Harrison W, et al. Association of frontal QRS‐T angle–age risk score on admission electrocardiogram with mortality in patients admitted with an acute coronary syndrome. Am J Cardiol 2012;109:307–313. [DOI] [PubMed] [Google Scholar]
- 31. Gotsman I, Keren A, Hellman Y, et al. Usefulness of electrocardiographic frontal QRS‐T angle to predict increased morbidity and mortality in patients with chronic heart failure. Am J Cardiol 2013;111:1452–1459. [DOI] [PubMed] [Google Scholar]