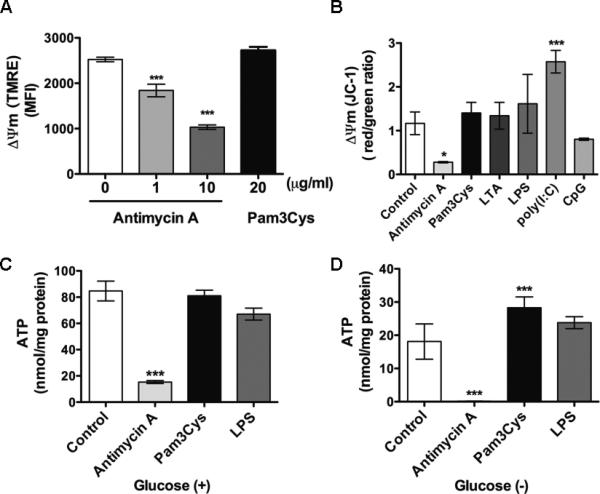
Figure 3. TLR2 activation has no impact on mitochondrial ΔΨm and intracellular ATP production.

A-B, Mitochondrial ΔΨm measurements. Mitochondrial ΔΨm was detected with TMRE (A) or JC-1 (B) dye. A, Peritoneal leukocytes were treated with the indicated concentrations of antimycin A or Pam3Cys for 1 h and analyzed for ΔΨm with flow cytometry. *** P < 0.001 versus control. The numbers of samples in each group: 0 μg/ml Antimycin A, n=7; 1 μg/ml Antimycin A, n = 5; 10 μg/ml Antimycin A, n = 3; 20 μg/ml Pam3cys, n = 4. The experiments were performed twice. B, Cells were treated with antimycin A or TLR ligands as indicated: Pam3Cys, LTA, LPS, Poly (I:C) or CpG, all at 20 μg/ml, for 1 h and analyzed for ΔΨm with fluorescence ratio detection. n=3 in each group. * P < 0.05, *** P < 0.001 versus control. The experiments were performed twice. C-D, ATP production in the presence or absence of glucose. C, Cells were treated with antimycin A, Pam3Cys or LPS (all at 20 μg/ml) in glucose containing medium for 4 h and analyzed for ATP production with a ATP bioluminescence assay kit. n=3 in each group. The experiments were performed three times. D, Cells were treated with antimycin A, Pam3Cys or LPS (all at 20 μg/ml) in glucose-free medium for 1 h and analyzed for intracellular ATP level, *** P < 0.001 versus control. Each error bar represents mean ± SEM. The numbers of samples in each group: Control, n = 5; Antimycin A, n = 5; Pam3cys, n = 5; LPS, n = 5. MFI = mean fluorescence intensity; ΔΨm = membrane potential; TMRE = tetramethylrhodamine ethyl ester perchlorate; ATP = adenosine triphosphate; LTA = lipoteichoic acid; LPS = lipopolysaccharides.
