

Abstract
Seizures frequently accompany gliomas and often escalate to peritumoral epilepsy. Previous work revealed the importance of tumor-derived excitatory glutamate (Glu) release mediated by the cystine-glutamate transporter (SXC) in epileptogenesis. We now show a novel contribution of GABAergic disinhibition to disease pathophysiology. In a validated mouse glioma model, we found that peritumoral parvalbumin-positive GABAergic inhibitory interneurons are significantly reduced, corresponding with deficits in spontaneous and evoked inhibitory neurotransmission. Most remaining peritumoral neurons exhibit elevated intracellular Cl− concentration ([Cl−]i) and consequently depolarizing, excitatory GABA responses. In these neurons, the plasmalemmal expression of KCC2, which establishes the low [Cl−]i required for GABAAR-mediated inhibition, is significantly decreased. Interestingly, reductions in inhibition are independent of Glu release, but the presence of both decreased inhibition and decreased SXC expression is required for epileptogenesis. We suggest GABAergic disinhibition renders peritumoral neuronal networks hyper-excitable and susceptible to seizures triggered by excitatory stimuli, and propose KCC2 as a therapeutic target.
Keywords: glioma, GABA, peritumoral epilepsy, KCC2
INTRODUCTION
For the approximately 25,000 patients in the US annually diagnosed with a glioma (Porter, McCarthy, Freels, Kim, and Davis, 2010), the most common and lethal primary brain tumor, treatment options are limited and ineffective (Zalutsky, 2005). Over 80% of glioma patients report seizures (Hildebrand, Lecaille, Perennes, and Delattre, 2005), and 35% continue to have spontaneous seizure recurrence, which is termed tumor-associated (i.e., peritumoral) epilepsy (Hauser, Annegers, and Kurland, 1993). These episodes can be debilitating, since they are often refractory to anti-epileptic drugs (AEDs) (Chang, Potts, Keles, Lamborn, Chang, Barbaro, and Berger, 2008).
Prior work has shown that the excitatory amino acid neurotransmitter glutamate (Glu) accumulates in peritumoral tissue due to its avid release from tumors via the “system xc” (SXC) cystine-glutamate anti-porter (Ye, Rothstein, and Sontheimer, 1999). A retrospective analysis of 190 patients showed that an increased expression of SXC in glioma patients correlated with the severity of tumor-associated seizures (Yuen, Morokoff, Bjorksten, D’Abaco, Paradiso, Finch, Wong, Reid, Powell, Drummond, Rosenthal, Kaye, and O’Brien, 2012). Microdialysis studies in ambulatory glioma patients demonstrated Glu concentrations in excess of 100 μM in peritumoral regions (Marcus, Carpenter, Price, and Hutchinson, 2010). Such concentrations suggest deficiencies in the otherwise powerful Glu uptake systems in glia (Danbolt, 2001), and high Glu levels may cause excitotoxicity and aid glioma growth by vacating space for tumor expansion (Ye and Sontheimer, 1999; Takano, Lin, Arcuino, Gao, Yang, and Nedergaard, 2001).
While there is strong evidence for increased peritumoral Glu contributing to seizures (Buckingham, Campbell, Haas, Montana, Robel, Ogunrinu, and Sontheimer, 2011), the hyperexcitability of peritumoral networks is likely not exclusively due to elevated Glu levels, as suggested from studies in animal models (Buckingham, Campbell, Haas, Montana, Robel, Ogunrinu, and Sontheimer, 2011). In the normal brain, GABAergic interneurons are essential to counteract excitatory glutamatergic activity and maintain a delicate excitation-inhibition balance (Scharfman, 2007). Gamma-aminobutyric acid receptors (GABAARs) are ligand-gated Cl−-permeable ion channels whose response to GABA (depolarizing versus hyperpolarizing) is largely dictated by the [Cl−]i in post-synaptic neurons, which is primarily established by the activity of the K+-Cl− cotransporter KCC2 – an electroneutral, neuronal-specific member of the SLC12A family of cation-Cl− cotransporters (Payne, Stevenson, and Donaldson, 1996). GABAA receptor channels are also slightly permeable to bicarbonate ions (Ben-Ari, Gaiarsa, Tyzio, and Khazipov, 2007). Changes in GABAergic function, attributable to either alteration in interneuron number (Knopp, Frahm, Fidzinski, Witte, and Behr, 2008), connectivity (Ratte and Lacaille, 2006), functional expression of GABAR subunits (Isokawa, 1996), or indirectly via impaired KCC2-mediated Cl− extrusion (Barmashenko, Hefft, Aertsen, Kirschstein, and Kohling, 2011), have all been reported to contribute to the pathogenesis of other epilepsy subtypes. We hypothesized a concomitant reduction in GABAergic inhibition of peritumoral neurons might contribute to the development of peritumoral epilepsy.
To test this hypothesis, we developed a glioma mouse model that exhibits robust generalized tonic-clonic seizures with corresponding epileptic activity on electroencephalography (EEG). Cortical slices from these animals show a significant reduction in spontaneous and evoked inhibitory neurotransmission, loss of parvalbumin-positive GABAergic interneurons, and significantly decreased KCC2 membrane expression in peritumoral neurons. Gramicidin patch-clamp experiments show an increase in the percentage of peritumoral neurons exhibiting depolarizing GABA responses, and in these neurons, intracellular Cl− is significantly increased. A reduction in peritumoral GABAergic inhibition is present independent of the level of SXC-mediated Glu release; however, only the combined presence of decreased KCC2 and increased SXC functional expression resulted in the development of epilepsy.
METHODS
Mice
Mice were bred and maintained in a specific pathogen free (SPF) barrier facility and all procedures were approved and performed in accordance with guidelines of the Institutional Animal Care and Use Committee (IACUC) of the University of Alabama at Birmingham. Mice were housed in groups of 5 animals at maximum and subjected to a standard 12h light/12h dark cycle. Adult 8 to 12 weeks old C.B.17 scid mice of either sex were used for tumor implantations unless stated otherwise.
Surgical procedure
Glioma cells were implanted into 6–12 week old C.B.-17 scid scid mice of either sex. On the day of surgery, once animals were anesthetized by 2–5% isoflurane, a midline scalp incision was created. A 0.5 mm burr hole was made at 1.0–2.0 mm and 0.5–1.0 mm posterior from bregma. Patient-derived xenograft tumors (GMB14 and GBM22; 1.0–1.5 x 10⁵) were injected into either one or both hemispheres at 1.0–2.0 mm depth. Following surgery, intracranial tumors grew for 2–4 weeks. Sham animals were injected with methylcellulose. Body weight was monitored periodically and mice showing significant loss of body weight indicating tumor growth were chosen for experiments.
Maintenance and preparation of patient-derived xenograft tumor lines
Patient xenograft cells were derived from primary brain tumor tissue and maintained by serial passage in the flank of athymic nude mice. Tumors were harvested, mechanically dissociated, and maintain in culture as spheres in Neurobasal-A medium (Invitrogen) supplemented with 10mg/ml of EGF and FGF (Invitrogen), 250 μM/ml amphotericin, 50mg/ml gentamycin (Fisher), 260mM L-glutamine (Invitrogen), and 10 ml B-27 Supplement w/o Vitamin A (Invitrogen). Xenograft cells were maintained as spheres in vitro for 5–7 days before intracranial injections in scid mice.
EEG acquisition
Intracranial recording electrodes were placed (Plastics One, Inc.) on the right hemisphere with a ground on the left. We acquired data (250 Hz sampling rate) using 8 Biopac Systems amplifiers and AcqKnowledge 4.0 EEG Acquisition and Reader Software (BIOPAC Systems Inc.). Digitized files were analyzed offline by a blinded investigator using AcqKnowledge 4 software. Events of 12–15 Hz, and ≥ 5 x baseline amplitude were flagged for further analysis; duration, amplitude and frequency were computed in AcqKnowledge software. We used corresponding video (L20WD800 Series, Lorex Technology, Inc.) to assess behavior.
Electrophysiology
Anesthetized animals were decapitated and brains immersed in ice-cold ACSF [(in mM): 135 NMDG, 1.5 KCl, 1.5 KH2PO4, 23 choline bicarbonate, 25 D-glucose, 0.5 CaCl2, 3.5 MgSO4]. Coronal slices (300 μm) recovered 1 h in ACSF [(in mM): 125 NaCl, 3 KCl, 1.25 NaH2PO4, 25 NaHCO3, 2 CaCl2, 1.3 MgSO4, 25 glucose] at 37° then transferred to a recording chamber. Since the effect of tumors on different cell types in our model is not yet established we chose to conduct all electrophysiological recordings from layer 2/3 pyramidal cells. For whole-cell recordings of spontaneous postsynaptic currents (sPSC) (Figure 2), cells were held at −70 mV and intracellular solution contained [(in mM): 134 K-gluconate, 10 KCl, 10 HEPES, 2 Mg-ATP, 0.2 Na-GTP, and 0.5 EGTA, pH 7.4, 285–290 mOsm]. For inhibitory postsynaptic current (IPSC) recordings (Figure 3) we used [(in mM): Cs-gluconate 120, CsCl 17.5, Na-HEPES 10, Mg-ATP 4, Na-GTP 0.4, Na2-creatine phosphate 10, Na-EGTA 0.2]. IPSCs were recorded as outward currents at a holding potential of 0 mV. For mIPSCs, 1 μM TTX was added to perfusate. We made tight seals with patch electrodes (KG-33 glass, Garner Glass) with a 3–5 MΩ open-tip resistance. Evoked IPSCs (eIPSCs) were elicited at 0.05 Hz using a bipolar electrode placed in deeper cortical layers. Pulses (50 μs) were applied and their intensity was increased until the threshold for eliciting a detectable monosynaptic eIPSC was reached. Monosynaptic eIPSCs recorded in layer 2/3 sham cortical pyramidal neurons varied in amplitude with the position of the stimulating electrode. Therefore, to minimize variability between groups, the stimuli in all experiments were delivered in layer V just below the soma of the recorded cell. Incremental increasing stimulus intensities were then applied to construct the input out curve. Evoked and spontaneous IPSCs were abolished by bath application of 10 μM Bic to confirm a role for postsynaptic GABAA receptors (data not shown). Monosynaptic eIPSCs recorded in layer 2/3 sham cortical pyramidal neurons varied in amplitude with the position of the stimulating electrode. IPSCs were recorded in the presence of DL-2-Amino-5-phosphonopentanoic acid (APV) and 6-Cyano-7-nitroquinoxaline-2,3-dione disodium salt hydrate (CNQX). Therefore, to minimize variability between groups, the stimuli in all experiments were delivered in layer V just below the soma of the recorded cell where the input/output slope of peak eIPSC amplitudes is steep. All recordings were made >100 μm from the tumor edge, since the population of cells directly at the tumor edge might be physically compromise and therefore respond differently.
Figure 2.

Peritumoral neurons display hyperexcitability. (A) Representative recordings in ACSF of sPSCs in sham (top) and spontaneous epileptiform event observed in tumor-bearing slice (bottom). Inset below tumor trace shows two spontaneously occurring epileptiform events in tumor-bearing slice on an expanded time scale. Spontaneous epileptiform events were never observed in recordings from sham slices. (B) Representative recordings from sham (left) and tumor (right) slices, showing the latency to (10 μM) Bic-induced epileptiform activity was significantly shorter in tumor-bearing slices. Inset below sham and tumor traces shows inward currents on an expanded time scale. (C) Summary of the percent of slices showing epileptiform activity in sham and tumor-bearing slices. (D) Summary of the latency to Bic-induced epileptiform events in sham and tumor-bearing slices.
Figure 3.

Decreased inhibition in peritumoral cortex. (A) Cortical PV-ir shown at low magnification (top) of a sham control and tumor-bearing slice. Scale bar, 50 μm. (Bottom) Higher magnification showing round shape individual PV-positive neurons from sham and longer flattened PV-neurons from peritumoral cortex. Scale bar, 10 μm. (B) Quantification of PV cell loss in layer 2/3 of the peritumoral cortex. Cells were counted ~100 μm from tumor edge. (C) Sample recordings of sIPSCs and mIPSCs (F) from sham (left) and tumor-associated cells (right) recorded from layer II/III pyramidal cells. Lower traces show individual events on an expanded timescale. (D) Summary of the frequency of sIPSC and mIPSC (G) and amplitude of sIPSC (E) and mIPSC (H). (I) Pooled data of the mean threshold stimulus intensity required to evoke IPSCs in sham and peritumoral neurons. (J) Stimulus response curve of the peak amplitude plotted versus stimulation intensities from neurons in sham and tumor-bearing slices. Representative IPSC traces evoked in sham (top) and tumor-bearing slices (bottom) in response to increasing stimulation intensities.
For perforated patch-clamp recordings (Figure 4) we used gramicidin D (50 μg ml−1, Sigma) to establish access resistances between 30 – 40 MΩ. Extracellular solution contained 140 mM NaCl, 4.7 mM KCl, 2.5 mM CaCl2, 1.2 mM MgCl2, 10 mM HEPES, 11 mM glucose, pH 7.4 with NaOH. The recording pipette solution contained 140 mM KCl and 10 mM HEPES, ph 7.4 with NaOH and was filled with Lucifer yellow to verify that cells maintained the perforated patch configuration. D-2-amino-5-phosphovaleric acid (D-APV) (Ascent Scientific, Tocris) and CNQX (Tocris) were added to block NMDARs and AMPARs and tetrodotoxin (TTX) to block voltage-gated sodium channels. To obtain I–V plots, we voltage-clamped neurons from −30 to −90 mV in increments of 20 mV. In I = O mode (as previously described by Lee et. al 2011), GABA (10 μM) was applied through a patch pipette using a Pico Liter (Warner Instruments). Tumors were identified by their physical appearance and layer II/III peritumoral pyramidal cells were visualized using a Zeiss Axioscope 1D microscope, a 40 × water immersion lens. Data were acquired using an Axopatch 200B amplifier and pClamp 10 software and a Digidata 1440A interface (Molecular Devices), filtered at 5 kHz, digitized at 10–20 kHz, and analyzed using Clampfit 10.0 software (Molecular Devices).
Figure 4.

Depolarized GABA response and decreased KCC2 expression in tumor-bearing cortex. Sample recordings of membrane potential responses to 10 μM GABA from sham (A) and (B) tumor-bearing slices. (C) Scatter plot showing the mean EGABA values measured in identified layer II/III pyramidal cells from sham and tumor-bearing slices. The EGABA values for tumor-bearing slices were more depolarized compared to shams. (D) Summary of ECl values from neurons in sham and tumor-bearing slices. (E) Western blot showing a decrease in KCC2 expression in the peritumoral (PT) cortex compared to contralateral (C) cortex. (F) Quantification of KCC2 protein expression, c refers to control cortex in F and G. (G) Western blot of NKCC1 expression in peritumoral and contralateral cortex. (H) Quantification of NKCC1 showing no significant change in the peritumoral cortex.
Immunohistochemistry
Tumor-bearing and sham mice were perfused with 4% paraformaldehyde and free-floating vibratome sections (50 μm) were rinsed in PBS. Sections were processed for double immunofluorescence labeling for KCC2 and PV or KCC2 and NeuN. After antigen retrieval sections were blocked (10% goat serum and .3% Triton X in PBS) for 1 hr and incubated in a solution containing polyclonal rabbit anti-KCC2 (1:200; Millipore) and monoclonal mouse anti-PV (1.5:1000; 235 Swant) and appropriate secondary antibodies. Similar procedures were used to examine double labeling of NeuN and KCC2 with monoclonal mouse anti-NeuN (Millipore) and polyclonal rabbit anti-KCC2. Sections were rinsed in PBS and mounted with Vectashield (Vector Labs, Burlingame, CA). Images were obtained with a Zeiss LMS 510 Meta Confocal Microscope (Germany) with a 1.2 NA 63X oil objective. Semiquantitative analysis of KCC2 fluorescence intensity in PV- and NeuN-positive neurons was performed on randomly selected images in regions in layer II/III of the peritumoral cortex and similar regions in sham. Image analysis was performed with ImageJ v1.47u (National Institutes of Health) and Imaris software 7.0 (Bitplane, Switzerland).
Stereological quantification
Design-based stereology was used to quantify the total number of inhibitory neurons on parvalbumin-stained sections in the cortex of tumor and sham control mice. Sections were viewed with a Zeiss Axioplan (Germany) with a motorized stage, interface with a computer running StereoInvestigator 7.5 (MicroBrightfield, Williston, VT). The cortex was identified on slide-mounted sections. Estimated total were determined using the optical fractionator probe, and all sampling was done under 63X oil immersion objective. Layer 2/3 parvalbumin-stained neurons of both tumor and sham control mice were analyzed with a 1-in-5 series of sections, the counting frame was 50 x 50 μm, the counting grid was 150 x 150 μm, and dissector height was 30 μm. An average of 400 parvalbumin-positive neurons was counted per animal. For tumor sections parvalbumin-positive neurons were counted away from any migrating tumor cells, typically ~100 – 500 μm from the tumor edge.
Western Blotting
A 1 mm hole puncher was used to obtain tissue from sham-operated and GBM 22 animals and mechanically homogenized in RIPA buffer supplemented with phosphatase and protease inhibitor cocktails (Sigma). Homogenates were sonicated and centrifuged for 5 min at 12,000 x g at 4°C; the supernatant was used for Western blot analysis. Samples were boiled for 5 min after addition of 6x loading buffer (60% Glycerol, 300mM Tris pH 6.8, 12 mM EDTA, 12% SDS, 864 mM 2-mercaptoethanol, 0.05% Bromophenol Blue). SDS-polyacrylamide gels (precast, Bio-Rad) were run in SDS-PAGE running buffer at 100 V. Proteins were transferred to PVDF membrane (Millipore) by wet blotting at 200 mA for 2 h or 100 V for 1h. Membranes were blocked in blocking buffer consisting of 10% milk in Tris-buffered saline (TBST) and Tween 20, for 1 hr at room temperature (RT). Membranes were probed with primary antibody (goat anti-xCT (Abcam, 0.06 μg ml−1), mouse anti-CD98 (Abcam, 2 μg ml−1), anti-KCC2 transporter NeuroMab clone N1/12 (1:1000), anti-NKCC1 (NeuroMab clone N161/20, 1:1000) at 4 °C overnight. Membranes were washed in TBST and transferred into a solution containing horseradish peroxidase conjugated secondary antibodies (1 μg ml−1, Santa Cruz Biotechnology) for 60 min at RT. Enhanced chemiluminescence (Thermo-Fisher Scientific) was detected using an Eastman Kodak Image Station 4000 MM. For protein loading control, membranes were reprobed with an antibody against GAPDH (Abcam, 0.05 μg ml−1) for 45 min at RT.
Patient database data
Clinical data were acquired from the Repository for Molecular Brain Neoplasia Data (REMBRANDT) database on February 18, 2014. Kaplan-Meier survival data were queried following the REMBRANDT site’s instructions for ‘advanced search’. Survival data for the Kaplan-Meier analysis were retrieved for gliomas (GBM, astrocytoma and oligodendroglioma). Samples with a 2-fold downregulation of the target gene were designated as a decrease in KCC2 expression. A total of 413 glioma samples were evaluated.
Statistical analyses
P values for biophysical recordings using unpaired or paired two-tailed Student’s t test. For Kaplan-Meier survival analysis the log-rank test was performed. Statistics were generated with GraphPad InStat 3.06 (GraphPad Software Inc.) and significance was set at P < 0.05, and graphed using Origin 8.5 (Microcal Software). Error bars represent SEM.
RESULTS
A mouse model of peritumoral epilepsy
To study the cellular changes underlying tumor-associated epilepsy, we established a mouse model of the disease that exhibits spontaneous, recurring behavioral seizures (Buckingham, Campbell, Haas, Montana, Robel, Ogunrinu, and Sontheimer, 2011) (see Methods for details). Briefly, we screened implanted patient gliomas that were maintained in the flank of nude mice since their isolation (avoiding exposure to artificial growth conditions), for their ability to induce seizures after intracranial implantation. Implanted tumors induced variable expression of the system xc− (SXC) cystine-Glu exchanger (Fig. 1A). We have previously shown that SXC mediates Glu release from glioma cells and is highly associated with peritumoral hyperexcitability and seizures (Buckingham, Campbell, Haas, Montana, Robel, Ogunrinu, and Sontheimer, 2011). We chose to study the GBM22-implanted tumor animals which displayed a high expression of SXC and reliably displayed spontaneous seizures. Histologically, glioma cells implanted in the prefrontal cortex developed into large tumor masses by 10 – 14 d post implantation and showed highly-invasive streaks of tumor cells extending throughout the cortex (Fig. 1B). During a 2 – 5 d period of simultaneous video and intracranial electroencephalogram (EEG) recordings (see Movie 1), ~80% of mice implanted with these tumor cells, had seizures (Fig. 1C), which was never detected in vehicle–injected sham controls (referred to as shams hereafter) (Fig. 1D). The frequency of EEG seizure events was 1 ± 0.3 seizure per day, (n = 10 mice) with an average latency of 15 ± 0.6 days (n = 10 mice) to the appearance of the first seizure event and a mean duration of 26 ± 5 s (n = 10 mice). These mice therefore reproduce the salient features of the human disease and present a tractable model to study epilepsy resulting from intracranial implantation of human glioma cells.
Figure 1.
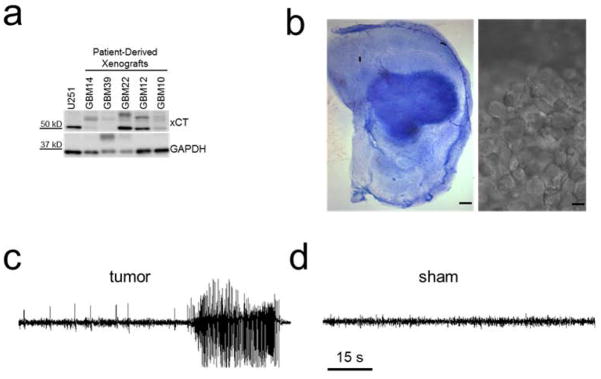
xCT expression in several patient-derived xenograph tissue samples and seizure activity from GBM22-implanted tumor animals (A). Patient tissue samples show tumors with either high or low xCT expression. (B) cresyl violet staining of a GBM22 tumor slice, showing a large tumor mass in the cortex. scale bar: 200 μm. (right) DIC image of a distinctive mass of GBM22 tumor cells in a cortical slice. Scale bar: 5 μm (C) EEG recordings from a sham and GBM22 tumor animal (D), showing a pronounced spontaneous seizure event lasting over 30 s.
Peritumoral cortex exhibits spontaneous epileptiform activity and is more susceptible to pharmacologically-induced epileptiform activity
We next investigated the occurrence of spontaneously occurring epileptiform events at the single cell level. We performed whole-cell patch-clamp recordings from layer II/III pyramidal neurons in the peritumoral cortex of tumor-bearing mice with confirmed seizure status, and compared them to recordings in sham animals at identical cortical locations. Recordings in the peritumoral cortex were conducted at least 100 μm from the tumor edge. In tumor-bearing slices, we observed spontaneously-occurring epileptiform events in 4 of 12 (33%) neurons (Fig. 2A,C). No such activity was seen in any (8 of 8) of the tested sham neurons (Fig. 2A,C). We then tested if peritumoral neurons displayed enhanced sensitivity to GABAA-disinhibition. When the GABAAR antagonist bicuculline (Bic; 10 μM) was applied to tumor-associated slices that lacked spontaneously occurring epileptiform activity, epileptiform discharges developed with a short latency after drug application (3 ± 0.5 min, n = 8 cells, 5 mice, Fig. 2B,D) in all cells. In contrast, Bic-induced epileptiform activity in neurons from sham slices occurred with a significantly longer latency (6.9 ± 0.75 min, n = 8 cells, 4 mice, unpaired t test; P = 0.001) (Fig. 2B,D). Consistently, we also examined the sensitivity of peritumoral neurons to Mg2+-free-induced epileptiform activity and found that peritumoral neurons displayed a shorter latency to epileptiform activity compared to shams (sham: 15.7 ± 1.8 min, n = 7 cells (7 slices), n = 4 mice, vs. tumor: 8.1 ± 1.6 min, n = 6 cells (6 slices), n = 3 mice, unpaired t test, P = 0.01; data not shown). These data suggest peritumoral neurons have a higher propensity for hyperexcitability, with some even displaying spontaneous epileptic discharge.
Reduced number of GABAergic neurons in peritumoral cortex
The excessive release of Glu from gliomas has been shown to cause extensive excitotoxicity (Chung, Lyons, Nelson, Hamza, Gladson, Gillespie, and Sontheimer, 2005; Takano, Lin, Arcuino, Gao, Yang, and Nedergaard, 2001). We hypothesized that tumor-released Glu might cause excitotoxic death of peritumoral neurons. We were specifically interested in the excitotoxicity of GABAergic interneurons as their death would thereby dampen inhibitory synaptic transmission. To test this possibility, we labeled brain slices from tumor and sham slices with antibodies specifically targeting parvalbumin (PV), a Ca2+-binding protein highly-expressed in a subset of GABAergic interneurons (Van Brederode, Mulligan, and Hendrickson, 1990), and compared the number of PV-positive cells as shown in Fig. 3A. The results show a significant decrease in the number of PV-positive interneurons in peritumoral brain (sham: 8752 ± 705, 3 mice, 5 sections/animal vs. tumor: 4025 ± 276; 3 mice, 5 sections/animal; unpaired t test; P = 0.003, Fig. 3B).
Altered GABA inhibitory synaptic transmission in the peritumoral cortex
To determine if the observed peritumoral decrease in PV-positive interneurons alters inhibitory synaptic transmission, we recorded action potential-dependent, spontaneous inhibitory synaptic transmission (sIPSCs) from layer II/III pyramidal cells from tumor and sham mice (Fig. 3C). We found a significant decrement in the frequency of sIPSCs in peritumoral (8.6 ± 3.1 Hz, n = 18 cells, 8 mice) compared to sham neurons (14.1 ± 1.7 Hz, n = 19 cells, 10 mice, unpaired t test; P = 0.01; Fig 3C,D). The mean amplitude of sIPSCs in slices from tumor mice (27.6 ± 1.7 pA, n = 18 cells 8 mice) was also significantly reduced compared to sham mice (37.6 ± 4.4 pA, n = 19 cells, 10 mice, unpaired t test, P = 0.03; Fig. 3E). There were no significant differences in the rise (tumor, 2.2 ± 0.15 ms vs. sham, 2.16 ± 0.14 ms; unpaired t test; P = 0.6) and decay-time constant (tumor: 7.2 ± 0.66 ms vs. sham: 6.8 ± 0.45 ms; unpaired t test; P = 0.6) of sIPSCs between tumor and control mice.
We also recorded action potential-independent miniature inhibitory postsynaptic currents (mIPSCs) from tumor-associated cortex and sham mice. There was a decrease in the frequency (tumor: 8.7 ± 1.2 Hz, n = 11 cells, 5 mice vs. sham: 10.1 ± 1.7 Hz, n = 24 cells, 8 mice, unpaired t test; P = 0.04; Fig. 3F,G) and amplitude (sham: 26.4 ± 1.7 pA vs tumor: 20.7 ± 1.1 pA; unpaired t test; P = 0.002, Fig. 3H) of mIPSCs in peritumoral neurons compared to shams. There was no change in the rise (sham: 1.8 ± 0.15 ms vs. tumor: 1.5 ± 0.27 ms: unpaired t test; P = 0.09) and decay time (sham: 7.15 ± 0.63 ms vs tumor: 4.8 ± 1.2 ms; unpaired t-test, P = 0.4) between sham and peritumoral neurons. These results suggest reduced inhibitory tone of tumor-associated GABAergic inhibition.
Evoked IPSCs (eIPSCs) in the cortex primarily cause inhibition that controls synaptic input and integration in pyramidal cells (Gilbert, 1993; Wang, Gupta, Toledo-Rodriguez, Wu, and Markram, 2002). To further determine the functional implications of the observed loss of GABAergic interneurons in tumor-associated cortex, we examined the threshold for evoking monosynaptic eIPSCs using increasing stimulation intensities. The resting membrane potential was lower in peritumoral neurons but not significantly different (−58 ± 1 mV, n = 37 cells, 16 mice) compared to sham (−60 ± 5 mV, n = 27, 9 mice; unpaired t-test; P = 0.2), and there was no change in the input resistance (sham, 167 ± 11 mΩ, n = 27 cells 9 mice) vs. tumor 175 ± 8 mΩ, n = 37 cells,16 mice); unpaired t-test; P = 0.6). Evoked IPSCs were recorded in layer 2/3 pyramidal cells by stimulating cortical layer V at the same location in sham and tumor slices. The stimulus intensity required to evoke IPSCs at a threshold with pulse width set at 50 μs was higher in neurons from tumor-bearing slices (0.21 mA ± 0.03, n = 12 cells, 5 mice) than in shams (0.12 mA ± 0.02, n = 12, 5 mice; unpaired t-test, P = 0.02, Fig. 3I). In addition, the stimulus response curves constructed of eIPSC amplitudes plotted against the stimulation intensity from sham revealed peak amplitudes significantly larger than those in tumor-bearing slices at four stimulating intensities (unpaired t test conducted for individual intensities: T1, P = 0.12, T1.5, P = 0.03; T2, P = 0.12; T2.5, P = 0.04; T3, P = 0.004; T3.5. P = 0.004, Fig. 3J). Application of Bic blocked these responses demonstrating that the IPSCs were mediated by GABAARs (data not shown). Together, these data suggest a reduction of GABAergic inhibition in peritumoral neurons.
Depolarizing peritumoral GABA response
While GABA is typically an inhibitory neurotransmitter that causes membrane hyperpolarization, depolarizing (and even excitatory) GABA responses have been reported early in development (Cherubini, Gaiarsa, and Ben-Ari, 1991) and in certain neurological conditions such as temporal lobe epilepsy, spasticity, and neuropathic pain (Kahle, Staley, Nahed, Gamba, Hebert, Lifton, and Mount, 2008). To examine if a change in the GABA response may contribute to the observed alteration in peritumoral inhibition, we used gramicidin perforated-patch recordings, which leave the intracellular chloride concentration intact (Ritz and Hausmann, 2008) while measuring voltage responses. We next compared the voltage response of sham and peritumoral neurons to a puff of 10 μM of GABA (6 s) while blocking voltage-gated sodium (TTX), AMPA (CNQX) and NMDA (APV) currents. GABA application elicited a hyperpolarization in 73% of sham neurons (14/19) (Fig. 4A), a number similar to previous reports (Lee, Deeb, Walker, Davies, and Moss, 2011a). By comparison, 65% of peritumoral neurons elicited depolarizing responses to GABA (22/34) (Fig. 4B). In each instance, GABA responses were blocked by bicuculline, assuring that they were indeed mediated by GABAARs (data not shown). Importantly, the depolarizing GABA responses were observed over a considerable voltage range, including some neurons that rested at ~−55 mV.
We next determined the GABA reversal (or equilibrium) potential (EGABA) by eliciting GABA responses in voltage-clamp from different holding potentials and plotting the relative current as a function of voltage, the intercept of which yields the reversal potential. This value differed for sham and peritumoral neurons. In sham neurons EGABA was −72.4 ± 1.2 mV (n = 17 cells, 12 mice), whereas, in peritumoral neurons EGABA was significantly more positive, at −60.5 ± 2.1 mV (n = 21 cells,15 mice; unpaired t-test, P = 0.0001, (Fig. 4C). Since GABAARs are primarily permeable to Cl−, the difference in EGABA suggests a different [Cl−]i. The experimentally-determined EGABA was used to calculate [Cl−]i, yielding values of 10.2 ± 0.4 mM (sham) and 15.5 ± 1.5 mM (tumor) (unpaired t-test, P = 0.004, (Fig. 4D). Changes in [Cl−]i of this magnitude have been previously shown to be sufficient to reverse GABAergic responses from inhibitory to excitatory (Staley and Smith, 2001).
KCC2 functional expression is altered in peritumoral slices
The [Cl−]i of neurons is principally determined by the activities of the Na+-K+-2Cl− cotransporter NKCC1, which imports Cl−, and the K+-Cl− cotransporter KCC2 (Ben-Ari, 2002), which exports Cl−. While in mature neurons both transporters are expressed, immature neurons lack KCC2 expression until postnatal day 15 (Rivera, Voipio, Payne, Ruusuvuori, Lahtinen, Lamsa, Pirvola, Saarma, and Kaila, 1999). As a result, in immature neurons NKCC1 activity is unopposed and mediates accumulation of Cl− to around 25–30 mM (Staley and Smith, 2001), yielding a Cl− equilibrium potential of about −40 mV. This leads to Cl− efflux through activated GABAARs, thereby depolarizing neurons, and may explain why early in development GABA can function as an excitatory neurotransmitter. With increasing KCC2 expression during development, Cl− efflux results in a significantly decreased [Cl−]i and GABA evokes more hyperpolarized currents.
We speculated that the observed increases in [Cl−]i in peritumoral neurons may be due in part to altered functional expression of KCC2. As shown for representative tumor tissue samples, KCC2 protein expression was decreased in peritumoral cortex compared to contralateral regions (Fig. 4E). Quantification of Western blot showed a significant decrease in peritumoral protein expression of KCC2 (unpaired t test; P = 0.03, n = 5 mice, Fig. 4F). We also assessed the expression of NKCC1 and although there was a trend towards an increase in the expression in the peritumoral cortex it was not significant (Fig. 4G,H). To determine the cellular distribution of KCC2 in peritumoral neurons, we performed immunohistochemistry on tissue sections and examined the plasmalemmal surface expression of KCC2 in parvalbumin-expressing interneurons as well as the expression of all neurons using a NeuN marker. As shown for representative slices in Fig. 5, the cellular localization of KCC2 on peritumoral PV-positive (Fig. 5A–D) and NeuN-positive neurons (Fig. 5I–L) was strikingly different to that observed in sham sections. In sections from tumor-bearing slices, there was a significant decrease in KCC2 expression in neurons adjacent to the tumor mass (Fig. 5A–D). Quantification of KCC2 fluorescence intensity on PV-positive (Fig. 5E) and NeuN-positive neurons (Fig. 5M) revealed a significant decrease in peritumoral cell membrane expression of both PV-positive (sham: n = 52 cells, 5 mice vs. tumor: 32 cells, 3 mice, unpaired t-test; P = 0.001) and NeuN-positive neurons (sham: 24 cells, 5 mice vs. tumor: n = 26 cells, 3 mice, unpaired t-test; P = 0.001) compared to shams.
Figure 5.

Alteration in KCC2 expression in PV- and NeuN-positive peritumoral cells. (A,B) Confocal images from sham slices labeled for KCC2 (green), PV (red) and merged images (right). Merged images show colocalization of KCC2 on PV-positive cells at the periphery of the soma from a sham slice. (C,D) same as A and B, but in a tumor-bearing slice showing a decrease in the expression of KCC2 on the periphery of cell body. (I and J) Confocal images from sham slices labeled for KCC2 (green), NeuN (red). Merged image show colocalization of KCC2 on NeuN-positive cells at the periphery of the soma from a sham slice. (E, M) Summary data of the relative fluorescent intensity of KCC2 staining in the soma of PV-positive and NeuN-positive cells from sham and tumor-bearing animals, respectively. (G, O) Percent of the cell volume colocalization of PV and KCC2 (G) and NeuN and KCC2 (O) in tumor-bearing and sham slices. Line scanning across cell soma of a PV- positive cell showing KCC2 expression in a sham (F) and a peritumoral cell (H). Line scan of the relative fluorescence intensity of NeuN and KCC2 expression across a sham (N) and peritumoral neuron (P). The yellow line indicates the scanned line. Scale bars: 20 μm (A, C, I, and K) and 5 μm (B, D, J and L). The yellow line indicates the scanned line.
To further quantify this difference we performed confocal line scans to measure the relative fluorescence intensity across the soma of each neuron in sham and tumor sections. The line scan revealed a consistent steep peak in KCC2 expression at the outer edge of the cytoplasm of PV- (Fig. 5B,F) and NeuN-positive cells (Fig. 5J,N) in sham sections. However, the relative fluorescence intensity of KCC2 varied in tumor-bearing sections, showing a decrease in the relative fluorescence intensity at the outer edge of the cell body, as shown in the example in Fig. 5D,H of a PV-positive cell. In other peritumoral cells there was an increase in KCC2 expression within the cell body, as shown in Fig. 5L,P of a NeuN-positive cell. We also investigated the colocalization of KCC2 with PV-positive cells in sham and tumor sections. Analysis of the volume of colocalization of KCC2 on the cell body of PV-positive cell showed a higher colocalization in sham (29 ± 3.5%, n = 23 cells, 3 mice) compared to cells along the tumor border (14 ± 3.3%, n = 25 cells, 3 mice; unpaired t test; P = 0.006, Fig. 5G). On peritumoral NeuN-positive cells, there was no significant difference in the volume of colocalization (44 ± 5%, n = 25 cells, 3 mice) in the cell body compared to shams (50 ± 4%; unpaired t-test; P = 0.3, Fig. 5O); however, the distribution of KCC2 was clearly altered compared to sham (Fig. 5I–L). This data suggests that a decrease and alteration in KCC2 functional expression contributes to the increase in [Cl−]i that is associated with depolarizing GABA responses in peritumoral neurons.
Tumor-associated SXC-mediated Glu release does not correlate with peritumoral GABA responses
It has recently been demonstrated that GABA responses in hippocampal neurons can be converted from hyperpolarizing to depolarizing following a 2 min exposure of these neurons to 20 μM Glu (Lee, Deeb, Walker, Davies, and Moss, 2011a). This sustained activation of neuronal NMDA-R causes an influx of Ca2+ and activation of protein phosphatase-1, which dephosphorylates KCC2 on serine S940 causing a decrease in KCC2 membrane expression and an increase intracellular [Cl−]. In light of the reported release of Glu from tumor reaching over 100 μM in patients (Marcus, Carpenter, Price, and Hutchinson, 2010), this Glu release may be responsible for a conversion of peritumoral GABA responses from inhibitory to excitatory by the above mechanism. To question this, we took advantage of the discovery that some of the patient derived gliomas, such as the GBM14, lack SXC expression (Fig. 1) which is responsible for peritumoral Glu release. EEG recordings from the GBM14 animals show that these animals do not display the long-lasting EEG seizure events which were observed in the high SXC-expressing GBM22 (shown in Fig. 1B). Instead 2 of 12 GBM14 animals display interictal spiking (Fig. 6A) while 10 of 12 displayed no abnormal EEG events. The frequency of EEG events was 0.1 ± 0.1 event per day and the latency to the first event was 28 ± 2 days (n = 12). Interestingly, when we performed perforated patch-clamp recordings from peritumoral GBM14 neurons, 57% also present with depolarizing GABA responses (Fig. 6B). The percent of GBM14 peritumoral neurons that displayed depolarizing GABA responses was comparable to the GBM22 tumor animals in which 65% of the cells had depolarized GABA responses. However there was a significant difference in the EGABA values where the GBM14, had a hyperpolarized EGABA of −72 ± 2 mV (n = 10 cells, 6 mice) compared to the GBM22, which have a high expression of SXC, displayed a more depolarized EGABA −60.5 ± 2.1 mV (n = 21 cells, 15 mice, unpaired t test; P = 0.002). Hence, unlike in cultured hippocampal neurons, tumor-released Glu in vivo does not explain our observed reductions in KCC2 functional expression.
Figure 6.

Low SXC expressing GBM14-implanted tumors present with depolarized GABA responses and hyperpolarized EGABA. (A) Sample EEG recording from a GBM14 tumor-implanted mouse, which have a low expression of SXC, showing interictal spikes. These tumor-bearing animals do not display long-lasting seizure events. (B) Scatter plot of EGABA values measured in peritumoral neurons from GBM14-implanted animals. (C) Sample recording of sPSCs from a GBM22 peritumoral neuron showing epileptiform events in the presence of Bic (10 μM). Application of SAS (250 μM) blocked the epileptiform events after 25 mins. (D) Summary of the frequency and duration (E) of epileptiform events in the presence of Bic and following SAS application.
Our hypothesis is that both impaired GABAergic inhibition in peritumoral regions and SXC expression in tumor cells are needed for the development of epileptogenesis. Therefore we investigated if blocking SXC in the presence of Bic, to fully block GABAergic transmission, would decrease epileptiform activity in the GBM22 tumor animals, which have high expression of SXC. We recorded sPSCs in ACSF for 5 mins then applied Bic for 10 min to first establish epileptiform events. In 3 of 7 cells spontaneous epileptiform activity was observed in ACSF before Bic was applied. After establishing epileptiform activity in each cell, 250 μM sulfasalazine (SAS) was co-applied to block SXC (Fig. 6C). SAS decreased the frequency (Bic: 29 ± 2.5 events vs. 12 ± 3 events, n = 7 cells, n = 3 mice; paired t test, P = 0.005, Fig. 6D) and duration (Bic: 2.3 ± 0.2 sec vs. SAS 0.7 ± .1 sec, n = 7 cells, n = 3 mice; paired t test, P = 0.002, Fig. 6E) of epileptiform events in all cells after 10 min application and completely blocked epileptiform events in 3 of 7 cells after 20 min application. Taken together, the results obtained from the GBM14 and GBM22 tumor implanted mice indicate the necessity for enhanced glutamate release for epileptiform activity, and further suggests that alteration in GABAergic inhibition and enhanced expression of SXC contribute to tumor-associated epilepsy in our animal models.
KCC2 expression in glioma patients
Based on our in vitro data (Figs. 3–4) demonstrating changes in KCC2 expression in peritumoral cortex, we hypothesized that a decrease in KCC2 expression would also correlate with a worse prognosis in glioma patients by increasing morbidity from seizure-related complications (Omuro and DeAngelis, 2013). To test this theory, we took advantage of publicly-available patient data in the NCI Repository for Molecular Brain Neoplasia Data (REMBRANDT) database (, 2005). Using microarray-based gene expression data and associated clinical reports, we generated a Kaplan-Meier survival curve based on KCC2 expression among 413 glioma patients (GBM, astrocytoma and oligodendroglioma) (Fig. 7). As is commonly used (Gramatzki, Herrmann, Happold, Becker, Gulbins, Weller, and Tabatabai, 2013), down-regulation was defined as a 2-fold decrease in KCC2 expression, compared to no change in expression in the given data set. Based on these criteria, KCC2 was down-regulated in 297 patients, and unchanged in the remaining 116 patients. The graph shows a statistically-significant decrease in survival for patients with decreased KCC2 expression (log-rank test; P = 1.0 x 10⁻⁵). The finding from this human data set suggests a strong correlation between decrease in KCC2 functional expression and early death. Taken together, the decrease in KCC2 expression and the associated alteration in GABAergic function contributes to peritumoral excitability and seizures, which are known to impact patient outcome (Omuro and DeAngelis, 2013), (Smits, Jin, Elsir, Pedder, Nister, Alafuzoff, Dimberg, Edqvist, Ponten, Aronica, and Birnir, 2012).
Figure 7.

Decreasing KCC2 expression in glioma correlates with reduced patient survival. The Rembrandt database was used to perform a Kaplan-Meier survival analysis of glioma patients with decrease KCC2 expression. Down-regulation was defined as a 2-fold or greater deviation from intermediate expression. Among glioma patients (n = 413) there was a significant difference in survival between patients with decreased KCC2 gene expression (n = 297) compared to patients with no change in KCC2 expression (n = 116) (log-rank test; P = 1.0e-5).
DISCUSSION
Using patient-derived tumor cells, we were able to establish a mouse glioma peritumoral epilepsy model that recapitulated human tumor growth characteristics, histology, and the behavioral and electrographic seizures that occur frequently in glioma patients. Brain slices from animals with confirmed seizures showed two distinct changes that likely contribute to peritumoral neuronal hyperexcitability. First, the peritumoral cortex contained fewer PV-positive GABAergic interneurons, leading to decreased GABAergic IPSCs and less inhibition. Secondly, we found elevated [Cl−]i leading to depolarizing GABA responses and reduced inhibition in peritumoral neurons. The latter was accompanied by a decrease in the plasmalemmal functional expression of KCC2. The concurrence of these two changes results in a synergistic decrease in peritumoral GABAergic inhibition creating a highly seizure-prone peritumoral brain.
While replicating a complex disease in an animal model has inherent limitations, use of patient xenografts propagated in the flank of nude mice closely mimics the human disease. As shown before (Giannini, Sarkaria, Saito, Uhm, Galanis, Carlson, Schroeder, and James, 2005), gene expression in these tumors is very stable, and we show that the SXC transporter, responsible for tumor-derived Glu release, does not change in expression or function when passaged through 17 generations (data not shown) of nude mice. Importantly, these animals reliably developed bona fide spontaneous recurrent tonic-clonic seizures, and not just EEG abnormalities reported after implantation of glioma cell lines maintained in culture (Buckingham, Campbell, Haas, Montana, Robel, Ogunrinu, and Sontheimer, 2011).
Epilepsy is common in patients with gliomas (and other brain tumors) and the pathophysiological changes underlying peritumoral seizures are likely multifactorial (de, Reijneveld, Aronica, and Heimans, 2012). We previously demonstrated that cortical hyperexcitability develops in the peritumoral cortex (Buckingham, Campbell, Haas, Montana, Robel, Ogunrinu, and Sontheimer, 2011; Campbell, Buckingham, and Sontheimer, 2012), and tumor-derived Glu release was proposed to be an important determinant. The present study suggests another major contributing factor is the loss of PV-positive GABAergic interneurons, and a change in the inhibitory nature of GABA in peritumoral neurons, which together shift the excitation-inhibition balance towards hyperexcitability. Several subtypes of GABAergic interneurons, including the PV-positive basket and chandelier cells, innervate the soma and the axonal initial segment of pyramidal cells, thereby eliciting a powerful inhibitory control on the output of pyramidal cells (Gilbert, 1993; Wang, Gupta, Toledo-Rodriguez, Wu, and Markram, 2002). Alteration in the number and/or distribution of these interneurons has been reported in patients with temporal lobe epilepsy (TLE) (Andrioli, Alonso-Nanclares, Arellano, and DeFelipe, 2007). Additionally, mice deficient in PV have reduced threshold of drug-induced seizures and greater seizure severity (Schwaller, Tetko, Tandon, Silveira, Vreugdenhil, Henzi, Potier, Celio, and Villa, 2004). In light of these studies, any loss of PV-positive GABAergic interneurons, as observed here, could significantly contribute to the etiology of peritumoral epilepsy, as reported for TLE (Drexel, Preidt, Kirchmair, and Sperk, 2011; Knopp, Frahm, Fidzinski, Witte, and Behr, 2008). One obvious candidate mechanism leading to a reduced number of peritumoral PV-positive cells is excitotoxic cell death due to Glu released from the tumor mass; indeed, we (Chung, Lyons, Nelson, Hamza, Gladson, Gillespie, and Sontheimer, 2005) and others (Savaskan, Heckel, Hahnen, Engelhorn, Doerfler, Ganslandt, Nimsky, Buchfelder, and Eyupoglu, 2008) have shown that Glu is released from gliomas via SXC and can cause neurotoxicity (Chung, Lyons, Nelson, Hamza, Gladson, Gillespie, and Sontheimer, 2005).
In addition to the loss of GABAergic interneurons, we found a change in the activity of GABA in a significant percentage of the surviving interneurons. The typical (hyperpolarizing) inhibitory response to GABA is conferred by a low intracellular [Cl−] established by the KCC2 cotransporter, which mediates Cl− efflux in mature CNS neurons. Early in embryonic and post-natal development, however, KCC2 expression is either low or absent, and NKCC1 mediated Cl− import accumulates Cl− to ~ 25–30 mM (Staley and Smith, 2001). Under these conditions, GABAARs efflux Cl−, causing depolarizing GABA responses. This developmental shift in the GABA response is now well established (Ben-Ari, 2002) and believed to aid in the development of the nervous system. Over-expression of human KCC2 in immature cortical neurons produces a substantial negative shift in EGABA, consistent with the concept that KCC2 expression is necessary and sufficient to confer GABA hyperpolarizing responses later in development (Lee, Chen, Liu, Aizenman, and Kandler, 2005). When challenged, GABAergic inhibition can turn into a depolarizing driving force involved in seizure initiation (Kohling, Vreugdenhil, Bracci, and Jefferys, 2000). Indeed, while KCC2 expression prevents the development of hyperexcitability (Zhu, Polley, Mathews, and Delpire, 2008), KCC2 knockout or deficiency results in an increased susceptibility to seizures or unprovoked epilepsy in worms, flies, and/or mice (Ben-Ari, Khalilov, Kahle, and Cherubini, 2012; Zhu, Polley, Mathews, and Delpire, 2008).
Interestingly, neonatal febrile seizures have been attributed to a decrease in KCC2 function, converting GABA to an excitatory neurotransmitter. Hence, it is plausible that a similar phenotypic switch may contribute to tumor-associated epilepsy. Indeed, we show that peritumoral neurons exhibit depolarizing GABAergic responses as a result of altered Cl− homeostasis, which is accompanied by impaired KCC2 functional expression. Depolarized EGABA values have also been reported in oocytes injected with membranes derived from human peritumoral cortices (Conti, Palma, Roseti, Lauro, Cipriani, de, Aronica, and Limatola, 2011) and human hippocampal subiculi. Depolarizing GABA responses were observed in slices of human cortical tissue from epilepsy patients (Deisz, 2002), and were also shown to contribute to interictal activity in human temporal lobe epilepsy (Cohen, Navarro, Clemenceau, Baulac, and Miles, 2002).
How KCC2 function becomes altered in glioma remains to be resolved. The KCC2 transporter harbors several phosphorylation sites that regulate the intrinsic rate of ion transport and/or plasmalemmal expression (Kahle, Rinehart, and Lifton, 2010). Interestingly, cell volume changes and changes in extracellular osmotic stimuli stimulate the inhibitory phosphorylation of KCC2 at Thr906 and Thr1007 in a WNK serine-threonine kinase (With No lysine=K kinases)-dependent mechanism (Kahle, Rinehart, and Lifton, 2010). Gliomas highly-express WNKs (Haas, Cuddapah, Watkins, Rohn, Dy, and Sontheimer, 2011), especially WNK3, and are also commonly accompanied by significant peritumoral edema (Savaskan, Heckel, Hahnen, Engelhorn, Doerfler, Ganslandt, Nimsky, Buchfelder, and Eyupoglu, 2008). Another regulatory site in the KCC2 C-terminus, Ser940, has been implicated in Glu-mediated inactivation of KCC2 via dephosphorylation by Ca2+-dependent protein phosphatase 1 (Lee, Deeb, Walker, Davies, and Moss, 2011b). The latter, however, seems unlikely in the context of gliomas, because implantation of gliomas that lack Glu release via SXC showed similar changes in GABA responses. These pathways are among the mechanistic possibilities accounting for the peritumoral decrease in KCC2 functional expression and will be an important topic of detailed future biochemical analysis using this model.
Taken together, we suggest that a loss of PV-positive GABAergic interneurons, along with the change of GABA effect from inhibitory to excitatory in surviving peritumoral neurons, establishes a hyper-excitable peritumoral brain prone to seizures when an excitatory stimulus is present. That the tumor may directly provide this excitatory stimulus in the form of Glu has been well established in mouse rodent glioma models (Takano, Lin, Arcuino, Gao, Yang, and Nedergaard, 2001; Buckingham, Campbell, Haas, Montana, Robel, Ogunrinu, and Sontheimer, 2011) and in the human disease (Marcus, Carpenter, Price, and Hutchinson, 2010). The tumor-released Glu has pleotropic roles: autocrine and paracrine growth factor signaling, regulation of focal adhesion sites, promotion of cell invasion, and promotion of excitotoxicity, clearing space for tumor expansion (de Groot and Sontheimer, 2010). Sustained Glu release, however, would be insufficient to explain the spontaneous and sporadic recurrence of seizures in tumor-associated epilepsy. Our findings that gliomas alter GABAergic inhibition, thereby enhancing seizure susceptibility now reconcile these prior findings. We suggest that increases in peritumoral Glu are necessary but not sufficient for tumor-associated epilepsy. Over time, the tumor establishes a peritumoral neuronal environment that is intrinsically hyperexcitable but only if an excitatory stimulus is presented, will seizures occur. This work validates the critical role of GABA-mediated inhibition in controlling neuronal excitability. Moreover, this study provides a potential novel perspective on the development of tumor-associated hyperexcitability and suggests new therapeutic targets for controlling peritumoral hyperexcitability.
Supplementary Material
Acknowledgments
Grant support: NIH-2R01-NS052634, 5R01-NS036692, & 5T32NS048039-03.
The authors would like to thank A. Margolies for help with histology; K. Turner for technical assistance with PV fluorescent staining. C. Langford for orthotopic xenografts; GBM14 and 22 tumors were obtained from J. Sarkaria (Mayo Clinic, Rochester, MN) and provided by the University of Alabama at Birmingham Brain Tumor Animal Models Core (UAB SPORE P50-CA097247).
Footnotes
The authors declare no competing conflicts of interest.
AUTHOR CONTRIBUTIONS
S.L.C. conceived experimental design, acquired the electrophysiology and immunofluourescent data and co-wrote manuscript. S.R. performed western blots, conducted animal surgeries and edited the manuscript, V.C. was instrumental in experimental design, conducted spontaneous data analysis and editing manuscript, S.R. performed western blots, collected and maintained patient GBM tissue samples and analyzed data from the Rembrandt database, S.B. conducted EEG recordings and surgeries. K.T.K. contributed ideas and edited manuscript. H.S. supervised all research and co-wrote the manuscript.
Reference List
- 1.National Cancer Institute. [Accessed October 14 2013];REMBRANDT home page. 2005 http://rembrandt.nci.nih.gov. REMBRANDT.
- 2.Andrioli A, Alonso-Nanclares L, Arellano JI, DeFelipe J. Quantitative analysis of parvalbumin-immunoreactive cells in the human epileptic hippocampus. Neurosci. 2007;149:131–143. doi: 10.1016/j.neuroscience.2007.07.029. [DOI] [PubMed] [Google Scholar]
- 3.Barmashenko G, Hefft S, Aertsen A, Kirschstein T, Kohling R. Positive shifts of the GABAA receptor reversal potential due to altered chloride homeostasis is widespread after status epilepticus. Epilepsia. 2011;52:1570–1578. doi: 10.1111/j.1528-1167.2011.03247.x. [DOI] [PubMed] [Google Scholar]
- 4.Ben-Ari Y. Excitatory actions of gaba during development: the nature of the nurture. Nat Rev Neurosci. 2002;3:728–739. doi: 10.1038/nrn920. [DOI] [PubMed] [Google Scholar]
- 5.Ben-Ari Y, Gairsa JL, Tyzio R, Khazipov R. GABA: A pioneer transmitter that excites immature neurons and generates primitive oscillations. Physiol Rev. 2007;87:1215–84. doi: 10.1152/physrev.00017.2006. [DOI] [PubMed] [Google Scholar]
- 6.Ben-Ari Y, Khalilov I, Kahle KT, Cherubini E. The GABA excitatory/inhibitory shift in brain maturation and neurological disorders. Neuroscientist. 2012;18:467–486. doi: 10.1177/1073858412438697. [DOI] [PubMed] [Google Scholar]
- 7.Buckingham SC, Campbell SL, Haas BR, Montana V, Robel S, Ogunrinu T, Sontheimer H. Glutamate release by primary brain tumors induces epileptic activity. Nat Med. 2011;17:1269–1274. doi: 10.1038/nm.2453. [DOI] [PMC free article] [PubMed] [Google Scholar]
- 8.Campbell SL, Buckingham SC, Sontheimer H. Human glioma cells induce hyperexcitability in cortical networks. Epilepsia: 2012. [DOI] [PMC free article] [PubMed] [Google Scholar]
- 9.Chang EF, Potts MB, Keles GE, Lamborn KR, Chang SM, Barbaro NM, Berger MS. Seizure characteristics and control following resection in 332 patients with low-grade gliomas. J Neurosurg. 2008;108:227–235. doi: 10.3171/JNS/2008/108/2/0227. [DOI] [PubMed] [Google Scholar]
- 10.Cherubini E, Gaiarsa JL, Ben-Ari Y. Gaba: An excitatory inhibitor in early postnatal life. Trends in Neuroscience. 1991;14(12):515–519. doi: 10.1016/0166-2236(91)90003-d. [DOI] [PubMed] [Google Scholar]
- 11.Chung WJ, Lyons SA, Nelson GM, Hamza H, Gladson CL, Gillespie GY, Sontheimer H. Inhibition of cystine uptake disrupts the growth of primary brain tumors. J Neurosci. 2005;25:7101–7110. doi: 10.1523/JNEUROSCI.5258-04.2005. [DOI] [PMC free article] [PubMed] [Google Scholar]
- 12.Cohen I, Navarro V, Clemenceau S, Baulac M, Miles R. On the origin of interictal activity in human temporal lobe epilepsy in vitro. Science. 2002;298:1418–1421. doi: 10.1126/science.1076510. [DOI] [PubMed] [Google Scholar]
- 13.Conti L, Palma E, Roseti C, Lauro C, Cipriani R, de GM, Aronica E, Limatola C. Anomalous levels of Cl− transporters cause a decrease of GABAergic inhibition in human peritumoral epileptic cortex. Epilepsia. 2011;52:1635–1644. doi: 10.1111/j.1528-1167.2011.03111.x. [DOI] [PubMed] [Google Scholar]
- 14.Danbolt NC. Glutamate uptake. Prog Neurobiol. 2001;65:1–105. doi: 10.1016/s0301-0082(00)00067-8. [DOI] [PubMed] [Google Scholar]
- 15.de Groot J, Sontheimer H. Glutamate and the biology of gliomas. Glia. 2010;59:1181–1189. doi: 10.1002/glia.21113. [DOI] [PMC free article] [PubMed] [Google Scholar]
- 16.de Groot M, Reijneveld JC, Aronica E, Heimans JJ. Epilepsy in patients with a brain tumour: focal epilepsy requires focused treatment. Brain. 2012;135:1002–1016. doi: 10.1093/brain/awr310. [DOI] [PubMed] [Google Scholar]
- 17.Deisz RA. Cellular mechanisms of pharmacoresistance in slices from epilepsy surgery. Novartis Found Symp. 2002;243:186–199. doi: 10.1002/0470846356.ch14. [DOI] [PubMed] [Google Scholar]
- 18.Drexel M, Preidt AP, Kirchmair E, Sperk G. Parvalbumin interneurons and calretinin fibers arising from the thalamic nucleus reuniens degenerate in the subiculum after kainic acid-induced seizures. Neurosci. 2011;189:316–329. doi: 10.1016/j.neuroscience.2011.05.021. [DOI] [PMC free article] [PubMed] [Google Scholar]
- 19.Giannini C, Sarkaria JN, Saito A, Uhm JH, Galanis E, Carlson BL, Schroeder MA, James CD. Patient tumor EGFR and PDGFRA gene amplifications retained in an invasive intracranial xenograft model of glioblastoma multiforme. Neuro-oncol. 2005;7:164–176. doi: 10.1215/S1152851704000821. [DOI] [PMC free article] [PubMed] [Google Scholar]
- 20.Gilbert CD. Circuitry, architecture, and functional dynamics of visual cortex. Cereb Cortex. 1993;3:373–386. doi: 10.1093/cercor/3.5.373. [DOI] [PubMed] [Google Scholar]
- 21.Gramatzki D, Herrmann C, Happold C, Becker KA, Gulbins E, Weller M, Tabatabai G. Glioma cell death induced by irradiation or alkylating agent chemotherapy is independent of the intrinsic ceramide pathway. PLoS One. 2013;8:e63527. doi: 10.1371/journal.pone.0063527. [DOI] [PMC free article] [PubMed] [Google Scholar]
- 22.Haas BR, Cuddapah VA, Watkins S, Rohn KJ, Dy TE, Sontheimer H. With-No-Lysine Kinase 3 (WNK3) stimulates glioma invasion by regulating cell volume. Am J Physiol Cell Physiol. 2011;301:C1150–C1160. doi: 10.1152/ajpcell.00203.2011. [DOI] [PMC free article] [PubMed] [Google Scholar]
- 23.Hauser WA, Annegers JF, Kurland LT. Incidence of epilepsy and unprovoked seizures in Rochester, Minnesota: 1935–1984. Epilepsia. 1993;34:453–468. doi: 10.1111/j.1528-1157.1993.tb02586.x. [DOI] [PubMed] [Google Scholar]
- 24.Hildebrand J, Lecaille C, Perennes J, Delattre JY. Epileptic seizures during follow-up of patients treated for primary brain tumors. Neurology. 2005;65:212–215. doi: 10.1212/01.wnl.0000168903.09277.8f. [DOI] [PubMed] [Google Scholar]
- 25.Isokawa M. Decrement of GABAA receptor-mediated inhibitory postsynaptic currents in dentate granule cells in epileptic hippocampus. J Neurophysiol. 1996;75:1901–1908. doi: 10.1152/jn.1996.75.5.1901. [DOI] [PubMed] [Google Scholar]
- 26.Kahle KT, Rinehart J, Lifton RP. Phosphoregulation of the Na-K-2Cl and K-Cl cotransporters by the WNK kinases. Biochim Biophys Acta. 2010;1802:1150–1158. doi: 10.1016/j.bbadis.2010.07.009. [DOI] [PMC free article] [PubMed] [Google Scholar]
- 27.Kahle KT, Staley KJ, Nahed BV, Gamba G, Hebert SC, Lifton RP, Mount DB. Roles of the cation-chloride cotransporters in neurological disease. Nat Clin Pract Neurol. 2008;4:490–503. doi: 10.1038/ncpneuro0883. [DOI] [PubMed] [Google Scholar]
- 28.Knopp A, Frahm C, Fidzinski P, Witte OW, Behr J. Loss of GABAergic neurons in the subiculum and its functional implications in temporal lobe epilepsy. Brain. 2008;131:1516–1527. doi: 10.1093/brain/awn095. [DOI] [PubMed] [Google Scholar]
- 29.Kohling R, Vreugdenhil M, Bracci E, Jefferys JG. Ictal epileptiform activity is facilitated by hippocampal GABAA receptor-mediated oscillations. J Neurosci. 2000;20:6820–6829. doi: 10.1523/JNEUROSCI.20-18-06820.2000. [DOI] [PMC free article] [PubMed] [Google Scholar]
- 30.Lee H, Chen CX, Liu YJ, Aizenman E, Kandler K. KCC2 expression in immature rat cortical neurons is sufficient to switch the polarity of GABA responses. Eur J Neurosci. 2005;21:2593–2599. doi: 10.1111/j.1460-9568.2005.04084.x. [DOI] [PMC free article] [PubMed] [Google Scholar]
- 31.Lee HH, Deeb TZ, Walker JA, Davies PA, Moss SJ. NMDA receptor activity downregulates KCC2 resulting in depolarizing GABAA receptor-mediated currents. Nat Neurosci. 2011a;14:736–743. doi: 10.1038/nn.2806. [DOI] [PMC free article] [PubMed] [Google Scholar]
- 32.Lee HH, Deeb TZ, Walker JA, Davies PA, Moss SJ. NMDA receptor activity downregulates KCC2 resulting in depolarizing GABAA receptor-mediated currents. Nat Neurosci. 2011b;14:736–743. doi: 10.1038/nn.2806. [DOI] [PMC free article] [PubMed] [Google Scholar]
- 33.Marcus HJ, Carpenter KL, Price SJ, Hutchinson PJ. In vivo assessment of high-grade glioma biochemistry using microdialysis: a study of energy-related molecules, growth factors and cytokines. J Neurooncol. 2010;97:11–23. doi: 10.1007/s11060-009-9990-5. [DOI] [PubMed] [Google Scholar]
- 34.Omuro A, DeAngelis LM. Glioblastoma and other malignant gliomas: a clinical review. JAMA. 2013;310:1842–1850. doi: 10.1001/jama.2013.280319. [DOI] [PubMed] [Google Scholar]
- 35.Payne JA, Stevenson TJ, Donaldson LF. Molecular characterization of a putative K-Cl cotransporter in rat brain. A neuronal-specific isoform. J Biol Chem. 1996;271:16245–16252. doi: 10.1074/jbc.271.27.16245. [DOI] [PubMed] [Google Scholar]
- 36.Porter KR, McCarthy BJ, Freels S, Kim Y, Davis FG. Prevalence estimates for primary brain tumors in the United States by age, gender, behavior, and histology. Neuro Oncol. 2010;12:520–527. doi: 10.1093/neuonc/nop066. [DOI] [PMC free article] [PubMed] [Google Scholar]
- 37.Ratte S, Lacaille JC. Selective degeneration and synaptic reorganization of hippocampal interneurons in a chronic model of temporal lobe epilepsy. Adv Neurol. 2006;97:69–76. [PubMed] [Google Scholar]
- 38.Ritz MF, Hausmann ON. Effect of 17beta-estradiol on functional outcome, release of cytokines, astrocyte reactivity and inflammatory spreading after spinal cord injury in male rats. Brain Res. 2008;1203:177–188. doi: 10.1016/j.brainres.2008.01.091. [DOI] [PubMed] [Google Scholar]
- 39.Rivera C, Voipio J, Payne JA, Ruusuvuori E, Lahtinen H, Lamsa K, Pirvola U, Saarma M, Kaila K. The K+/Cl− co-transporter KCC2 renders GABA hyperpolarizing during neuronal maturation. Nature. 1999;397:251–255. doi: 10.1038/16697. [DOI] [PubMed] [Google Scholar]
- 40.Savaskan NE, Heckel A, Hahnen E, Engelhorn T, Doerfler A, Ganslandt O, Nimsky C, Buchfelder M, Eyupoglu IY. Small interfering RNA-mediated xCT silencing in gliomas inhibits neurodegeneration and alleviates brain edema. Nat Med. 2008;14:629–632. doi: 10.1038/nm1772. [DOI] [PubMed] [Google Scholar]
- 41.Scharfman HE. The neurobiology of epilepsy. Curr Neurol Neurosci Rep. 2007;7:348–354. doi: 10.1007/s11910-007-0053-z. [DOI] [PMC free article] [PubMed] [Google Scholar]
- 42.Schwaller B, Tetko IV, Tandon P, Silveira DC, Vreugdenhil M, Henzi T, Potier MC, Celio MR, Villa AE. Parvalbumin deficiency affects network properties resulting in increased susceptibility to epileptic seizures. Mol Cell Neurosci. 2004;25:650–663. doi: 10.1016/j.mcn.2003.12.006. [DOI] [PubMed] [Google Scholar]
- 43.Smits A, Jin Z, Elsir T, Pedder H, Nister M, Alafuzoff I, Dimberg A, Edqvist P, Ponten F, Aronica E, Birnir B. GABA-A Channel Subunit Expression in Human Glioma Correlates with Tumor Histology and Clinical. PLoS One. 2012;7:1–10. doi: 10.1371/journal.pone.0037041. [DOI] [PMC free article] [PubMed] [Google Scholar]
- 44.Staley K, Smith R. A new form of feedback at the GABA(A) receptor. Nat Neurosci. 2001;4:674–676. doi: 10.1038/89439. [DOI] [PubMed] [Google Scholar]
- 45.Takano T, Lin JH, Arcuino G, Gao Q, Yang J, Nedergaard M. Glutamate release promotes growth of malignant gliomas. Nat Med. 2001;7:1010–1015. doi: 10.1038/nm0901-1010. [DOI] [PubMed] [Google Scholar]
- 46.Van Brederode JF, Mulligan KA, Hendrickson AE. Calcium-binding proteins as markers for subpopulations of GABAergic neurons in monkey striate cortex. J Comp Neurol. 1990;298:1–22. doi: 10.1002/cne.902980102. [DOI] [PubMed] [Google Scholar]
- 47.Wang Y, Gupta A, Toledo-Rodriguez M, Wu CZ, Markram H. Anatomical, physiological, molecular and circuit properties of nest basket cells in the developing somatosensory cortex. Cereb Cortex. 2002;12:395–410. doi: 10.1093/cercor/12.4.395. [DOI] [PubMed] [Google Scholar]
- 48.Ye ZC, Rothstein JD, Sontheimer H. Compromised glutamate transport in human glioma cells: reduction- mislocalization of sodium-dependent glutamate transporters and enhanced activity of cystine-glutamate exchange. J Neurosci. 1999;19:10767–10777. doi: 10.1523/JNEUROSCI.19-24-10767.1999. [DOI] [PMC free article] [PubMed] [Google Scholar]
- 49.Ye ZC, Sontheimer H. Glioma cells release excitotoxic concentrations of glutamate. Cancer Res. 1999;59:4383–4391. [PubMed] [Google Scholar]
- 50.Yuen TI, Morokoff AP, Bjorksten A, D’Abaco G, Paradiso L, Finch S, Wong D, Reid CA, Powell KL, Drummond KJ, Rosenthal MA, Kaye AH, O’Brien TJ. Glutamate is associated with a higher risk of seizures in patients with gliomas. Neurology. 2012;79:883–889. doi: 10.1212/WNL.0b013e318266fa89. [DOI] [PubMed] [Google Scholar]
- 51.Zalutsky MR. Current status of therapy of solid tumors: brain tumor therapy. J Nucl Med. 2005;46:49. [PubMed] [Google Scholar]
- 52.Zhu L, Polley N, Mathews GC, Delpire E. NKCC1 and KCC2 prevent hyperexcitability in the mouse hippocampus. Epilepsy Res. 2008;79:201–212. doi: 10.1016/j.eplepsyres.2008.02.005. [DOI] [PMC free article] [PubMed] [Google Scholar]
Associated Data
This section collects any data citations, data availability statements, or supplementary materials included in this article.