

Abstract
Background
Aberrant DNA methylation as the most important reason making epigenetic silencing of genes is a main mechanism of gene inactivation in patients with colorectal cancer. In this study, we decided to identify promoter methylation status of ten genes encoding WNT negative regulators, and measure the expression of DNMT1 enzyme in colorectal cancer samples.
Results
Aberrant methylation of APC gene was statistically significant associated with age over 50 (p = 0.017), DDK3 with male (p < 0.0001), SFRP4, WIF1, and WNT5a with increasing tumor stage (p = 0.004, p = 0.029, and p = 0.004), SFRP4 and WIF1 with tumor differentiation (p = 0.009 and p = 0.031) and SFRP2 and SFRP5 with histological type (p = 0.001 and p = 0.025). The increasing number of methylated genes correlated with the expression levels of the DNMT1 mRNA.
Conclusions
The rate of gene promoter methylation of WNT pathway regulators is high in colorectal cancer cells. Hyper-methylation is associated with increased expression of the DNMT1 enzyme.
Keywords: WNT/β-catenin signaling, Colorectal cancer, Promoter methylation, DNMT1
Background
Colorectal cancer (CRC) is the second-leading cause of cancer deaths among adults [1]. Aberrant DNA methylation as the most important reason of epigenetic gene silencing is the main mechanism of gene inactivation in patients with CRC [2],[3]. Methylation normally occurs in 5-carbon position of cytosine base within CpG dinucleotide in areas of repetitive DNA outside of exons, introduced by DNA methylases; mainly DNA methyltransferase 1 (DNMT1). Although the DNMT1 enzyme is not the only factor involving in the DNA methylation, but plays a significant role in creating it [4]-[6]. DNA methylation of CpG islands in promoter regions of tumor suppressor genes and DNA repair genes is now recognized as a prevalent feature of human cancers [2].
The developmental WNT/β-catenin signaling pathway is one of the well-known signaling pathways involved in embryogenesis and cancer. A common mechanism of carcinogenesis through WNT/β-catenin signaling is the increased levels of β-catenin protein, which are often results from mutations in the adenomatous polyposis coli (APC) gene (encoding a β-catenin inhibitor) or in the β-catenin gene. Moreover, other mechanisms like functional reduction or loss of negative regulators by DNA methylation or overexpression of oncogenic ligands may contribute to WNT pathway activation in cancer development [7]-[9]. In previous studies, DNA methylation of some WNT inhibitors such as APC, axis inhibition protein 2 (AXIN2), secreted frizzled-related protein (SFRP) family and members of the DICKKOPF (DKK) have been reported in CRC [10]-[13].
As of yet, no comprehensive survey on promoter methylation levels of WNT pathway inhibitors in CRC has been performed, while a potential use of promoter methylation in cancer diagnosis and prediction can be highly regarded. In this study, promoter methylation status of ten genes encoding WNT negative regulators was assayed in CRC samples. These genes including extracellular WNT inhibitors [WNT inhibitory factor-1 (WIF1), DKK3, SFRP2, SFRP4, SFRP5], cytosolic WNT antagonists (AXIN2, APC), nuclear proteins [sex determining region Y related box 7 (SOX7) and 17 (SOX17)], and one WNT ligand [wingless-type MMTV integration site family member 5A (WNT5A)]. To estimate the association between methylation and expression of the DNMT1 enzyme, the expression of this enzyme was measured in the samples.
Methods
Subjects
Samples including 125 Formalin-fixed paraffin-embedded (FFPE) cancerous and adjacent normal tissues (normal tissues distances from the tumor were not measured in this study) obtained from the CRC patients who had surgery between 2005 and 2011 from pathology laboratory. Clinical and pathologic features of patients were extracted from medical records and Tumor staging was determined on the basis of the tumor node metastasis (TNM) classification [14]. Samples with mutational familial adenomatous polyposis or hereditary non-polyposis CRC were excluded of this study. This study was approved of the Clinical Research Ethics Committee in Golestan University of Medical Science.
Methylation analysis
Genomic DNA of microdissected tissue samples was extracted and bisulfite treated using the EpiTect Fast Bisulfite Conversion Kit (Qiagen, Hilden, Germany). Methylation specific PCR (MSP) primers of 10 selected candidate genes were prepared as described previously [15]. MSP was performed using 50 nanograms of modified DNA and Taq DNA polymerase (Roche, Woerden, Netherlands) in 7500 Real-Time PCR system (Applied Biosystem, USA). The methylation was calculated from threshold cycles (CT) values. Ten MSPs for the WNT inhibitors were analytically validated using methylated DNA as positive control (CTs ≤ 25 cycles) and primary keratinocyte DNA as unmethylated controls (CTs > 35 cycles).
DNMT1 expression assay
The amplification primers for human DNMT1 and Hypoxanthine-guanine phosphoribosyltransferase (HPRT) cDNA designed by GENE RUNNER software and be reviewed in NCBI and BLAST. DNMT1 Primers sequence including 5′-AGCCAGGTAGCCCTCCTC-3′ as forward and 5′-GACAGCTTAACAGAAAAGGAATG-3′ as reverse with a 141 base pairs (bp) PCR product (GenBank accession number NM_001379.1) and HPRT including 5′-TGGACTAATTATGGACAGGACT-3′ as forward and 5′-CCTGTTGACTGGTCATTACAAT-3′ as reverse with a 219 bp PCR product (GenBank accession number NM_000194). Total RNA was purified from microdissected FFPE tissues using the PureLink FFPE RNA Isolation Kit (Invitrogen, Karlsruhe, Germany). The first strand cDNA was generated using a SuperScript III First-Strand Synthesis SuperMix (Invitrogen, Karlsruhe, Germany). Reverse transcriptase PCR was performed using SYBR Green PCR Master Mix (Fermentas, Lithuania) in triplicate and normalized to HPRT in 7500 detection system. Real-Time PCR conditions consist of 40 cycles (95°C for 15 s, 55°C for 30 s, 72°C for 20 s) after one step initial denaturation (95°C for 10 min). The mean and standard deviation (SD) of DNMT1 mRNA was calculated by 2-ΔCT and the expression fold was calculated by the 2-ΔΔCT and a fold change ≥1.5 was considered as overexpression [16].
Statistical analysis
Statistical analysis was performed by SPSS (version 17.0). Methylation frequencies associations with clinical and pathologic features were analyzed using chi-squared and fisher’s exact test. The survival curves were estimated by the Kaplan-Meier method. Association between promoter methylation status with survival was examined by the log-rank test. Survival time was determined from the diagnosis date to the death date due to CRC. A p-value of less than 0.05 was considered statistically significant.
Results
The promoter methylation status
In this study, the promoter methylation was examined on ten genes encoding the WNT pathway inhibitors in CRC tissue samples. Aberrant promoter methylation was detected in 78.4% of patients (98 of 125) (CTs ≤ 25) and none of adjacent non-tumor samples showed methylation (CTs > 35 cycles). The promoter methylation status of the ten genes, including APC, AXIN2, DKK3, SFRP2, SFRP4, SERP5, SOX7, SOX17, WIF1 and WNT5a are respectively 44 samples (35.2%), 41 (32.8%), 50 (40%), 58 (46.4%), 38 (28.8%), 33 (26.4%), 40 (32%), 42 (33.6%), 52 (41.6%) and 28 (22.4%) (Table 1).
Table 1.
The association of promoter methylation frequencies and DNMT1 expression with some pathological and clinical features of patients
|
Clinical and pathological features |
N |
APC
|
AXIN2
|
DKK3
|
SFRP2
|
SFRP4
|
SFRP5
|
SOX7 |
SOX17
|
WIF1
|
WNT5a
|
DNMT1
expression |
||||||||||||||||||||||
|---|---|---|---|---|---|---|---|---|---|---|---|---|---|---|---|---|---|---|---|---|---|---|---|---|---|---|---|---|---|---|---|---|---|---|
|
N (%) |
|
N (%) |
|
N (%) |
|
N (%) |
|
N (%) |
|
N (%) |
|
N (%) |
|
N (%) |
|
N (%) |
|
N (%) |
|
Fold change (%) |
|
|||||||||||||
|
M |
U |
p
|
M |
U |
P
|
M |
U |
p
|
M |
U |
p
|
M |
U |
p
|
M |
U |
p
|
M |
U |
p
|
M |
U |
p
|
M |
U |
p
|
M |
U |
p
|
≥1.5 |
<1.5 |
p
|
||
| All cases | 125 | 44 (35.2) | 81 (64.8) | 41 (32.8) | 84 (67.2) | 50 (40) | 75 (60) | 58 (46.4) | 67 (53.6) | 38 (30.4) | 87 (69.6) | 33 (26.4) | 92 (73.6) | 40 (32) | 85 (68) | 42 (33.6) | 83 (66.4) | 52 (41.6) | 73 (58.4) | 28 (22.4) | 97 (77.6) | 52 (41.6) | 73 (58.4) | |||||||||||
|
Age |
|
|
|
.017 |
|
|
|
|
|
|
|
|
|
|
|
|
|
|
|
|
|
|
|
|
|
|
|
|
|
|
|
|
|
|
| <50 |
18 |
11 (25) |
7 (8.7) |
|
7 (17.1) |
11 (13.1) |
|
8 (16) |
10 (13.3) |
|
9 (15.5) |
9 (13.4) |
|
5 (13.2) |
13 (14.9) |
|
8 (24.2) |
10 (10.7) |
|
7 (17.5) |
11 (12.5) |
|
10 (23.8) |
8 (9.6) |
|
5 (9.6) |
13 (17.8) |
|
6 (21.4) |
12 (12.4) |
|
7 (13.5) |
11 (15.1) |
|
| ≥50 |
107 |
33 (75) |
74 (91.3) |
|
34 (82.9) |
73 (86.9) |
|
42 (84) |
65 (86.7) |
|
49 (84.5) |
58 (86.6) |
|
33 (86.8) |
74 (85.1) |
|
25 (75.8) |
82 (89.3) |
|
33 (82.5) |
74 (87.5) |
|
32 (76.2) |
75 (90.4) |
|
47 (90.4) |
60 (82.2) |
|
22 (78.6) |
85 (87.6) |
|
45 (86.5) |
62 (84.9) |
|
|
Sex |
|
|
|
|
|
|
|
|
|
<.001 |
|
|
|
|
|
|
|
|
|
|
|
|
|
|
|
|
|
|
|
|
|
|
|
|
| Female |
55 |
21 (47.7) |
34 (42) |
|
16 (39) |
39 (46.4) |
|
12 (24) |
43 (57.3) |
|
28 (48.3) |
27 (40.3) |
|
13 (34.2) |
42 (48.3) |
|
17 (51.5) |
38 (41.3) |
|
19 (47.5) |
36 (42.4) |
|
15 (35.7) |
40 (48.2) |
|
23 (44.2) |
32 (43.8) |
|
12 (42.8) |
43 (44.3) |
|
21 (40.4) |
34 (46.6) |
|
| Male |
70 |
23 (52.3) |
47 (58) |
|
25 (61) |
45 (53.6) |
|
38 (76) |
32 (42.7) |
|
30 (51.7) |
40 (59.7) |
|
25 (65.8) |
45 (51.7) |
|
16 (48.5) |
54 (58.7) |
|
21 (52.5) |
49 (57.6) |
|
27 (64.3) |
43 (51.8) |
|
29 (55.8) |
41 (56.2) |
|
16 (57.2) |
54 (55.7) |
|
31 (59.6) |
39 (53.4) |
|
| Tumor location |
|
|
|
|
|
|
|
|
|
|
|
|
|
|
|
|
|
|
|
|
|
|
|
|
|
|
|
|
|
|
|
|
|
|
| Proximal |
58 |
18 (40.9) |
40 (49.2) |
|
19 (46.3) |
39 (46.4) |
|
24 (48) |
34 (45.3) |
|
32 (55.1) |
26 (38.8) |
|
17 (44.7) |
41 (47.1) |
|
16 (48.5) |
42 (45.7) |
|
21 (52.5) |
37 (43.5) |
|
20 (47.6) |
38 (45.8) |
|
27 (51.9) |
31 (42.5) |
|
14 (50) |
44 (45.4) |
|
28 (53.8) |
30 (41.1) |
|
| Distal |
67 |
26 (59.1) |
41 (50.8) |
|
22 (53.7) |
45 (53.6) |
|
26 (52) |
41 (54.7) |
|
26 (44.9) |
41 (61.2) |
|
21 (55.3) |
46 (52.9) |
|
17 (51.5) |
50 (54.3) |
|
19 (47.5) |
48 (56.5) |
|
22 (52.4) |
45 (54.2) |
|
25 (48.1) |
42 (57.5) |
|
14 (50) |
53 (54.6) |
|
24 (46.2) |
43 (58.9) |
|
|
TNM stage |
|
|
|
|
|
|
|
|
|
|
|
|
|
|
|
.004 |
|
|
|
|
|
|
|
|
|
|
|
.029 |
|
|
.004 |
|
|
|
| I |
17 |
5 (11.4) |
12 (14.8) |
|
6 (14.6) |
11 (13.1) |
|
8 (16) |
9 (12) |
|
9 (15.5) |
8 (11.9) |
|
4 (10.5) |
13 (14.9) |
|
5 (15.2) |
12 (13) |
|
7 (17.5) |
10 (11.8) |
|
6 (14.3) |
11 (13.3) |
|
12 (23.1) |
5 (6.8) |
|
3 (10.7) |
14 (14.4) |
|
7 (13.5) |
10 (13.7) |
|
| II |
39 |
17 (38.6) |
22 (27.2) |
|
11 (26.8) |
28 (33.3) |
|
15 (30) |
24 (32) |
|
18 (31) |
21 (31.3) |
|
10 (26.3) |
29 (33.3) |
|
12 (36.4) |
27 (29.3) |
|
13 (32.5) |
26 (30.6) |
|
10 (23.8) |
29 (34.9) |
|
14 (26.9) |
25 (34.3) |
|
5 (17.8) |
34 (35.1) |
|
13 (25) |
26 (35.6) |
|
| III |
61 |
18 (40.9) |
43 (53.1) |
|
19 (46.4) |
42 (50) |
|
22 (44) |
39 (52) |
|
25 (43.1) |
36 (53.8) |
|
17 (44.7) |
44 (50.6) |
|
13 (39.4) |
48 (52.2) |
|
16 (40) |
45 (52.9) |
|
24 (57.1) |
37 (44.6) |
|
25 (48.1) |
36 (49.3) |
|
14 (50) |
47 (48.4) |
|
27 (51.9) |
34 (46.6) |
|
| IV |
8 |
4 (9.1) |
4 (4.9) |
|
5 (12.2) |
3 (3.6) |
|
5 (10) |
3 (4) |
|
6 (10.4) |
2 (3) |
|
7 (18.5) |
1 (1.2) |
|
3 (9) |
5 (5.5) |
|
4 (10) |
4 (4.7) |
|
2 (4.8) |
6 (7.2) |
|
1 (1.9) |
7 (9.6) |
|
6 (21.5) |
2 (2.1) |
|
5 (9.6) |
3 (4.1) |
|
| Tumor differentiation |
|
|
|
|
|
|
|
|
|
|
|
|
|
|
|
.009 |
|
|
|
|
|
|
|
|
|
|
|
.031 |
|
|
|
|
|
|
| Low |
11 |
4 (9.1) |
7 (8.7) |
|
5 (12.2) |
6 (7.1) |
|
3 (6) |
8 (10.7) |
|
4 (6.9) |
7 (10.4) |
|
6 (15.8) |
5 (5.7) |
|
3 (9.1) |
8 (8.7) |
|
2 (5) |
9 (10.6) |
|
7 (16.7) |
4 (4.8) |
|
1 (1.9) |
10 (13.7) |
|
3 (10.7) |
8 (8.2) |
|
4 (7.7) |
7 (9.6) |
|
| Moderate |
89 |
30 (68.2) |
59 (72.8) |
|
27 (65.9) |
62 (73.8) |
|
39 (78) |
50 (66.7) |
|
43 (74.1) |
46 (68.7) |
|
20 (52.6) |
69 (79.3) |
|
22 (66.7) |
67 (72.8) |
|
32 (80) |
57 (67.1) |
|
30 (71.4) |
59 (71.1) |
|
37 (71.2) |
52 (71.2) |
|
18 (64.3) |
71 (73.2) |
|
36 (69.2) |
53 (72.6) |
|
| High |
25 |
10 (22.7) |
15 (18.5) |
|
9 (21.9) |
16 (19.1) |
|
8 (16) |
17 (22.6) |
|
11 (19) |
14 (20.9) |
|
12 (31.6) |
13 (15) |
|
8 (24.2) |
17 (18.5) |
|
6 (15) |
19 (22.3) |
|
5 (11.9) |
20 (24.1) |
|
14 (26.9) |
11 (15.1) |
|
7 (25) |
18 (18.6) |
|
12 (23.1) |
13 (17.8) |
|
| Histological type |
|
|
|
|
|
|
|
|
|
|
|
|
.001 |
|
|
|
|
|
.025 |
|
|
|
|
|
|
|
|
|
|
|
|
|
|
|
| Non-mucinous |
98 |
30 (68.2) |
68 (84) |
|
34 (82.9) |
64 (76.2) |
|
39 (78) |
59 (78.7) |
|
53 (91.4) |
45 (67.2) |
|
30 (78.9) |
68 (78.2) |
|
21 (63.6) |
77 (83.7) |
|
34 (85) |
64 (75.3) |
|
32 (76.1) |
66 (79.5) |
|
37 (71.2) |
61 (83.6) |
|
19 (67.8) |
79 (81.4) |
|
35 (67.3) |
63 (86.3) |
|
| Mucinous | 27 | 14 (31.8) | 13 (16) | 7 (17.1) | 20 (23.8) | 11 (22) | 16 (21.3) | 5 (8.6) | 22 (32.8) | 8 (21.1) | 19 (21.8) | 12 (36.4) | 15 (16.3) | 6 (15) | 21 (24.7) | 10 (23.9) | 17 (20.5) | 15 (28.8) | 12 (16.4) | 9 (32.2) | 18 (18.6) | 17 (32.7) | 10 (13.7) | |||||||||||
N; Number of cases, M; Methylated, U; Unmethylated, p; p value.
Only significant P values are described.
The correlation with clinical and pathological features
We analyzed methylation status relationship of these genes with some patients’ clinical and pathological features. As the results in Table 1 show, APC gene methylation is statistically associated with age over 50 (p = 0.017). DDK3 gene methylation is also significantly associated with male (p < 0.0001). Methylation of SFRP4, WIF1 and WNT5a genes were meaningfully associated with increasing tumor stage (p = 0.004, p = 0.029 and p = 0.004). Moreover, methylation frequency of SFRP4 and WIF1 genes were also significantly associated with tumor differentiation (p = 0.009 and p = 0.031). The SFRP2 and SFRP5 genes methylation was correlated with histological type, therefore the frequency of methylation is higher in non-mucinous type (p = 0.001 and p = 0.025). There is no significant association between genes methylation status and tumor location. There is also no significant association between DNMT1 expression and clinicopathological features.
Follow-up information was available on 112 CRC patients for 42 ± 25 (3 to 80) months. Univariate analysis by the Kaplan-Meier curves indicated, among the ten genes, only WIF1 has a negative correlation between promoter methylation and survival in CRC patients (P < 0.001) (Figure 1).
Figure 1.
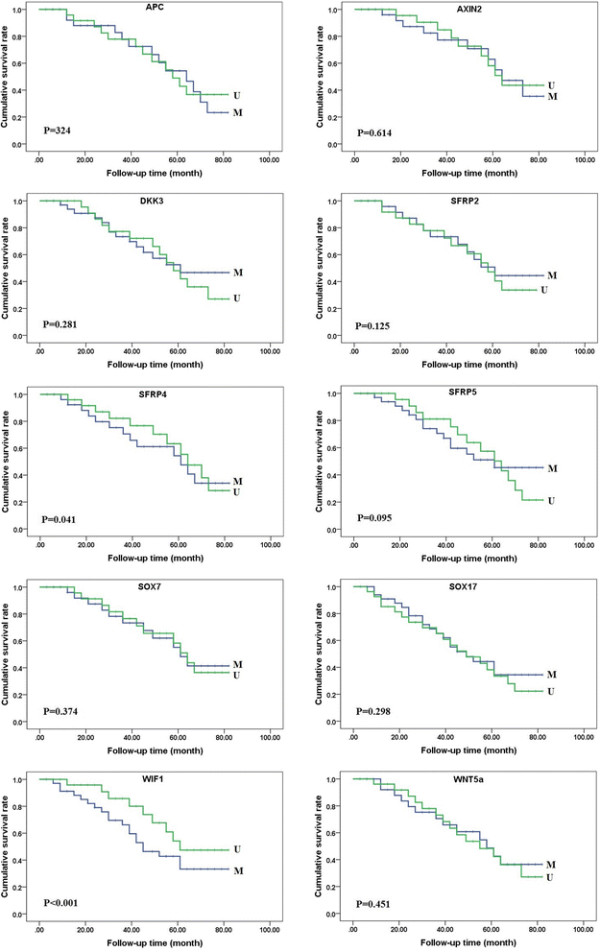
Kaplan-Meier curves for overall survival in colorectal carcinomas. Kaplan-Meier curves for cumulative survival rate of patients according to the promoter methylation in all the colorectal carcinomas. Among the ten genes, only patients with methylated WIF1 gene promoter had shorter overall survival. M, Methylated; U,Unmethylated.
Correlation of DNMT1 overexpression with the increasing number of methylated genes
We assayed the expression levels of DNMT1 enzyme mRNA in 125 tumor and adjacent normal tissues. As Figure 2 shows, DNMT1 expression in CRC tissues (2.01 ± 0.82) is statistically higher than the non-tumor mucosa (1.02 ± 0.52) (P < 0.001), as well as methylated (2.91 ± 0.95) than non-methylated samples (1.07 ± 0.44) (P < 0.001). We also investigated the expression levels of DNMT1 mRNA within methylated samples and was compared to fold changes of DNMT1 expression. For this purpose, methylated samples were divided into six groups according to the number of methylated genes. The results show; the expression level of the DNMT1 mRNA was directly correlated with the increasing number of methylated genes in methylated samples (Table 2).
Figure 2.
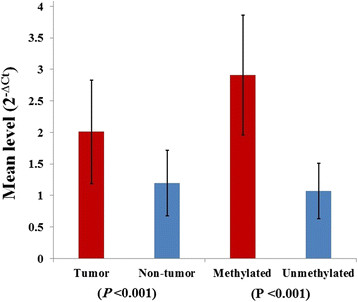
The expression levels ofDNMT1enzyme mRNA in colorectal carcinomas. The level of DNMT1 expression in methylated samples is higher than non-methylated as well as tumor samples than non-tumor.
Table 2.
The relationship of DNMT1 expression with the number of methylated genes
| Number of methylated genes |
DNMT1
-overexpressed cases |
Odds ratio (CI 95%) | |
|---|---|---|---|
| N (%) | Fold change (mean ± SD) | ||
| 1 (n = 35) |
13 (37.1) |
1.52 ± 1.12 |
1 |
| 2 (n = 19) |
11 (57.9) |
2.12 ± 1.56 |
2.3 (0.7-7.2) |
| 3 (n = 16) |
9 (56.2) |
2.02 ± 1.78 |
2.1 (0.6-7.2) |
| 4 (n = 10) |
6 (60) |
3.61 ± 1.89 |
2.5 (0.6-10.7) |
| 5 (n = 11) |
7 (63.6) |
3.06 ± 1.55 |
2.9 (0.7-12.9) |
| 6 (n = 7) | 6 (85.7) | 4.14 ± 1.28 | 10.1 (1.1-93.9)* |
*p value <0.05, CI, confidence interval.
Discussion
Today, the epigenetic markers of causing changes in the WNT signaling pathways are highly considered, both in the detection and prognosis of the disease process in many cancers [17]. The study of methylation as a reversible major change during the early stages of tumor angiogenesis is under investigation [18],[19]. Hence, we were going to investigate the variability of promoter methylation of WNT negative regulators to estimate these changes in CRC. In this study, the frequency of promoter methylation of APC gene (35.2%) is higher than the frequency obtained during the studies of Chen et al. (17.9%), Esteller et al. (18%) and Arnold et al. (28%) [10],[20],[21]. On the other hand, this frequency is less than the frequencies in Studies of Iacopetta et al. (41.1%) and Fu et al. (41.7%) [22],[23]. Because, changes in the APC gene are the most common cause of CRC, 35.2% methylation can also be significant. The AXIN2 methylation frequency of this study (32.8%) compared to prevalence of the Koinuma et al. study (25%) had higher level [11]. It seems that frequency of DKK3 promoter methylation (40%) is less than Yu et al. study (52%). Unlike Yu et al. study, we reported that the increasing of promoter methylation frequency was significant in men, but we did not find a significant association between promoter methylation frequencies with cancer progression stages [12]. The promoter methylation frequency of SFRP2, 4, 5 genes in this study (46.4%, 28.8%, and 26.4%) compared to the results of Qi et al. study (82.8%, 32.4% and 54.3%) is much lower [13]. Low frequency of WIF1 promoter methylation in this study (41.6%) compared to the Lee et al. study (74%) was also considerable [24]. There are few differences between frequency of WNT5a promoter methylation in this study (22.4%) and Rawson et al. study (18.8%). In both studies, the frequency of promoter methylation is significantly associated with female gender [25] (Table 3). Univariate analysis indicates that WIF1 promoter methylation is prognostic factors for overall survival in colorectal carcinomas. The results of this study show that DNMT1 expression levels in methylated samples are higher from unmethylated, unlike Ting et al. study in which they believed the DNMT1 enzyme has no effect on the maintenance of DNA methylation [26]. The increasing expression of the DNMT1 enzyme weakly correlates with the increasing number of methylated genes (Table 2). On the other hand, there have not been many studies on correlation between DNMT1 expression and methylation, which makes it difficult to evaluate our work; Therefore, It needs more study.
Table 3.
The comparison of promoter methylation of this study and other reports in colorectal carcinomas
| Genes | Number of methylated samples (%) | References (frequency of gene) |
|---|---|---|
| APC |
44 (35.2) |
Esteller et al. [21] (18%); Arnold et al. [10] (28%); Chen et al. [20] (17.9%); Iacopetta et al. [22] (41.1%) and Fu et al. [23] (41.7%) |
| AXIN2 |
41 (32.8) |
Koinuma et al. [11] (25%) |
| DKK3 |
50 (40) |
Yu et al. [12] (52%) |
| SFRP2 |
58 (46.4) |
Qi et al. [13] (82.8%) |
| SFRP4 |
38 (30.4) |
Qi et al. [13] (32.4%) |
| SFRP5 |
33 (26.4) |
Qi et al. [13] (54.3%) |
| SOX7 |
40 (32) |
No Reference |
| SOX17 |
42 (33.6) |
No Reference |
| WIF1 |
52 (41.6) |
Lee et al. [24] (74%) |
| WNT5a | 28 (22.4) | Rawson et al. [25] (18.8%) |
Conclusions
We have shown that the rate of gene methylation in cancer cells increases can contribute to cancer development and progression. Methylation may also increase due to increased expression or mutations in the methyltransferase enzyme or their regulatory proteins in cancer cells. Knowing the rate of DNMT1 enzyme overexpression in human cancers, particularly in cases of hyper-methylated might be useful as part of the diagnostic and prognostic evaluation in human cancers.
Competing interests
The authors declare no conflict of interests.
Authors’ contributions
NMS carried out the Real-Time PCR, data analysis and manuscript preparation. YY, RAN and HA participated project design, data analysis and manuscript preparation. TF supervised experimental design, data analysis and reviewed manuscript. All authors read and approved the final manuscript.
Contributor Information
Nader Mansour Samaei, Email: n_samaei@yahoo.com.
Yaghoub Yazdani, Email: yazdani@goums.ac.ir.
Reza Alizadeh-Navaei, Email: reza_nava@yahoo.com.
Hossein Azadeh, Email: Hosein.azadeh@gmail.com.
Touraj Farazmandfar, Email: tourajf@yahoo.com.
Acknowledgments
This study supported by a grant from the Research and Technology Department in Golestan University of Medical Sciences.
References
- Jemal A, Siegel R, Ward E, Hao Y, Xu J, Murray T, Thun MJ. Cancer statistics, 2008. CA Cancer J Clin. 2008;58:71–96. doi: 10.3322/CA.2007.0010. [DOI] [PubMed] [Google Scholar]
- Issa J-P. CpG island methylator phenotype in cancer. Nat Rev Cancer. 2004;4:988–993. doi: 10.1038/nrc1507. [DOI] [PubMed] [Google Scholar]
- Kondo Y, Issa J-PJ. Epigenetic changes in colorectal cancer. Cancer Metastasis Rev. 2004;23:29–39. doi: 10.1023/A:1025806911782. [DOI] [PubMed] [Google Scholar]
- Markowitz SD, Bertagnolli MM. Molecular origins of cancer: molecular basis of colorectal cancer. N Engl J Med. 2009;361:2449–2460. doi: 10.1056/NEJMra0804588. [DOI] [PMC free article] [PubMed] [Google Scholar]
- Ting AH, Jair K, Schuebel KE, Baylin SB. Differential requirement for DNA methyltransferase 1 in maintaining human cancer cell gene promoter hypermethylation. Cancer Res. 2006;66:729–735. doi: 10.1158/0008-5472.CAN-05-1537. [DOI] [PubMed] [Google Scholar]
- Jair K-W, Bachman KE, Suzuki H, Ting AH, Rhee I, Yen R-WC, Baylin SB, Schuebel KE. De novo CpG island methylation in human cancer cells. Cancer Res. 2006;66:682–692. doi: 10.1158/0008-5472.CAN-05-1980. [DOI] [PubMed] [Google Scholar]
- Smith JJ, Deane NG, Dhawan P, Beauchamp RD. Regulation of metastasis in colorectal adenocarcinoma: a collision between development and tumor biology. Surgery. 2008;144:353–366. doi: 10.1016/j.surg.2008.05.007. [DOI] [PMC free article] [PubMed] [Google Scholar]
- Veeck J, Dahl E. Targeting the Wnt pathway in cancer: the emerging role of Dickkopf-3. Biochim Biophys Acta. 1825;2012:18–28. doi: 10.1016/j.bbcan.2011.09.003. [DOI] [PubMed] [Google Scholar]
- Bienz M, Clevers H. Linking colorectal cancer to Wnt signaling. Cell. 2000;103:311–320. doi: 10.1016/S0092-8674(00)00122-7. [DOI] [PubMed] [Google Scholar]
- Arnold CN, Goel A, Niedzwiecki D, Dowell JM, Wasserman L, Compton C, Mayer RJ, Bertagnolli MM, Boland CR. APC promoter hypermethylation contributes to the loss of APC expression in colorectal cancers with allelic loss on 5q. Cancer Biol Ther. 2004;3:960–964. doi: 10.4161/cbt.3.10.1113. [DOI] [PubMed] [Google Scholar]
- Koinuma K, Yamashita Y, Liu W, Hatanaka H, Kurashina K, Wada T, Takada S, Kaneda R, Choi YL, Fujiwara S-I, Miyakura Y, Nagai H, Mano H. Epigenetic silencing of AXIN2 in colorectal carcinoma with microsatellite instability. Oncogene. 2006;25:139–146. doi: 10.1038/sj.onc.1209009. [DOI] [PubMed] [Google Scholar]
- Yu J, Tao Q, Cheng YY, Lee KY, Ng SSM, Cheung KF, Tian L, Rha SY, Neumann U, Röcken C, Ebert MPA, Chan FKL, Sung JJY. Promoter methylation of the Wnt/beta-catenin signaling antagonist Dkk-3 is associated with poor survival in gastric cancer. Cancer. 2009;115:49–60. doi: 10.1002/cncr.23989. [DOI] [PubMed] [Google Scholar]
- Qi J, Zhu Y-Q, Luo J, Tao W-H. Hypermethylation and expression regulation of secreted frizzled-related protein genes in colorectal tumor. World J Gastroenterol. 2006;12:7113–7117. doi: 10.3748/wjg.v12.i44.7113. [DOI] [PMC free article] [PubMed] [Google Scholar]
- Sobin LH, Fleming ID. TNM Classification of Malignant Tumors, fifth edition (1997). Union Internationale Contre le Cancer and the American Joint Committee on Cancer. Cancer. 1997;80:1803–1804. doi: 10.1002/(SICI)1097-0142(19971101)80:9<1803::AID-CNCR16>3.0.CO;2-9. [DOI] [PubMed] [Google Scholar]
- Van der Meide WF, Snellenberg S, Meijer CJLM, Baalbergen A, Helmerhorst TJM, van der Sluis WB, Snijders PJF, Steenbergen RDM. Promoter methylation analysis of WNT/β-catenin signaling pathway regulators to detect adenocarcinoma or its precursor lesion of the cervix. Gynecol Oncol. 2011;123:116–122. doi: 10.1016/j.ygyno.2011.06.015. [DOI] [PubMed] [Google Scholar]
- Schmittgen TD, Livak KJ. Analyzing real-time PCR data by the comparative C(T) method. Nat Protoc. 2008;3:1101–1108. doi: 10.1038/nprot.2008.73. [DOI] [PubMed] [Google Scholar]
- Ying Y, Tao Q. Epigenetic disruption of the WNT/beta-catenin signaling pathway in human cancers. Epigenetics. 2009;4:307–312. doi: 10.4161/epi.4.5.9371. [DOI] [PubMed] [Google Scholar]
- Paluszczak J, Baer-Dubowska W. Epigenetic diagnostics of cancer–the application of DNA methylation markers. J Appl Genet. 2006;47:365–375. doi: 10.1007/BF03194647. [DOI] [PubMed] [Google Scholar]
- Kulis M, Esteller M. DNA methylation and cancer. Adv Genet. 2010;70:27–56. doi: 10.1016/B978-0-12-380866-0.60002-2. [DOI] [PubMed] [Google Scholar]
- Chen J, Röcken C, Lofton-Day C, Schulz H-U, Müller O, Kutzner N, Malfertheiner P, Ebert MPA. Molecular analysis of APC promoter methylation and protein expression in colorectal cancer metastasis. Carcinogenesis. 2005;26:37–43. doi: 10.1093/carcin/bgh280. [DOI] [PubMed] [Google Scholar]
- Esteller M, Sparks A, Toyota M, Sanchez-Cespedes M, Capella G, Peinado MA, Gonzalez S, Tarafa G, Sidransky D, Meltzer SJ, Baylin SB, Herman JG. Analysis of adenomatous polyposis coli promoter hypermethylation in human cancer. Cancer Res. 2000;60:4366–4371. [PubMed] [Google Scholar]
- Iacopetta B, Grieu F, Li W, Ruszkiewicz A, Caruso M, Moore J, Watanabe G, Kawakami K. APC gene methylation is inversely correlated with features of the CpG island methylator phenotype in colorectal cancer. Int J Cancer. 2006;119:2272–2278. doi: 10.1002/ijc.22237. [DOI] [PubMed] [Google Scholar]
- Fu X, Li J, Li K, Tian X, Zhang Y. Hypermethylation of APC promoter 1A is associated with moderate activation of Wnt signalling pathway in a subset of colorectal serrated adenomas. Histopathology. 2009;55:554–563. doi: 10.1111/j.1365-2559.2009.03411.x. [DOI] [PubMed] [Google Scholar]
- Lee BB, Lee EJ, Jung EH, Chun H-K, Chang DK, Song SY, Park J, Kim D-H. Aberrant methylation of APC, MGMT, RASSF2A, and Wif-1 genes in plasma as a biomarker for early detection of colorectal cancer. Clin Cancer Res. 2009;15:6185–6191. doi: 10.1158/1078-0432.CCR-09-0111. [DOI] [PubMed] [Google Scholar]
- Rawson JB, Mrkonjic M, Daftary D, Dicks E, Buchanan DD, Younghusband HB, Parfrey PS, Young JP, Pollett A, Green RC, Gallinger S, McLaughlin JR, Knight JA, Bapat B. Promoter methylation of Wnt5a is associated with microsatellite instability and BRAF V600E mutation in two large populations of colorectal cancer patients. Br J Cancer. 2011;104:1906–1912. doi: 10.1038/bjc.2011.165. [DOI] [PMC free article] [PubMed] [Google Scholar]
- Ting AH, Jair K, Suzuki H, Yen R-WC, Baylin SB, Schuebel KE. CpG island hypermethylation is maintained in human colorectal cancer cells after RNAi-mediated depletion of DNMT1. Nat Genet. 2004;36:582–584. doi: 10.1038/ng1365. [DOI] [PubMed] [Google Scholar]