Abstract
Combination of bioaffinity and chromatography gave birth to affinity chromatography. A further combination with frontal analysis resulted in creation of frontal affinity chromatography (FAC). This new versatile research tool enabled detailed analysis of weak interactions that play essential roles in living systems, especially those between complex saccharides and saccharide-binding proteins. FAC now becomes the best method for the investigation of saccharide-binding proteins (lectins) from viewpoints of sensitivity, accuracy, and efficiency, and is contributing greatly to the development of glycobiology. It opened a door leading to deeper understanding of the significance of saccharide recognition in life. The theory is also concisely described.
Keywords: frontal affinity chromatography, FAC, lectin profiling, PA-saccharide, galectin, concanavalin A
Introduction
Affinity chromatography started its progress at the late 1960s, and soon became an indispensable tool in life science through its excellent ability in purifying rare and instable biomolecules, especially proteins. Without invention of this technique, life science would have progressed much slower. On the early stage, its application was limited only to preparative purposes. We also, in the beginning, intended to use it only for isolation and purification of enzymes functioning in the blood clotting system. However, after several unexpected findings, we became aware of its great potential as a tool for analyzing specific interaction between biomolecules. Affinity chromatography was created by combining the capacity of recognition which most biomolecules possess and the efficient separation ability of chromatography. We therefore decided to take advantage of these merits. To reach this goal, quantitative treatment of chromatographic results seemed to be essential. This problem was solved by adopting a principle of frontal analysis. We succeeded in describing by a simple equation the equilibrium state formed between a soluble analyte in the moving phase and an immobilized ligand on the adsorbent. Frontal affinity chromatography (FAC) thus established allowed us by a simple experiment to determine the most important parameter of specific interaction, that is, an equilibrium constant (dissociation constant or association constant). Moreover, FAC turned out to be extremely useful for studies on not only enzymes but also binding proteins lacking catalytic activity such as lectins, and particularly fit for analysis of weak interactions, which are always hard to investigate. Glycobiology was one of typical research fields where elucidation of the networks composed of diverse weak interactions was essential, and lack of appropriate research tools was serious. Therefore, we tried application of FAC to this field in order to make a breakthrough. The results met our expectation. FAC demonstrated its utility especially in lectin research. We succeeded in detailed description of binding property of a lectin (concanavalin A, ConA) towards complex saccharides for the first time. Development of high-performance liquid chromatography (HPLC) and computer technology were favorable for further growth of FAC. FAC now becomes the best method for profiling lectins from viewpoints of sensitivity, accuracy, and efficiency, and is contributing greatly to the development of glycobiology. In this article, development of FAC is overviewed from its birth. The theory is concisely described in the last chapter.
1. Affinity chromatography of trypsin
Cuatrecasas et al. published a report in 1968, which is now widely considered as the starting point of affinity chromatography.1) They succeeded in preparing affinity adsorbents for enzymes, such as chymotrypsin and ribonuclease. Three essential factors needed for success in affinity chromatography, which are still valid even after about half a century, were already pointed out in this report.
-
(1)
Use of hydrophilic gel particles (e.g., agarose gel beads) as supporting matrix for immobilization of a bait molecule (ligand) in order to avoid non-specific, hydrophobic interaction with target molecules.
-
(2)
Insertion of a spacer between the immobilized ligand and the supporting gel matrix in order to allow a target molecule to access to and interact with the former without interference of the latter.
-
(3)
A mild procedure for ligand immobilization which is feasible in aqueous media in order to avoid destruction of ligand molecules and the supporting gel. They proposed a procedure consisting of activation of agarose gel with cyanogen bromide,2) which was efficient and easy enough even for non-expert scientists.
They prepared an affinity adsorbent for chymotrypsin immobilizing a derivative of D-tryptophan methyl ester to agarose gel particles (Sepharose) via an appropriate spacer. D-tryptophan methyl ester is the enantiomer of L-tryptophan methyl ester, an artificial substrate of chymotrypsin, and not hydrolysable by chymotrypsin, but was expected to have affinity for the enzyme. The immobilized ligand should remain unchanged after the contact with the enzyme to assure repeated use of the adsorbent. This plan worked, and the choice of the enantiomer of the substrate turned out to be successful.
We were stimulated by their work, and wished to apply this new technique to trypsin family proteases, because we were trying to purify blood clotting enzymes, and had already met many difficulties. Since proteases functioning in the blood clotting system were known to belong to the trypsin family, we intended to prepare firstly an affinity adsorbent for trypsin. We planned to use a mixture of product-type peptides instead of an enantiomer of substrates as the ligand for immobilization, because it was very easy to prepare. The testis of some fish contains a large amount of basic proteins (protamine) characterized by their high content of basic amino acids. For example, salmine (protamine of salmon) was known to contain about 30% of arginine. By trypsin digestion, it gave a mixture of peptides terminated with L-arginine. We expected that the L-arginine at the C-terminal retained a certain degree of affinity for trypsin, even though it might be rather weak. They contained amino groups at the N-terminal that serve for immobilization reaction with the activated agarose gel, and their intermediary residues were expected to serve as the spacer. At that time, we were uncertain whether this attempt worked, because the affinity of products of enzyme action is usually lower than that of substrates. In the case where affinity of the prepared adsorbent turned out too low, we had a next plan to block the C-terminal free carboxyl groups by an imino compound. This treatment should have converted the product-type peptides to substrate-like ones, and resulted in enhancement of affinity for trypsin. Since the carboxyimido linkage thus formed should be resistant to trypsin action, the adsorbent could have been used repeatedly.
We prepared a mixture of peptides having L-arginine at the C-termini (AP) by digesting salmine by trypsin, and immobilized them to Sepharose. To a column packed with thus prepared AP-Sepharose, we applied a solution of a commercial trypsin preparation. Chromatography was carried out at pH 8.2, which is the optimum pH of trypsin action. Fractions of a constant volume of eluate were collected, and elution of trypsin was monitored by measuring the enzymatic activity. Contrary to our expectation, the adsorbent failed to retain trypsin. Only retardation of trypsin was observed. Trypsin appeared from the column slightly later in comparison with inactive material that passed through the column, which was contained as contaminant in the commercial trypsin preparation. The adsorbent was not strong enough. However, this result was a little promising, because trypsin was in any case separated from the impurities. Meanwhile, because of retardation, the fractions containing active trypsin were too widely spread and diluted. Therefore, we added a dilute HCl solution immediately after the pass-through fractions, intending to accelerate elution of trypsin by weakening its binding ability and recover it in a more concentrated state. This plan, however, did not work. Unexpectedly, trypsin did not appear from the column. This suggested that the affinity adsorbent bound trypsin more tightly when the acidic solution was added. This was due to the fact that the pH in the column did not drop immediately, but decreased gradually, because the column had been previously equilibrated with a buffer solution of pH 8.2. When the pH in the column decreased to around 7, affinity of trypsin for the adsorbent increased, and, consequently, leakage of trypsin stopped. Adsorbed trypsin was recovered by lowering the pH in the column below 4 by addition of a more concentrated HCl solution.3,4)
This finding informed us that the affinity of trypsin towards products (arginine-tailed peptides) becomes stronger at pHs lower than that of the optimum for the catalytic action. Dependence on pH of the affinity of trypsin towards products is not the same as that towards substrates. Later experiments confirmed that binding strength of a product-type compound at pH 7 is about 5 times that at pH 8. This unknown nature of the binding site of trypsin led us to the success by chance. Even the product-type peptides were found effective for the preparation of affinity adsorbent for trypsin if chromatography is carried out at pHs lower than the optimum pH of catalysis. At this point, we noticed the potential of affinity chromatography as an informational tool. The above result provided us with valuable information on the nature of the binding site of trypsin. A possible explanation of this phenomenon is as follows. The active site of trypsin is designed so as to expel the product formed after the hydrolysis of the substrate in order to facilitate entrance of a new substrate. Probably, the negative charge of the newly formed carboxyl group of the product confronts repulsion from a certain negatively charged group residing in the binding site at the optimum pH of catalysis. The effect of this negative charge disappears when environmental pH becomes around 7, either by its protonation or appearance of another positive charge, and the product suffers no more repulsion and can stay on in the binding site. When the environmental pH decreases below 4, the product is released due to the destruction of the conformation of the binding site.
Next, we wondered whether the catalytic activity of trypsin is essential for the binding to AP-Sepharose or not. Therefore, we prepared trypsin derivatives inactivated with active-site directed modification reagents such as DFP (diisopropylfluorophosphate) or TLCK (tosyl-L-lysine chloromethylketone). DFP and TLCK specifically modify Ser183 and His46, which are essential for the catalytic function of trypsin, respectively. Both DFP-trypsin and TLCK-trypsin failed to bind to AP-Sepharose. The results seemed to suggest that the catalytic activity is indispensable for the specific binding. However, there was another possibility to be checked. These modifying reagents introduced bulky groups in the binding pocket. Consequently, there might have been no space for the immobilized ligand (more precisely, the side chain of the arginine moiety) to enter. Further experiments were necessary by using other inactivated trypsin derivatives whose binding pockets are not occupied with bulky modifying groups. We therefore prepared anhydrotrypsin and CAM-trypsin. In anhydrotrypsin, the catalytically essential Ser183 is transformed to dehydroalanine. In CAM-trypsin, the catalytically essential His46 is covalently modified by a small carboxyamidemethyl (CAM) group. These two inactive trypsin derivatives bound to AP-Sepharose. Even if trypsin loses the catalytic activity, the binding pocket is still able to accommodate its specific ligand as far as there remains adequate space. These results showed definitely that the essential residues for catalysis, i.e., Ser183 and His46, are not necessary for the specific binding.5) This means that, in the case of trypsin, the substrate binding site and catalytic site function independently.
2. Establishment of frontal affinity chromatography (FAC) as a tool for study on biorecognition
We were deeply impressed by the above finding, and noticed the potential of affinity chromatography as a new informational tool in biochemistry. Therefore, we decided to stop our project on blood clotting enzymes, and started a new project aimed at affinity chromatography itself, that is, creation of a new research tool for biospecific interaction.6–11) Then, we concentrated on the issue of how to correlate quantitatively chromatographic data with parameters of molecular interaction. We reached this goal introducing a chromatographic mode different from ordinary zonal chromatography, that is, frontal chromatography. Although frontal analysis was not so popular in the field of chromatography, it turned out extremely useful for our purpose because of its advantages from both theoretical and practical viewpoints. Frontal analysis made it possible to treat chromatography as a saturation phenomenon and express the phenomenon by a simple equation equivalent to the Langmuir’s adsorption isotherm and also to the Michaelis-Menten equation. Consequently, it allowed us to obtain parameters necessary for description of molecular interaction, i.e., equilibrium constant and binding capacity.6–11) Frontal affinity chromatography (FAC) of the first generation thus established contributed greatly to our research on different interacting systems.12–16) Results of investigation by FAC on a variety of interacting systems, e.g., enzyme-coenzyme,17) protein-small molecule,18,19) lectin-saccharide,19–22) serum protein-drug,23,24) protein-protein,25) and polysialic acid-neurotransmitter,26) etc., have been reported.
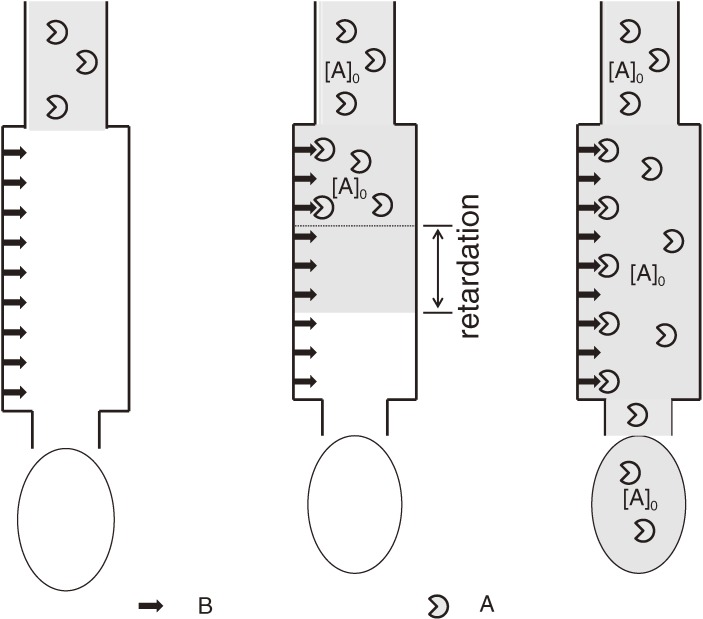
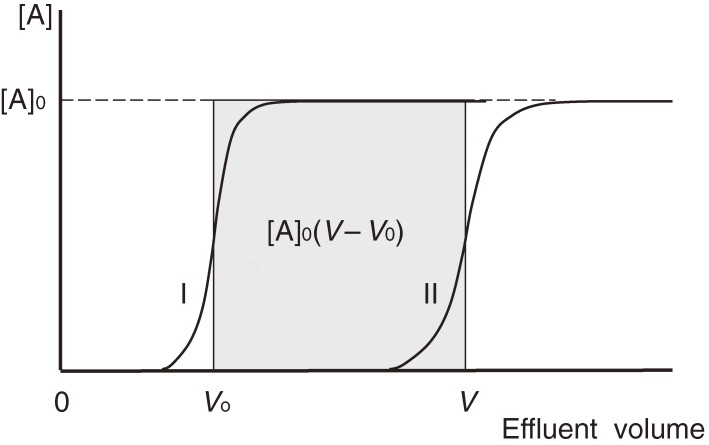
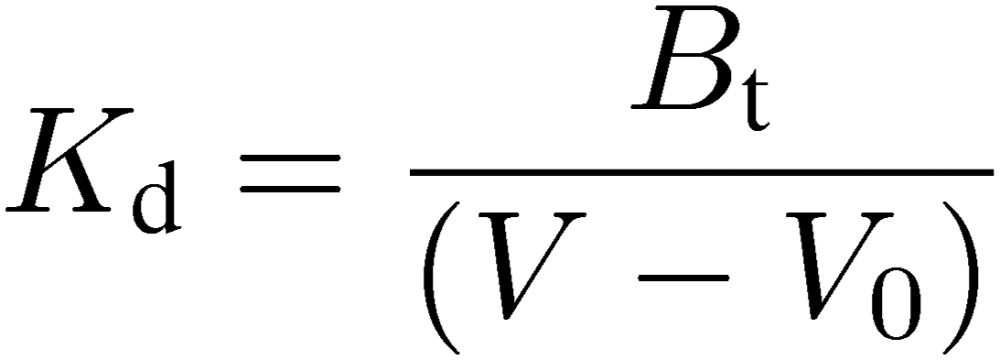
In FAC, a relatively large volume of solution containing a substance for examination (analyte) is applied continuously to a relatively small column packed with affinity adsorbent (Fig. 1). From a practical viewpoint, use of weak affinity adsorbent is essential, because the analyte should be loosely caught, and allowed to leak from the column. In consequence, the elution profile of the analyte is composed of two portions, an elution front and a plateau. The effluent volume where the analyte begins to leak from the column is defined as an elution volume. After the passage through the column, elution of the analyte having affinity for the immobilized ligand is retarded (elution volume: V). In order to evaluate the extent of retardation, an elution pattern of a reference substance that has no affinity for the adsorbent is also examined (elution volume: V0) (Fig. 2). The extent of retardation thus obtained (V − V0) can be related to the equilibrium constant and the capacity of the adsorbent by an equation resembling to the Michaelis-Menten equation (Eq. [3] in section 6). If we apply a very dilute analyte solution, the dissociation constant becomes proportional to the reciprocal of retardation (Eq. [7]). In another word, the binding constant is proportional to the retardation. This unique nature of FAC is extremely advantageous because consumption of the analyte can be reduced as low as possible. In section 6, a more detailed description of the theory is given.
Figure 1.
Schematic representation of frontal affinity chromatography. B: immobilized ligand. A: analyte molecule.
Figure 2.
Elution profiles in frontal affinity chromatography. Curve II is the elution pattern of the analyte, and curve I is that of a reference substance which has no affinity for the adsorbent. [A]0 is the initial concentration of the analyte solution.
We first applied FAC to enzymes, and confirmed that FAC provides essentially the same information as that provided by enzyme kinetics. We were able to collect a lot of information on the nature of the binding sites, e.g., pH dependence, temperature dependence, subsite interaction, and effects of competitive inhibitors, etc.8,10–13) FAC was found to be more advantageous than enzyme kinetics because it made it possible to clarify the binding property of even catalytically inactive enzyme derivatives. This meant that FAC can be used for the elucidation of binding property of non-enzyme proteins. Moreover, FAC was found to be especially advantageous for analysis of weak interactions. Therefore, we focused on its application to saccharide-binding proteins (lectins), because, in 1970’s, few methods that enabled to analyze quantitatively lectin-saccharide interaction existed. This attempt was successful and we finally established a FAC system optimized for lectin profiling.15,16) FAC is now providing a lot of accurate and detailed information on the binding specificities of many lectins and other carbohydrate-binding proteins.
Unique properties of FAC listed below explain the reason why it succeeded in overcoming the difficulties often encountered in the field of glycobiology.
-
1.
Theoretical basis is simple and straightforward because FAC deals with only an equilibrium state (more precisely, dynamic equilibrium state) established between an immobilized ligand and a soluble analyte.
-
2.
Quantification of the complex formed between interacting molecules can be made without disrupting the equilibrium state.
-
3.
FAC is principally suited for analysis of weak interactions because it is based on measurements of the extent of leakage of analyte molecules from the adsorbent in the column. This is completely opposite to almost all currently available methods, which serve mainly for strongly interacting systems.
-
4.
From an operational viewpoint, neither special equipment nor sophisticated skills are required, because the simplest elution mode, isocratic elution, is applied throughout chromatographic run. This contributes greatly to the robustness of the procedure.
-
5.
An accurate elution volume can be determined easily by calculating integrated multiple data, thus minimizing the interference of noise in the measurement of signals and resulting in acquisition of reliable equilibrium constants (Kd or Ka).
-
6.
Once a minimum set of basic parameters for a given column is collected by using an analyte, equilibrium constants for other analytes can be determined without knowing their exact concentrations. This has a significant advantage from an operational viewpoint.
-
7.
Even for a weak interaction, it is unnecessary to raise the concentration of the analyte in order to enhance complex formation and signal intensity. Regardless of binding strength, the analyte concentration can be kept at the lowest level that allows drawing of its elution profile.
-
8.
It is economical because only an ordinary HPLC system present in most laboratories is enough to conduct the experiments.
3. Application of FAC to a study on saccharide-binding property of concanavalin A
As the first step of FAC application to the field of glycobiology, we chose concanavalin A (ConA) contained in jack bean as a target. Plant lectins were widely used even in 1970’s as convenient experimental tools for detection and isolation of glycoconjugates, and for modification of cellular activity (e.g., stimulation of leucocytes), though their true functions were not well understood. Knowledge on their saccharide-binding specificities was rather poor due to lack of appropriate research tools. Methods applicable to non-enzyme proteins in those days, such as equilibrium dialysis and differential spectrum analysis, were practically useless, because they required a large amount of experimental material. Collection of a large amount of a series of saccharides having complex structure from natural sources was unrealistic due to their low abundance and microheterogeneity. We hoped that FAC would overcome this difficulty because it was performable by using a minimum amount of analytes.
Although ConA was widely used as a convenient tool, its sugar-binding specificity was poorly known. Among monosaccharides, D-mannose, D-glucose and N-acetyl-D-glucosamine were known to interact with ConA. This suggested importance of the configulation at C3 and C4 of D-type aldohexoses. Among them, D-mannose showed slightly stronger affinity. Quality of such information, however, was rather low because the data were obtained by a very primitive method, hemagglutination assay. Binding ability of each saccharide was estimated from its inhibition potential on the agglutination of erythrocytes induced by ConA. Numerical data obtained by such experiments are hardly compared to equilibrium constants, which have a well defined physical meaning. Moreover, simple monosaccharides mentioned above could not be regarded as intrinsic counterparts of ConA. When ConA binds to cells such as erythrocytes and lymphocytes, its counterparts should be complex saccharide chains attached to glycoconjugates on cell surface such as glycoproteins, glycolipids, and proteoglycans. Therefore, our ultimate aim was to elucidate the interaction of ConA with these extremely complex and diverse saccharides. When we began our work, only a few papers had appeared that had reported results of works aimed at such a goal, though all the data were rather qualitative.
In order to assess feasibility of FAC in lectin research, we started from experiments with rather simple saccharides. We prepared a weak affinity adsorbent for ConA by immobilizing p-aminophenyl-β-D-glucoside on Sepharose, and measured the extent of retardation of ConA after the passage through a column packed with the adsorbent. The elution profile of ConA was monitored by UV absorption at 280 nm. Next, we examined effects of a series of saccharides on the elution of ConA. The column was first equilibrated with a buffer solution containing one of saccharides, and a solution of ConA containing the same saccharide was applied. If interaction of ConA with the affinity adsorbent is competitively inhibited by the added saccharide, accelerated elution of ConA should be observed. By such a simple experiment, the dissociation constant of the complex between the saccharide and ConA can be determined as an inhibition constant (KI) according to Eq. [11]. Table 1 shows KI values for various saccharides thus obtained. Comparison of binding abilities of different saccharides towards ConA in terms of the equilibrium constant was made possible for the first time.15) Although we do not discuss in detail here, these data provided us with rich information on the mode of saccharide recognition performed by ConA. Evidently, ConA prefers mannose to glucose, and the anomeric configulation of α to that of β. No significant difference was observed for five glucose dimmers. This suggested that ConA recognizes preferentially the non-reducing end saccharide, and the influence of the reducing end saccharide is small.
Table 1.
Binding strength of various saccharides for ConA measured as KI values by FAC. Chromatography was carried out at 5 ℃ with 0.1 M Tris-HCl buffer (pH 7.9) containing 0.1 M NaCl, 1 mM CaCl2, and 1 mM MnCl2
| Compound | KI (mM) |
|---|---|
| D-Glucose | 1.5 |
| D-Mannose | 0.19 |
| N-Acetyl-D-glucosamine | 7.2 |
| Methyl α-D-glucoside | 0.22 |
| Methyl β-D-glucoside | 5.3 |
| Methyl α-D-mannoside | 0.045 |
| p-Nitrophenyl α-D-mannoside | 0.014 |
| Glcα1-1-αGlc | 0.24 |
| Glcα1-2Glc | 0.21 |
| Glcα1-3Glc | 0.34 |
| Glcα1-4Glc | 0.24 |
| Glcα1-6Glc | 0.19 |
| Glcβ1-4Glc | 103 |
| Glcβ1-6Glc | 4.9 |
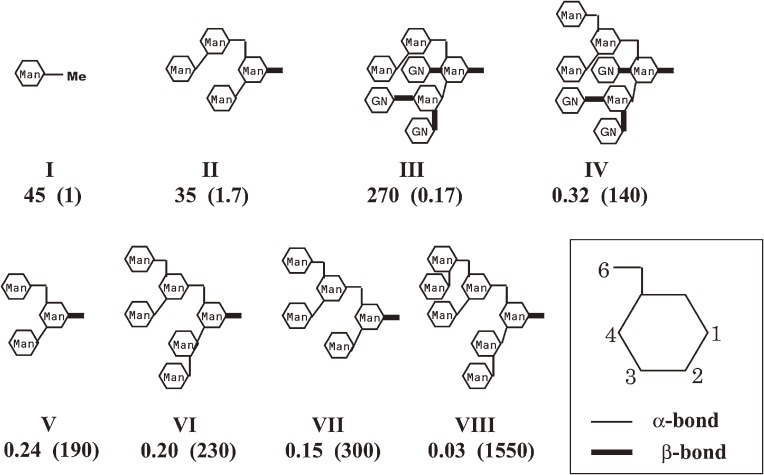
The first trial of FAC application to lectin research was successful. However, our goal was still far because we had to examine saccharides having more complex structure. Therefore, our next step was to do experiments using saccharide chains derived from glycoconjugates. Ovalbumin has a single, mannose rich N-type oligosaccharide chain, whose structure shows extreme diversity in molecule to molecule due to microheterogeneity. Complete digestion of the protein part of ovalbumin gave a mixture of oligosaccharide chains having a single asparagine residue attached to the reducing end N-acetylglucosamine. Such glycoasparagines were separated and purified by chromatography. Each of them was composed of multiple saccharide residues such as mannose, galactose, and N-acetylglucosamine, connected with various types of linkages. They were labeled with tritium by reductive methylation by using NaB[3H]4. In this series of experiments, instead of the competition experiments described above, retardation of saccharides during the passage through an immobilized ConA column was directly measured.16) A part of obtained Kd values are shown in Fig. 3. It was found that the number of mannose residues does not necessarily determine the binding strength. Affinity of the glycoasparagine containing four mannose residues (II) was 100 times weaker than that of the one containing three mannose residues (V). Such apparent discrepancy emphasized the importance of the overall structure.
Figure 3.
Affinity of glycoasparagines (II–VIII) for ConA measured by FAC. I is a reference saccharide, α-methyl-D-mannoside. Dissociation constants (pH 7.4, 4 ℃) are indicated in µM. Values shown in parentheses are relative binding strengths. Man: mannose, GN: N-acetyl-D-glucosamine. Moieties of chitobiose and asparagine are omitted.
The glycoasparagines examined were found to be classified into two groups in terms of the binding strength, that is, a weaker group having Kd values larger than the order of 10 µM and a stronger group having those of less than the order of 0.1 µM. No glycoasparagine having intermediate affinity was found. Apparently, members of the strong group have a common structural unit. They contain a scissors-like trimannose motif composed of three mannose residues, Manα1-3(Manα1-6)-Man (IV, V, VI, and VII). Evidently, the binding site of ConA is made up to accommodate this motif. Examination of members of the weak group revealed more interesting features. Some of them have a certain substitution at this motif (II, III). For example, in the case of II, C3-OH of the mannose residue attached to the central mannose residue with 1–6 linkage is substituted with another mannose residue. On the other hand, substitution at C2-OH of the same mannose residue does not result in weak binding (see VIII). Substitution at C3 seems to be unfavorable, though that at C2 is not the case. This explains why the affinity of II is significantly low in comparison with V.
Such a conclusion was obtained by the experiments done by using a plant lectin and N-linked oligosaccharides of animal origin. Is there any relevance in the experiments done by such an artificial combination? Is there any physiological meaning for the recognition of the trimannose motif by ConA? A possible role of legume lectins seems to prevent animals eating beans. If an animal ingests row beans, contained lectin binds to cell surface saccharide chains of the digestive tract and will induce severe disorder. Then, the animal learns to avoid beans of the same species. ConA may also have a defensive role against infection by microorganisms having mannose-containing saccharide chains on the cell surface. Therefore, ability of legume lectins to bind glycans of organisms belonging to other kingdoms should have biological significance. Meanwhile, it is unlikely that such a defending role was already assigned even at the birth of legume lectins. It is possible that, in the beginning, ConA had some regulatory roles within jack bean plant through interaction with its own N-type glycans, as seen in the case of quality control of glycoproteins in animal cells. During the evolution of the legume, additional roles such as defense and nutrient storage might have been charged to its lectins.
4. Reinforcement of FAC by combination with high-performance liquid chromatography
Application of FAC to the field of glycobiology proved to be promising, because systematic comparison of the binding strength of a series of saccharides towards a lectin was realized for the first time. However, necessity of further improvements was urged, e.g., minimization of consumption of rare oligosaccharides, reduction of running time, and high-throughput data production, etc. Development of high-performance liquid chromatography (HPLC) and computer technology was extremely favorable for our purpose. We were able to take advantage of a miniature column, application of high flow rate, real-time monitoring, and efficient data processing, etc. First, we were inspired by the work of Hindsgaul’s group.27) They made up a high-performance FAC system for screening synthetic compounds on the basis of their affinity for a certain lectin. They immobilized a lectin to small and hard particles, packed them in a miniature column, and send a solution containing multiple synthetic compounds by a high pressure pump. Eluate was then introduced to a LC-MS apparatus for detection of analytes by mass measurement. This procedure allowed simultaneous drawing of multiple elution curves corresponding to each compound, and consequently, efficient determination of Kd values for multiple compounds.
We were pushed by this work, and undertook construction of a reinforced FAC system by ourselves expecting to get a strong tool that promotes our research on galectins. We wished to elucidate sugar-binding specificity of galectins in detail, and finally succeeded in realization of a high-throughput profiling system for not only galectins but also many other carbohydrate-binding proteins.28–33) One of critical factors that led our success was the use of fluorescence-labeled saccharides as analytes. Labeling of saccharides by a pyridylamino (PA) group was developed by Hase’s group,34) and when we started the project, we were able to profit from a big collection of PA-saccharides. This allowed us to minimize consumption of valuable analytes because they were detectable even at extremely low concentrations (e.g., 10 nM). Another merit was that the PA group did not virtually increase hydrophobicity of saccharides. Hydrophobic interaction causes non-specific interaction of analyte molecules with materials composing the HPLC system, such as tubing, column matrix, and flow cell, etc., and therefore, prevents accurate estimation of their retardation.
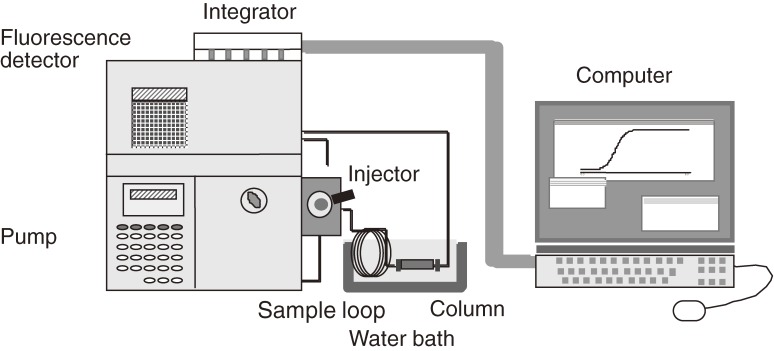
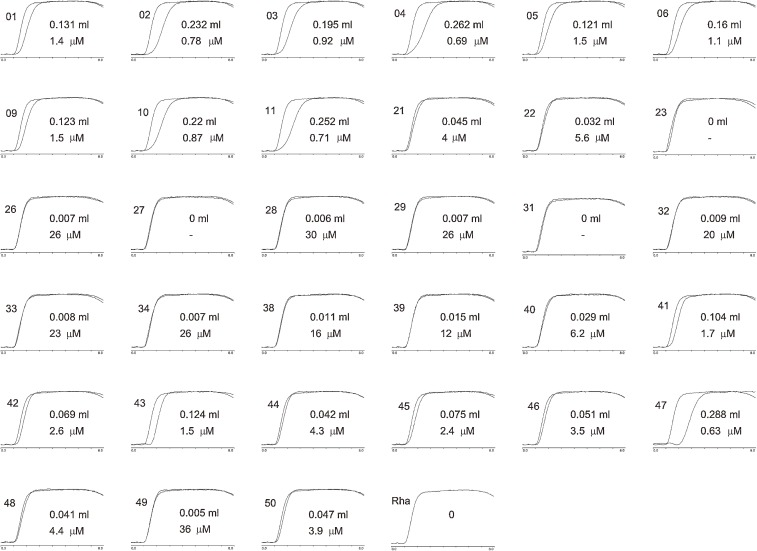
Figure 4 shows a diagram of our high-performance FAC system. It is composed of a pump, an injector connected to a sample loop of a relatively large volume (e.g., 2 ml), a small column (e.g., 4.0 × 10 mm, 126 µl), and a fluorescence detector. Affinity adsorbent was prepared by using specially manufactured fine agarose gel beads tolerable against a high flow rate (HiTrap gel). Since equilibrium is influenced by temperature, the column and the principal part of the sample loop are immersed in a water bath of constant temperature. Analyte solution is sent at a relatively large flow rate (e.g., 0.25 ml/min). After the column is equilibrated with a buffer solution, the analyte solution reserved in the sample loop is applied to the column by switching the flow channel, and elution of the analyte is monitored by a fluorescence detector. Output from the fluorescence detector is treated by a computer and the elution volume is immediately calculated by an algorithm newly formed. Time required for one chromatographic run is usually less than 10 minutes. Since FAC is carried out under an isocratic elution mode, different sample solutions can be applied one by one without washing, regeneration, or re-equilibration of the column. This allowed efficient and high-throughput determination of Kd values for a large number of PA-saccharides. As an example, a set of elution profiles of 34 PA-saccharides from an immobilized human galectin-3 column is shown in Fig. 5. At the beginning, analyte solutions were injected manually to the sample loop one by one. Later, a fully automated system was constructed by Hirabayashi’s group of the National Institute of Advanced Industrial Science and Technology (AIST).
Figure 4.
Schematic representation of a reinforced FAC system.
Figure 5.
An example of profiling of a lectin (human galectin-3). Various PA-saccharides were applied to a column (0.126 ml) packed with an affinity adsorbent having human galectin-3 as immobilized ligand. A solution of each PA-saccharide (2 ml, 10 nM) was applied to the column at a flow rate of 0.25 ml/min at 20 ℃, pH 7.2. Each elution pattern of PA-saccharide was superimposed on that of PA-rhamnose, which has no affinity for the galectin, so that the retardation could be seen. Extent of retardation (ml) and calculated dissociation constant (µM) are indicated in each panel. Since this experiment was carried out by using a set of PA-saccharides different from that shown in Fig. 7, the numbers indicated on the panels do not correspond to those of Fig. 7. Corresponding numbers indicated in Fig. 7 for each of elution patterns showing significant retardation are as follows (numbers in parentheses are those shown in Fig. 7). 01(01), 02(02), 03(03). 04(04), 05(05), 06(06), 09(07), 10(08), 11(09), 21(10), 40(24), 41(26), 42(27), 43(28), 44(29), 45(30), 46(31), 47(32) and 50(38). See ref. 28) for detail.
Recently, various apparatuses for analysis of biospecific interaction, which are based on new principles, e.g., surface plasmon resonance and quartz crystal microbalance, etc., have appeared. Some of them have a merit of providing kinetic information such as rate constants (kON and kOFF) in addition to equilibrium constants. In contrast, FAC can provide only equilibrium constants. This may appear to be a weak point of FAC. However, in terms of sensitivity, no method surpasses FAC. All methods except FAC measure intensity of the signal attributed to complex formation. Therefore, for analysis of a weak interaction, it is inevitable to raise concentrations of interacting molecules in order to enhance formation of the complex. In contrast, analyte concentration can be kept at the lowest level regardless of the magnitude of affinity because FAC needs to measure only the extent of retardation of the analyte. This is the reason why FAC is virtually only one method that enables lectin profiling by using the precious PA-oligosaccharide library.
5. Examples of the contribution of the reinforced FAC to the field of glycobiology
5.1. Profiling of galectins.
Galectins are distributed in animals and fungi, and form a family of lectins that are characterized by binding specificity for β-galactosides and presence of an evolutionarily preserved carbohydrate-recognition domain (CRD).35–43) Eight well conserved amino acids (His44, Asn46, Arg48, Val59, Asn61, Trp68, Glu71, and Arg73; the numbers correspond to those of human galectin-1) are important for saccharide binding. Galectins are classified into three types according to the molecular architecture; namely, proto-, chimera-, and tandem-repeat types. Both proto- and chimera types have one CRD in a polypeptide. The tandem-repeat type has two CRDs in a single polypeptide, each designated as Nh-CRD or Ch-CRD (Nh- and Ch- stand for N-terminal half and C-terminal half, respectively). In some vertebrate species including human, more than 10 galectins have been found. However, presence of galectins in invertebrates had not been shown until we found two galectins, a 32-kDa tandem-repeat type (LEC-1) and a 16-kDa prototype (LEC-6), in the nematode Caenorhabditis elegans.44–47) Phylogenic distance between vertebrates and nematodes is very large. The former belongs to the deuterostomes and the latter to the protostomes, respectively. The animal kingdom is believed to split into these two superfylums about 8 hundred million years ago. Ancestral proteins of the galectin family should have already existed before this event. This presumption was lately confirmed by discoveries of galectins in sponges and mushrooms. Reports suggesting participation of vertebrate galectins in diverse cellular activities are now increasing in number. Nevertheless, true roles of the galectin family remain difficult to understand mainly because of the presence of multiple galectins having similar specificity. We thought that one of important clues is detailed knowledge on their sugar-binding specificities, especially subtle difference between them, and undertook profiling of all galectins so far found; namely, those of mammals, chick, nematode, sponge, and mushroom, by FAC.48)
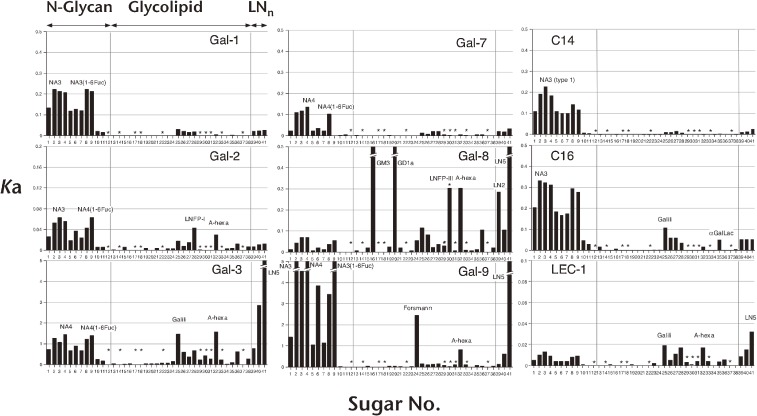
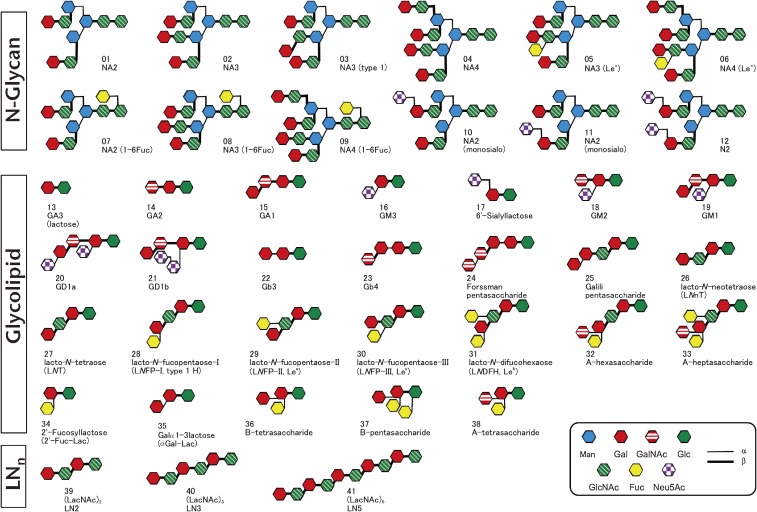
Figure 6 shows an example of the results. The list of PA-saccharides used is shown in Fig. 7. All galectins so far examined were found to have a common feature. They bind saccharide chains containing a disaccharide unit, Galβ1-4GlcNAc (N-acetyllactosamine). Presence of hydroxyl groups of C4 and C6 of Gal, and C3 of GlcNAc were found to be important. Meanwhile, diversity was observed for individual galectins in terms of (1) branching of N-glycans, (2) repeat of N-acetyllactosamine units, or (3) substitutions at C2 or C3 of the non-reducing terminal Gal. Most galectins showed enhanced affinity for branched N-glycans or repeated N-acetyllactosamine units. Some of them exhibited extremely enhanced affinity for either of these multivalent glycans. Some galectins also showed particular preference for α1,2-linked Fuc, α1,3-linked Gal, α1,3-linked GalNAc, or α2,3-linked NeuAc-modified glycans. Vertebrate galectins seem to have evolved their sugar-binding specificity by enhancing affinity for either branched, repeated, or substituted glycans. Selectivity and avidity should have developed in order to enhance affinity of individual galectins for certain types of saccharides by fine-tuning of their ancestral binding sites, and this should have resulted in sharing of a variety of roles in diverse situations.
Figure 6.
Saccharide-binding profiles of 9 galectins revealed by FAC. Bars represent association constants (Ka × 106 M−1) towards PA-saccharides. Structures of PA-saccharides are shown in Fig. 7. Gal-1, -3, -7, -8, and -9 are from human, Gal-2 is from rat, C14 and C16 are from chick, and LEC-1 is from C. elegans.
Figure 7.
Schematic representation of PA-saccharides used in Fig. 6. 1–12: N-glycan, 13–38: glycolipid, and 39–41: oligolactosamine.
In the case of all tandem-repeat-type galectins so far examined, NhCRD and ChCRD were found to have different specificities.49) Tandem-repeat type galectins may have a role as a heterobifunctional cross linker. They seem to crosslink glycoconjugates having saccharide chains of different types, and contribute to construct frameworks necessary for cellular activities, e.g., formation of a microdomain on cell surface. In fact, galectin-4, one of the tandem-repeat types, was found in an extremely insoluble fraction of disrupted mammalian cells, and now is regarded as a raft marker of enterocytes. In contrast, proto-type galectins function as homobifunctional cross-linkers by forming dimers. Chimera-type galectin-3 was implicated to a negative regulator of activation of T cell receptors through binding to poly-N-acetyllactosamine chains on their glycoprotein receptor. Proto-type galectin-1 is reported to induce apoptosis of activated T cells. Although it is still difficult to correlate these observed functions with their binding specificities, the accurate binding profiles should become an essential basis for understanding of the biological meaning of the presence of multiple galectins.
5.2. Profiling of C. elegans galectins.
Shortly after our discovery of two galectins from C. elegans, the genome project of C. elegans was completed. Strikingly, more than 10 genes encoding proteins homologous to galectins were found. These potential galectin genes were designated as lec-1, -2, etc. The firstly discovered C. elegans galectin (tandem-repeat type, 32-kDa)44,45) was the product of lec-1, and designated LEC-1. The second one (proto type, 16-kDa)46) was the product of lec-6, and designated LEC-6. Since we had already characterized saccharide-binding specificities of both LEC-1 and LEC-6, we undertook profiling of all other putative galectins.50) Therefore, we tried to express all of them, and succeeded in producing recombinant proteins from 7 genes (lec-2–4, lec-8–11). All these proteins were found to have affinity for β-galactosides, though that of LEC-8, -9, and -11 were rather weak. All putative genes proved to encode active galectins. This means that C. elegans has also conserved the galectin family for 8 hundred million years. C. elegans galectins retaining strong affinity were found to conserve most of the eight critical amino acid residues, which are indispensable in the case of vertebrate galectins. Those having weak affinity were found to lack some of these residues. Carbohydrate-binding properties of all recombinant C. elegans galectins were investigated by FAC with the same PA-oligosaccharides library mentioned above (Fig. 7), and proved to be essentially similar to those of mammalian galectins (data not shown). (1) All C. elegans galectins recognize the basic disaccharide unit, Galβ1-4GlcNAc. (2) All C. elegans galectins show higher affinities for tri-, and tetraantennary glycans than for biantennary glycans. Similarly, affinity is enhanced as the number of repeats of N-acetyllactosamine increases. (3) Substitutions at C6 of Gal and C3 of GlcNAc of Galβ1-4GlcNAc result in decrease in affinity.
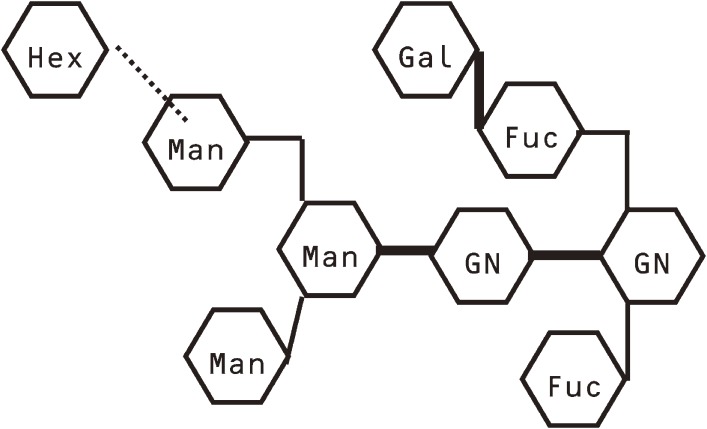
Above results indicated that the sugar-binding properties of C. elegans galectins are similar to those of vertebrate galectins. However, the PA-oligosaccharide library used in this series of experiments did not contain any saccharide derived from C. elegans. The Galβ1-4GlcNAc disaccharide unit, which is the basic recognition unit of vertebrate galectins, has not been found in any glycan of C. elegans. In N-linked saccharide chains of species belonging to protostomes (nematode, squid, and limpets, etc.), galactose residues at the non-reducing ends are known to bind to a fucose residue attaching to the innermost GlcNAc residue via β1-4 linkage. Therefore, an actual recognition unit of C. elegans galectins seemed to be Galβ1-4Fuc, instead of Galβ1-4GlcNAc. We therefore attempted to isolate endogenous ligand oligosaccharides for LEC-6, a prototype galectin of C. elegans.51) First, crude extract of disrupted C. elegans was applied to an immobilized LEC-6 column, and glycans captured by the column was recovered. Saccharide chains of N-glycans were released by hydrazinolysis, and labeled with 2-aminopyridine. The mixture of derived PA-saccharides was again applied to the immobilized LEC-6 column. PA-saccharides adsorbed were recovered and further fractionated by reversed-phase HPLC. We finally obtained 8 purified PA-saccharides and determined their structure by MALDI-TOF MS analysis in conjunction with glycosidase digestion. All of them were found to contain a Gal-Fuc disaccharide unit, which is connected to the innermost GlcNAc residue of the N-glycan chains. The structure of one of them is shown in Fig. 8. Although determination of the type of linkage between Gal and Fuc was not possible because of the limitation of the materials, it is very likely to be β1-4 according to results obtained so far on other species belonging to protostomes. Affinities of these glycans for LEC-6 were measured by FAC. PA-oligosaccharides having the Gal-Fuc unit showed higher affinity than those having Galβ1-4GlcNAc unit. Therefore, although C. elegans galectins can bind vertebrate type N-glycans, their true counterparts are suggested to be those containing the Gal-Fuc unit.
Figure 8.
A proposed structure of an oligosaccharide isolated from C. elegans N-glycans by making use of its strong affinity for C. elegans galectin LEC-6. Its Gal-Fuc disaccharide part seems to serve as the recognition unit of C. elegans galectins. Hex is an unassigned hexose except galactose.
To examine this assumption, we synthesized Galβ1-4Fuc and Galβ1-3Fuc, labeled with pyridylamine and measured their affinity for C. elegans galectins by FAC. Galβ1-4Fuc-PA interacted with LEC-1 more strongly than PA-lactoneotetraose (No. 26 of Fig. 7), which contains one Galβ1-4GlcNAc unit (Kd values at pH 7.2, 20 ℃ were 5.7 × 10⁻⁵ M and 2.1 × 10⁻⁴ M for the former and the latter, respectively). Affinity of Galβ1-3Fuc-PA was lower (Kd: 2.1 × 10⁻⁴ M) than that of Galβ1-4Fuc-PA.52) Similar results were also obtained for LEC-6. These results supported that Galβ1-4Fuc is the proper recognition unit of C. elegans galectins. Binding sites of C. elegans galectins should have been modified during the evolution to accommodate preferentially the disaccharide unit contained in endogenous glycans. This was supported by a crystallographic study of a complex between LEC-6 and Galβ1-4Fuc.53)
5.3. Binding property of intracellular lectins functioning in quality control of newly synthesized glycoproteins.
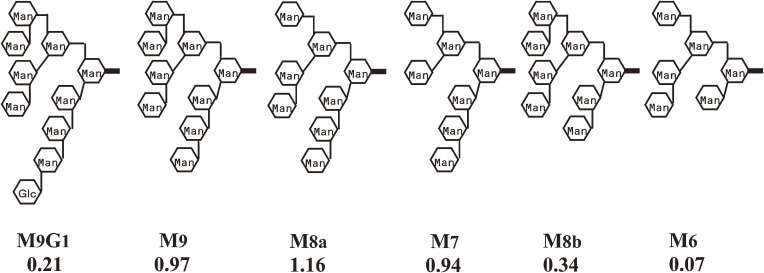
In eukaryote cells, N-linked oligosaccharides contribute to folding, transport, and degradation of glycoproteins through interactions with a variety of intracellular lectins. VIP36 (vesicular integral protein of 36 kDa), which recycles between the Golgi and the endoplasmic reticulum (ER), has an important role in quality control of N-type glycoproteins. When N-type glycoproteins are transported from the ER to the Golgi, VIP36 is thought to act as a cargo receptor. The processing of the N-linked oligosaccharides is initiated in the ER by the removal of glucose residues from the attached Glc3Man9GalNAc2 chain. Mannose trimming is initiated in the ER and continues in the Golgi complex prior to the branching and extension of the saccharide chain. To understand the role of VIP36, its detailed sugar-binding properties were analyzed by FAC.54) Its carbohydrate recognition domain (VIP36CRD) was prepared as a recombinant protein and immobilized on agarose gel beads. A PA-saccharide library, consisting of N-type oligosaccharides in the course of processing, was prepared and subjected to FAC analysis. Comparison of obtained binding constants for these oligosaccharides (Fig. 9) revealed an important feature of VIP36 function. Affinity of oligosaccharide retaining glucose residues (M9G1) was low. This means that VIP36 binds preferentially the glycan chain of N-type glycoprotein after its glucose residues are removed. Affinity of oligosaccharides (M8b and M6) which lost mannose residues from the branch attached to the central mannose by α1-3 linkage (D1 branch) was also low. This indicates the important role of D1 branch for the interaction with VIP36. Effect of pH was also analyzed, and the optimum pH of saccharide binding was found to be around 6.5. VIP36 seems to capture glycoproteins that have failed to remove mannosyl residues from the D1 branch in the cis-Golgi, where pH is about 6.5, then, transport them back to the ER. Since pH of the ER is higher, transported proteins are released, and subjected to reprocessing. VIP36 contributes thereby to the quality control of glycoproteins. The binding property of VIP36 thus revealed helped to understand the molecular function in transport of glycoproteins. Subsequently, detailed sugar-binding properties of other homologous lectins functioning in quality control, VIPL and ERGIC-53, were also revealed by FAC.55) Binding constants obtained by these experiments were at most 104 M−1. Without FAC using PA-oligosaccharides, such detailed information on these weakly interacting systems could not have been obtained.
Figure 9.
Association constants (Ka × 104 M−1) of some N-glycans for VIP36 determined by FAC.
5.4. From FAC to a lectin micro array.
Hirabayashi’s group of AIST constructed a fully automated FAC system, which realized analysis of about 100 PA-saccharides per day.56,57) By the aid of this high-throughput instrument, detailed binding profiles of hundreds of lectins have been collected. The accumulated data are now freely accessible by visiting the database, Lectin Frontier DataBase. They are contributing to both basic and applied fields. For example, on the basis of the data, Hirabayashi’s group developed a new lectin micro array aiming at acquisition of a global view of glycosylaion feature of molecules and cells.58,59) Due to extreme complexity and diversity of glycans, such an approach is very hard by reductive means such as those based on chemistry and physics. Meanwhile, lectins have unique ability to distinguish subtle structural differences among saccharides, e.g., epimers, anomers, and linkage isomers, etc. Therefore, each lectin can be used as a detector for a certain structural feature of glycans. If a set of binding features towards a number of lectins having different specificities is obtained, adequately correct assignment of structure of a complex saccharide is possible. Such a biology-based methodology, which may be called lectin binding spectrum analysis, compensates weak points of chemical and physical approaches. Such a procedure will be useful not only for assignment of a single molecular species but also for acquisition of perspective on a glycosylated state of a complex sample such as cellular extract. Quality of assignment becomes higher as the number of available lectins increases. Therefore, almost 100 lectins whose binding specificities were well characterized by FAC were chosen, and immobilized on a glass plate as small spots. On the array thus prepared, a solution of fluorescence labeled glycan samples was overlaid. Since lectin-glycan interactions are usually rather weak, a detection procedure free from a washing process was essential in order to avoid the loss of weakly bound glycans. Such a requirement was met by evanescent-field activation of fluorescence. The array was illuminated with evanescent light, which covers only a short distance from the glass surface. Accordingly, only the fluorescence labeled glycans bound to the glass surface are excited. By this washing free procedure, simultaneous detection of interactions with about 100 lectins, even that of very week ones, was made possible.58,59) This new system now contributes greatly to glycoscience as a versatile tool for glycomic analysis of biomolecules and cells. FAC, which started from a research on proteolytic enzymes, finally led to the birth of a unique and versatile research tool in glycoscience.
6. Brief description of the theory of FAC
6.1. Accurate determination of an elution volume.
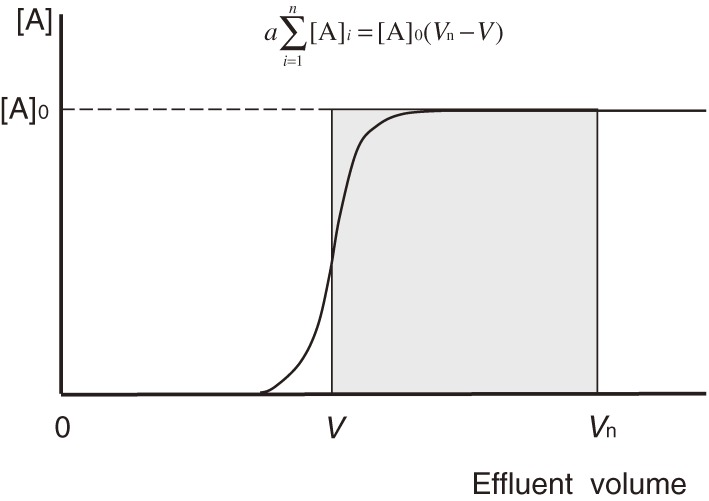
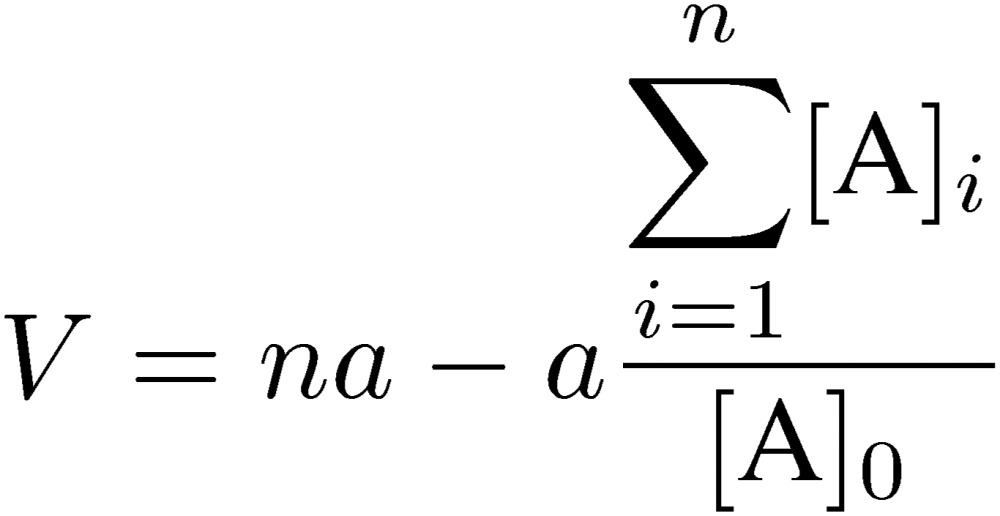
In FAC, an analyte solution of a relatively larger volume than that of the column is applied, and the effluent volume at which the analyte begins to leak (elution volume, V) is measured. Accurate estimation of the elution volume is made possible by this chromatographic mode (Fig. 10). V can be considered as the effluent volume at which a hypothetical boundary of the analyte solution would appear if the boundary was undisturbed in any way, though the analyte appears actually from the column as a shape of a forehead (front). If the shape of the front is symmetric around the midpoint, V can be estimated from the effluent volume corresponding to [A]0/2, where [A]0 is the concentration of the analyte, although it is not often the case. However, even if the shape of the elution curve is not ideal, an accurate V value can be deduced as follows. If the concentration of the analyte is measured constantly by collecting an equal volume of fractions (or monitoring at constant intervals), V can be determined by using the following equation:
 |
[1] |
where a is the volume of one fraction, n is the number of an optionally selected fraction in the plateau region of the elution curve, and [A]i is the concentration of fraction i. As shown in Fig. 10, the area under the elution curve up to fraction n, a∑i=1n[A]i, is equal to that of the rectangle, [A]0(Vn − V). In other words, the calculated V value is the position of the hypothetical elution front if the boundary of the analyte was undisturbed during passage through the column. Although V includes the volume of tubing from the outlet of the column to a fraction collector or a detector, they can be neglected because we only consider the difference from the elution volume of a reference substance having no affinity for the column. In ordinary chromatography, accurate determination of a peak position is not easy especially for a low, broad, and asymmetrical peak. Frontal chromatography, however, allows accurate determination of the elution volume even if the shape of an actual elution front is not ideal due to microscopic non-ideal effects. Calculations are straightforward by using one of the commercially available table calculation software.
Figure 10.
Determination of elution volume (V) in frontal chromatography. The elution volume of an analyte (V) can be determined as the point where the area under the elution curve up to Vn is equal to the rectangle [A]0(Vn − V).
6.2. Basic theory.
In FAC, a relatively large volume of dilute analyte solution is continuously applied to a small column packed with an affinity adsorbent, which contains immobilized ligands (Fig. 1). An important point for success in experiments is that a relatively weak affinity adsorbent that does not tightly bind the target analyte but allows its leakage should be used. An affinity adsorbent unusable for preparative purposes due to its weakness is better for the present analytical purpose. Unlike ordinary zonal chromatography, an elution curve composed of a front area and a plateau region is obtained. Retardation of the analyte (A) having affinity for the immobilized ligand (B) occurs due to interaction during passage through the column. The amount of retarded A is equal to the area surrounded by the two elution curves in Fig. 2: the right curve (II) being that of the analyte and the left curve (I) being that of a reference substance having no affinity for the adsorbent. This area corresponds to the amount of A forming complex with the immobilized ligand in the column, and is equal to the rectangle, [A]0(V − V0), where [A]0 is the initial concentration of A, V is the elution volume of A, and V0 is that of the reference substance. The larger the amount of A bound to B, the larger will be the value of (V − V0). [A]0(V − V0) is equal to “specifically” adsorbed A, from which degree of saturation of B can be deduced. Therefore, it is a function of the dissociation constant (Kd), the amount of B, and [A]0.
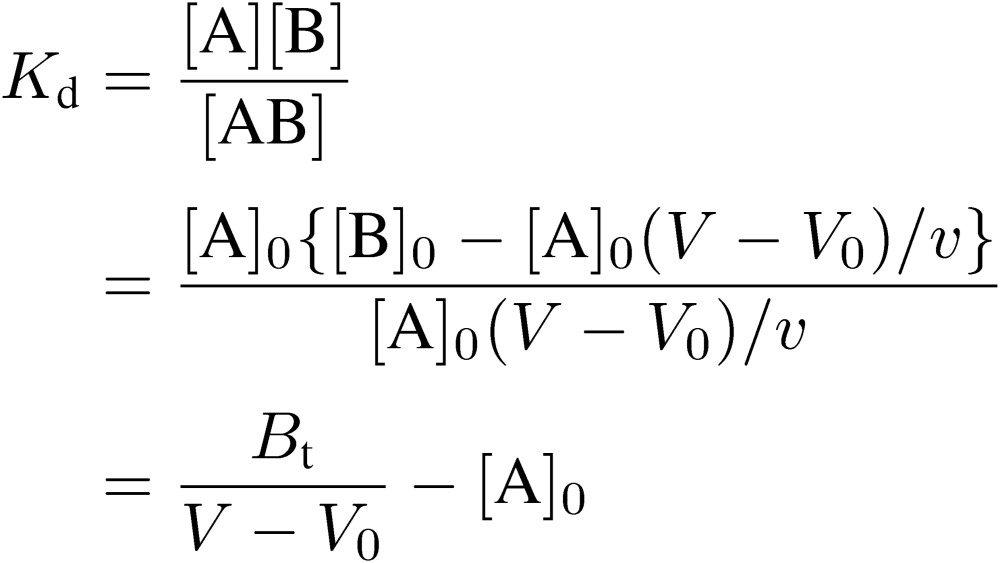
The essential point of the present consideration is how to relate the dissociation constant with the data obtained from chromatographic experiments. Parameters for chromatography are defined as follows: [B]0, amount of immobilized ligand per unit volume (expressed as concentration) of the affinity adsorbent; v, bed volume of the column; Bt, total amount of the immobilized ligand; i.e., v[B]0. Relation between the dissociation constant and chromatographic parameters is as follows:
 |
[2] |
This equation can be rearranged to the following form:
 |
[3] |
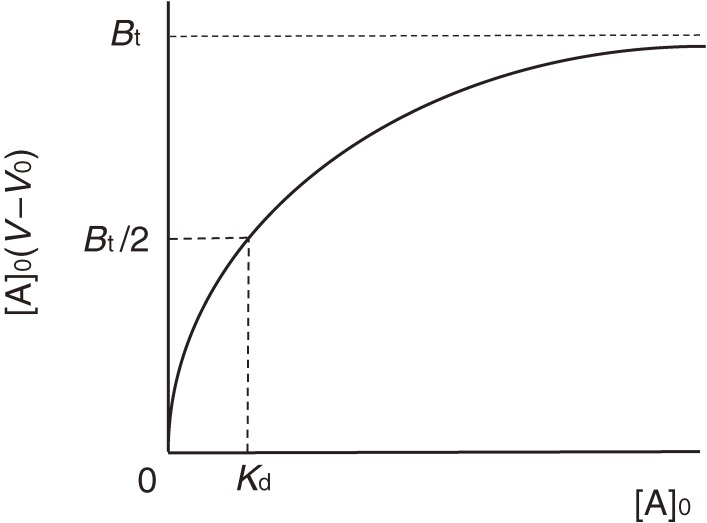
This equation is equivalent to the Michaelis-Menten equation of enzyme kinetics and in principle to the Langmuir’s adsorption isotherm. Equation [3] gives a hyperbolic curve shown in Fig. 11, indicating that the column becomes saturated at the infinite concentration of A. Bt and Kd correspond to the maximum velocity and the Michaelis constant, respectively, and can be determined by using one of linear plots derived from Eq. [3]:
 |
[4] |
This equation corresponds to the Lineweaver-Burk plot of enzyme kinetics. However, the following Woolf-Hofstee-type equation is more practical and straightforward in the case of FAC:
 |
[5] |
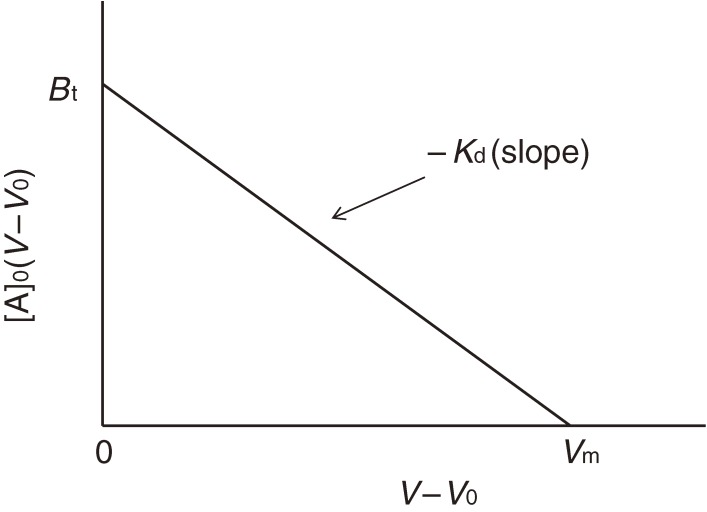
If we apply the analyte changing its concentration, measure V values and make a [A]0(V − V0) vs. (V − V0) plot, the slope and the intercept on the ordinate give −Kd and Bt, respectively (Fig. 12). Bt indicates the amount of immobilized ligand molecules actually retaining binding ability.
Figure 11.
[A]0(V − V0) vs. [A]0 plot. This plot is analogous to the Michaelis-Menten plot. Values of Bt and Kd can be calculated from the coordinates of the two asymptotes of the hyperbola.
Figure 12.
[A]0(V − V0) vs. (V − V0) plot. This plot is analogous to the Woolf-Hofstee plot. The slope gives −Kd, and the intercept on the ordinate is Bt.
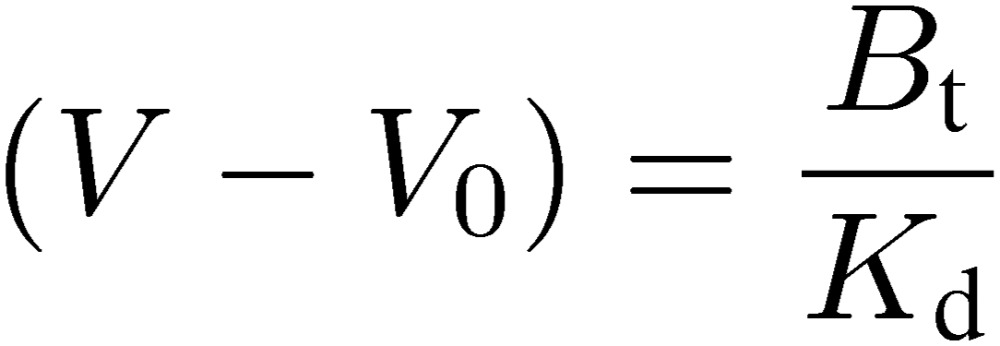
If we apply an extremely dilute analyte solution, in other words, [A]0 is set negligibly low in comparison with Kd, Eq. [3] can be simplified as follows:
 |
[6] |
This indicates that the extent of retardation is proportional to the reciprocal of Kd (i.e., association constant). Therefore, once the Bt value of a given affinity column is obtained by a concentration dependence analysis by using an appropriate analyte, Kd values for other analytes can be determined by only one chromatographic run for each, provided that their concentrations are adequately low (e.g., lower than 1% of Kd).
 |
[7] |
This feature is analogous to enzyme kinetics, i.e.; at low concentrations of the substrate, the reaction rate becomes proportional to the substrate concentration. This provides a great advantage from an experimental viewpoint. It is not necessary to know the correct concentration of the analyte, as in the case of enzyme kinetics in which we need not know the enzyme concentration. Moreover, even for a weakly interacting analyte (having a large Kd), it is unnecessary to raise the concentration of the analyte. This is a great help for researchers because extremely valuable experimental materials will not be wasted.
Now, let us consider aspects concerning chromatography. Equation [8] can be derived from Eq. [5]:
 |
[8] |
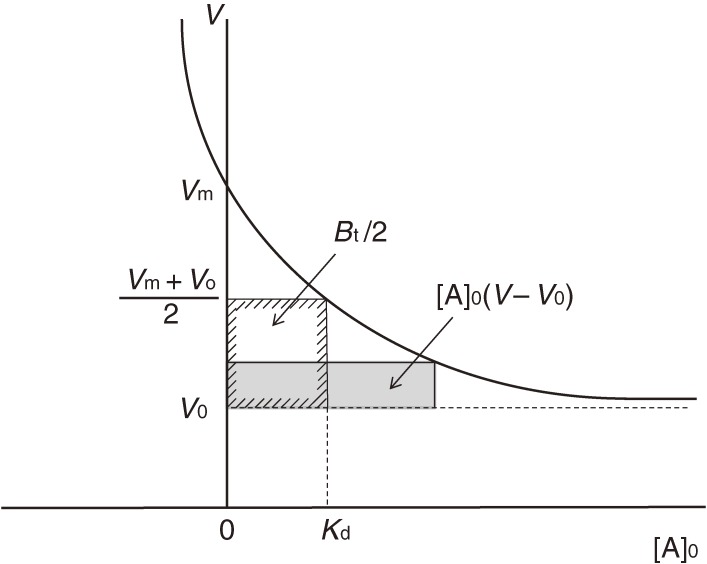
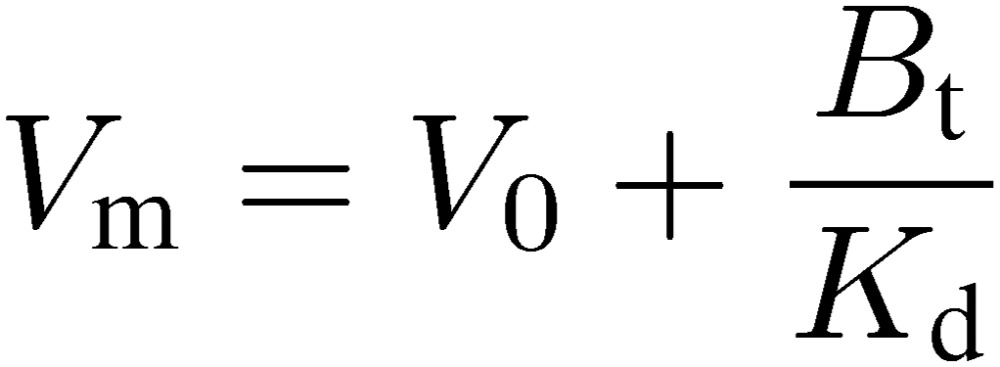
This equation is useful to grasp the fundamental feature of frontal affinity chromatography. A plot of V vs. [A]0 is also a hyperbola and the two asymptotes correspond to −Kd and V0, respectively (Fig. 13). As concentration of the analyte is decreased, extent of retardation increases. If [A]0 is negligibly small compared to Kd, V approaches the maximum value, Vm:
 |
[9] |
Vm becomes apparently independent from [A]0. When [A]0 increases, V becomes smaller. However, V cannot be smaller than V0. Therefore, V0 is considered as the limit of V when [A]0 approaches infinity, i.e., the immobilized ligand becomes saturated. At a certain concentration of [A]0, the amount of adsorbed A corresponds to the area of the gray rectangle in Fig. 13. It is easily seen that when [A]0 = Kd, adsorbed A becomes equal to Bt/2, i.e., half of the maximum capacity, and V becomes (Vm + V0)/2. Therefore, the elution volume varies from Vm to V0 depending on [A]0, and the amount of adsorbed A varies from [A]0(Vm − V0) to Bt.
Figure 13.
V vs. [A]0 plot. Dependency of elution volume on concentration of A. Both elution volume and adsorbed amount can be predicted for a given [A]0, provided that the values of Kd and Bt are known. Vm is defined by Eq. [9].
The reason why V becomes equal to Vm (which is independent of [A]0) is explained as follows. In a region where [A]0 is very small, [A]0(Vm − V0) becomes approximately proportional to [A]0. Therefore, when [A]0 doubles, the amount of adsorbed A also doubles and does not result in any change in V. This is analogous to enzyme kinetics in which velocity is approximately proportional to the substrate concentration if the latter is negligibly small in comparison to the Michaelis constant, Km.
6.3. Effect of a soluble counter-ligand.
Now, let us consider a more complicated situation where a soluble counterpart molecule (I) which binds to A, like a competitive inhibitor for an enzyme, is present. The effect of I on elution of A provides information on the interaction between A and I. To simplify, we consider only limited cases where [A]0 is extremely low, i.e., [A]0 ≪ Kd. In the presence of I, binding of A to the immobilized ligand B is inhibited and the elution volume of A decreases to VI. After the column is equilibrated with a solution of I (to [I]0), A dissolved in the same solution is applied. To simplify, [I]0 is also assumed to be adequately large in comparison to [A]0. Under these conditions, the amount of adsorbed A decreases from [A]0(Vm − V0) to [A]0(VI − V0), and therefore:
 |
[10] |
where KI is dissociation constant of AI complex, and can be calculated by using the following equation:
 |
[11] |
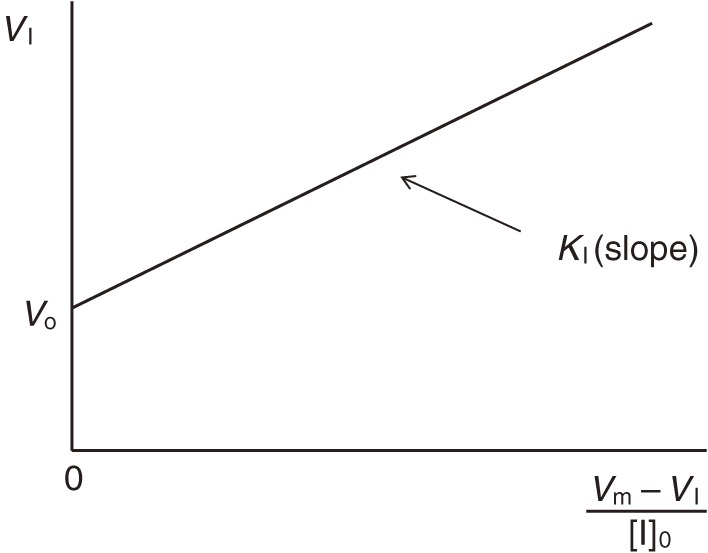
If [I]0 = KI, VI will be the middle of V0 and Vm. For more accurate determination of KI, VI values in the presence of various concentrations of I are measured and analyzed by means of the following equation:
 |
[12] |
A plot of VI vs. (Vm − VI)/[I]0 gives a straight line (Fig. 14). The intercept on the ordinate corresponds to V0 and the slope to KI. It is apparent that VI reached V0 when [I]0 approaches infinity. This means that A becomes saturated with I. This procedure is analogous to the analysis of competitive inhibition in enzyme kinetics. The interaction between A and I is measured indirectly in terms of the decrease in the elution volume, like the decrease in velocity in the case of enzyme kinetics. One of the advantages of this indirect method is that a variety of counter ligands having wide range of KI values can be determined by using a single column. Moreover, this indirect method is not susceptible to non-specific interaction, which often interferes with direct methods.
Figure 14.
VI vs. (Vm − VI)/[I]0 plot. Effect of a counter ligand (I) which binds to A. The dissociation constant of I can be calculated from the slope. This procedure resembles the analysis of competitive inhibition in enzyme kinetics.
6.4. Considerations helpful for preparing affinity adsorbents suitable for FAC.
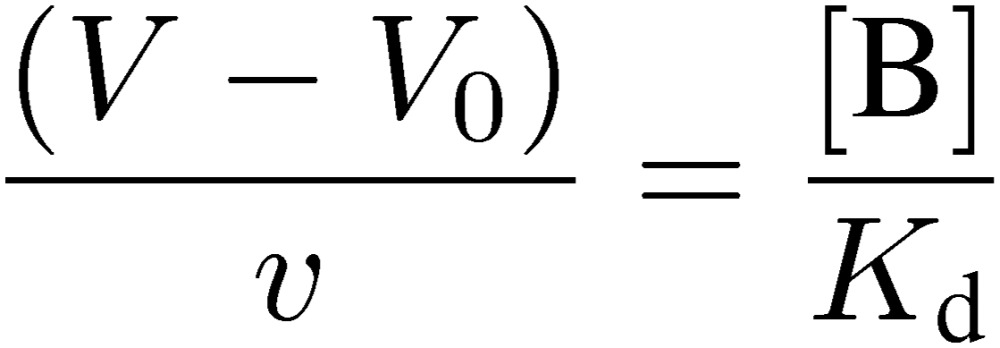
The following equation derived from Eq. [6] is useful for preparation of a suitable affinity adsorbent for FAC, where v is the bed volume of the column and [B] is the concentration of the immobilized ligand:
 |
[13] |
This indicates that the extent of retardation relative to the column volume is equal to the ratio of the concentration of the immobilized ligand and Kd. The right side of the equation also represents the ratio of analyte molecules captured by the immobilized ligand and those allowed to migrate freely ([AB]/[A]). Therefore, if [B] is equal to Kd, analyte molecules will be retarded by 1 column volume because the chance for each analyte molecule to proceed in the column is 50%. If [B] is 10 times Kd, they will be retarded by 10 column volumes because the chance of migration becomes as low as 10%. Practically, for accurate determination of (V − V0), it is desirable that the extent of retardation is kept within the range of 0.1 to 10 column volumes. Therefore, if [B] is equal to Kd, measurement of 0.1–10 times Kd should be possible. If a target protein (e.g., lectin) has a molecular weight of 20,000, [B] of 10−4 M can be attained by immobilizing 2 mg protein on 1 ml of agarose gel (provided that all immobilized protein molecules retain the binding ability). Since the volume of the column used in the reinforced FAC is usually ca. 0.1 ml, the minimum amount of the protein needed will be about 0.2 mg. By using such adsorbent, measurement of affinity of analytes having Kd values between 10−3 and 10−5 M would be possible. If [B] is 10−3 M (20 mg/ml), determination of Kd values as high as 10−2 M would be possible. FAC is not recommendable for the measurement of small Kd values because FAC presumes that a dynamic equilibrium state is maintained in the column. It is necessary for every analyte molecule to repeat the association with the immobilized ligands and the dissociation from them during passage through the column. This, however, is difficult for strongly interacting analytes because they will dissociate too slowly (i.e., having a small kOFF value). From practical viewpoints, merits of FAC seem to be demonstrated for interacting systems having Kd values larger than 10−7 M.
Concluding remark
Application of FAC to the field of glycobiology opened a door leading to deeper understanding of significance of sugar recognition in living systems. Detailed saccharide-binding profiles of a number of lectins and saccharide-binding proteins revealed by FAC not only augmented their utility as a research tool, but also are continuously contributing to elucidation of the role of saccharide recognitions in life.
Acknowledgments
I thank Dr. S. Ishii for providing me with the first idea of both AP-Sepharose and frontal analysis. I also thank all collaborators who made great contribution to the development of FAC, especially Drs. Y. Arata, J. Hirabayashi, Y. Ohyama, Y. Oda, Y. Nemoto-Sasaki, M. Nishikata, and T. Takeuchi.
Abbreviations
- FAC
frontal affinity chromatography
- LC-MS
liquid chromatography-mass spectrometry
- MALDI-TOF MS
matrix-assisted laser desorption/ionization time of flight mass spectrometry
- PA
pyridylamino
- Kd
dissociation constant
- Ka
association constant
- kON
association rate constant
- kOFF
dissociation rate constant
Profile
Kenichi Kasai graduated from the University of Tokyo (Department of Biochemistry and Biophysics, Faculty of Sciences) in 1962. At the graduate school of the University of Tokyo (professor Fujio Egami’s Lab.), he investigated RNase T1. He stayed in Institut de Biologie Physico-chimique in Paris (Dr. Marianne Grunberg-Manago’s Lab.) as French Government Scholarship student during 1964–1966, and investigated a nuclease from sheep kidney. In 1967, he moved to the Faculty of Pharmaceutical Sciences, Hokkaido University (professor Shinichi Ishii’s Lab.) as assistant professor, and studied on various aspects of serine proteases. In the course of this project, he recognized the capacity of affinity chromatography as a tool for elucidation of biorecognition, and established frontal affinity chromatography. He received his Ph. D. from the University of Tokyo by the work on various aspects of affinity chromatography. Then, he expanded application of affinity chromatography to the field of Glycobiology. In 1979, he moved to the Faculty of Pharmaceutical Sciences, Teikyo University as Professor of Biochemistry and started works on animal lectins. His group contributed greatly to the progress of galectin research. Existence of galectins in the nematode Caenorhabditis elegans was demonstrated for the first time by his group, and this led to an extensive study on invertebrate galectins. A variety of other animal lectins were discovered in his group, e.g., snake venom C-type lectin, annelid lectin, and C. elegans C-type lectin, etc. He received Pierce Award from the International Society of Biorecognition in 1997 for the contribution in the area of affinity chromatography and biomolecular recognition. His main scientific interests are specific interaction between biomolecules, e.g., enzyme and substrate, lectin and carbohydrate, etc. He is also interested in creation of analytical procedures for characterization of biomolecules. Examples of new investigative tools developed by his group are frontal affinity chromatography, affinophoresis, slalom chromatography, and capillary affinity electrophoresis. He was nominated as Professor Emeritus of Teikyo University in 2010.
References
- 1).Cuatrecasas P., Wilchek M., Anfinsen C.B. (1968) Selective enzyme purification by affinity chromatography. Proc. Natl. Acad. Sci. 61, 636–643. [DOI] [PMC free article] [PubMed] [Google Scholar]
- 2).Axén R., Porath J., Ernback S. (1967) Chemical coupling of peptides and proteins to polysaccharides by means of cyanogen halides. Nature 214, 1302–1304. [DOI] [PubMed] [Google Scholar]
- 3).Kasai K., Ishii S. (1972) Affinity chromatography of trypsin using a Sepharose derivative coupled with peptides containing L-arginine in carboxyl termini. J. Biochem. 71, 363–366. [DOI] [PubMed] [Google Scholar]
- 4).Kasai K., Ishii S. (1975) Affinity chromatography of trypsin and related enzymes. I. Preparation and characterization of an affinity adsorbent containing tryptic peptides from protamine as ligands. J. Biochem. 78, 653–662. [DOI] [PubMed] [Google Scholar]
- 5).Kasai K., Ishii S. (1973) Unimportance of histidine and serine residues of trypsin in the substrate binding function proved by affinity chromatography. J. Biochem. 74, 631–633. [DOI] [PubMed] [Google Scholar]
- 6).Kasai K., Ishii S. (1975) Quantitative analysis of affinity chromatography of trypsin. A new technique for investigation of protein-ligand interaction. J. Biochem. 77, 261–264. [PubMed] [Google Scholar]
- 7).Kumazaki T., Kasai K., Ishii S. (1976) Affinity chromatography of trypsin and related enzymes. II. An affinity adsorbent containing glycylglycyl-L-arginine. J. Biochem. 79, 749–755. [DOI] [PubMed] [Google Scholar]
- 8).Nishikata M., Kasai K., Ishii S. (1977) Affinity chromatography of trypsin and related enzymes. IV. Quantitative comparison of affinity adsorbents containing various arginine peptides. J. Biochem. 82, 1475–1484. [DOI] [PubMed] [Google Scholar]
- 9).Kasai K., Oda Y., Nishikata M., Ishii S. (1986) Frontal affinity chromatography. Theory for its application to studies on specific interaction of biomolecules. J. Chromatogr. 376, 33–47. [DOI] [PubMed] [Google Scholar]
- 10).Kasai K., Ishii S. (1978) Affinity chromatography of trypsin and related enzymes. V. Basic studies of quantitative affinity chromatography. J. Biochem. 84, 1051–1060. [DOI] [PubMed] [Google Scholar]
- 11).Kasai K., Ishii S. (1978) Studies on the interaction of immobilized trypsin and specific ligands by using quantitative affinity chromatography. J. Biochem. 84, 1061–1069. [DOI] [PubMed] [Google Scholar]
- 12).Kazama M., Tahara C., Abe T., Kasai K. (1988) Quantitative analysis of fibrin-binding affinity of fibrinolytic components by frontal affinity chromatography. Thromb. Res. Suppl. 8, 81–90. [DOI] [PubMed] [Google Scholar]
- 13).Kasai K., Sakurai R., Ishii S. (1994) Frontal affinity chromatography using micro columns as investigative tools for molecular recognition. Int. J. Bio-Chromatogr. 1, 83–91. [Google Scholar]
- 14).Kasai K. (1992) Trypsin and affinity chromatography. J. Chromatogr. 597, 3–18. [DOI] [PubMed] [Google Scholar]
- 15).Oda Y., Kasai K., Ishii S. (1981) Studies on the specific interaction of concanavalin A and saccharides by affinity chromatography. Application of quantitative affinity chromatography to a multivalent system. J. Biochem. 89, 285–296. [DOI] [PubMed] [Google Scholar]
- 16).Ohyama Y., Kasai K., Nomoto H., Inoue Y. (1985) Frontal affinity chromatography of ovalbumin glycoasparagines on a concanavalin A-Sepharose column. A quantitative study of the binding specificity of the lectin. J. Biol. Chem. 260, 6882–6887. [PubMed] [Google Scholar]
- 17).Brinkworth R.I., Masters C.J., Winzor D.J. (1975) Evaluation of equilibrium constants for the interaction of lactate dehydrogenase isoenzymes with reduced nicotinamide-adenine dinucleotide by affinity chromatography. Biochem. J. 151, 631–636. [DOI] [PMC free article] [PubMed] [Google Scholar]
- 18).Christensen U. (1984) The AH-site of plasminogen and two C-terminal fragments. A weak lysine-binding site preferring ligands not carrying a free carboxylate function. Biochem. J. 223, 413–421. [DOI] [PMC free article] [PubMed] [Google Scholar]
- 19).Liu Y.C., Ledger R., Stellwagen E. (1984) Quantitative analysis of protein: immobilized dye interaction. J. Biol. Chem. 259, 3796–3799. [PubMed] [Google Scholar]
- 20).Matsumoto I., Jimbo A., Mizuno Y., Seno N., Jeanloz R.W. (1983) Purification and characterization of potato lectin. J. Biol. Chem. 258, 2886–2891. [PubMed] [Google Scholar]
- 21).Sueyoshi S., Tsuji T., Osawa T. (1988) Carbohydrate-binding specificities of five lectins that bind to O-Glycosyl-linked carbohydrate chains. Quantitative analysis by frontal-affinity chromatography. Carbohydr. Res. 178, 213–224. [DOI] [PubMed] [Google Scholar]
- 22).Reddy S.T., Chai W., Childs R.A., Page J.D., Feizi T., Dahms N.M. (2004) Identification of a low affinity mannose 6-phosphate-binding site in domain 5 of the cation-independent mannose 6-phosphate receptor. J. Biol. Chem. 279, 38658–38667. [DOI] [PubMed] [Google Scholar]
- 23).Nakano N.I., Shimamori Y., Yamaguchi S. (1980) Mutual displacement interactions in the binding of two drugs to human serum albumin by frontal affinity chromatography. J. Chromatogr. 188, 347–356. [DOI] [PubMed] [Google Scholar]
- 24).Loun B., Hage D.S. (1992) Characterization of thyroxine-albumin binding using high-performance affinity chromatography. I. Interactions at the warfarin and indole sites of albumin. J. Chromatogr. 579, 225–235. [PubMed] [Google Scholar]
- 25).Kumagai H., Nishida E., Sakai H. (1982) The interaction between calmodulin and microtubule proteins. IV. Quantitative analysis of the binding between calmodulin and tubulin dimer. J. Biochem. 91, 1329–1336. [DOI] [PubMed] [Google Scholar]
- 26).Isomura R., Kitajima K., Sato C. (2011) Structural and functional impairments of polysialic acid by a mutated polysialyltransferase found in schizophrenia. J. Biol. Chem. 286, 21535–21545. [DOI] [PMC free article] [PubMed] [Google Scholar]
- 27).Zhang B., Palcic M.M., Mo H., Goldstein I.J., Hindsgaul O. (2001) Rapid determination of the binding affinity and specificity of the mushroom Polyporus squamosus lectin using frontal affinity chromatography coupled to electrospray mass spectrometry. Glycobiology 11, 141–147. [DOI] [PubMed] [Google Scholar]
- 28).Hirabayashi J., Arata Y., Kasai K. (2000) Reinforcement of frontal affinity chromatography for effective analysis of lectin-oligosaccharide interactions. J. Chromatogr. 890, 261–271. [DOI] [PubMed] [Google Scholar]
- 29).Arata Y., Hirabayashi J., Kasai K. (2001) Application of reinforced frontal affinity chromatography and advanced processing procedure to the study of the binding property of a Caenorhabditis elegans galectin. J. Chromatogr. 905, 337–343. [DOI] [PubMed] [Google Scholar]
- 30).Hirabayashi J., Arata Y., Kasai K. (2003) Frontal affinity chromatography as a tool for elucidation of sugar recognition properties of lectins. Methods Enzymol. 362, 353–368. [DOI] [PubMed] [Google Scholar]
- 31).Shoji H., Ikenaka K., Nakakita S., Hayama K., Hirabayashi J., Arata Y., Kasai K., Nishi N., Nakamura T. (2005) Xenopus galectin-VIIa binds N-glycans of members of the cortical granule lectin family (xCGL1 and xCGL2). Glycobiology 15, 709–720. [DOI] [PubMed] [Google Scholar]
- 32).Itakura Y., Nakamura-Tsuruta S., Kominami J., Sharon N., Kasai K., Hirabayashi J. (2007) Systematic comparison of oligosaccharide specificity of Ricinus communis agglutinin 1 and Erythrina lectins: a search by frontal affinity chromatography. J. Biochem. 142, 459–469. [DOI] [PubMed] [Google Scholar]
- 33).Kawsar S.M.A., Takeuchi T., Kasai K., Fujii Y., Matsumoto R., Yasumitsu H., Ozeki Y. (2009) Glycan-binding profile of a D-galactose binding lectin purified from the annelid, Perineresis nuntia ver. vallata. Comp. Biochem. Physiol. B Biochem. Mol. Biol. 152, 382–389. [DOI] [PubMed] [Google Scholar]
- 34).Hase S., Ibuki T., Ikenaka T. (1984) Reexamination of the pyridylamination used for fluorescence labeling of oligosaccharides and its application to glycoproteins. J. Biochem. 95, 197–203. [DOI] [PubMed] [Google Scholar]
- 35).Hirabayashi J., Kasai K. (1993) The family of metazoan β-galactoside-binding lectin: Structure, function and molecular evolution. Glycobiology 3, 297–304. [DOI] [PubMed] [Google Scholar]
- 36).Hirabayashi J., Kasai K. (1996) Galectins: A family of animal lectins that decipher glycocodes. J. Biochem. 119, 1–8. [DOI] [PubMed] [Google Scholar]
- 37).Oyama Y., Hirabayashi J., Oda Y., Ohno S., Kawasaki H., Suzuki K., Kasai K. (1986) Nucleotide sequence of chick 14 K β-galactoside-binding lectin mRNA. Biochem. Biophys. Res. Commun. 134, 51–56. [DOI] [PubMed] [Google Scholar]
- 38).Hirabayashi J., Kawasaki H., Suzuki K., Kasai K. (1987) Complete amino acid sequence of 14-kDa β-galactoside-binding lectin of chick embryo. J. Biochem. 101, 775–787. [DOI] [PubMed] [Google Scholar]
- 39).Ohyama Y., Kasai K. (1988) Isolation and characterization of the chick 14 K β-galactoside-binding lectin gene. J. Biochem. 104, 173–177. [DOI] [PubMed] [Google Scholar]
- 40).Hirabayashi J., Ayaki H., Soma G., Kasai K. (1989) Production and purification of a recombinant human 14 kDa β-galactoside-binding lectin. FEBS Lett. 250, 161–165. [DOI] [PubMed] [Google Scholar]
- 41).Sakakura Y., Hirabayashi J., Oda Y., Ohyama Y., Kasai K. (1990) Structure of chicken 16-kDa β-galactoside-binding lectin. J. Biol. Chem. 265, 21573–21579. [PubMed] [Google Scholar]
- 42).Hirabayashi J., Kasai K. (1991) Effect of amino acid substitution by site-directed mutagenesis on the carbohydrate recognition and stability of human 14-kDa β-galactoside-binding lectin. J. Biol. Chem. 266, 23648–23653. [PubMed] [Google Scholar]
- 43).Hirabayashi J., Kasai K. (1994) Further evidence by site-directed mutagenesis that conserved hydrophilic residues form a carbohydrate-binding site of human galectin-1. Glycoconj. J. 11, 437–442. [DOI] [PubMed] [Google Scholar]
- 44).Hirabayashi J., Satoh M., Ohyama Y., Kasai K. (1992) Purification and characterization of β-galactoside-binding proteins from Caenorhabditis elegans. J. Biochem. 111, 553–555. [DOI] [PubMed] [Google Scholar]
- 45).Hirabayashi J., Satoh M., Kasai K. (1992) Evidence that Caenorhabditis elegans 32-kDa β-galactoside-binding protein is homologous to vertebrate β-galactoside-binding lectins. cDNA cloning and deduced amino acid sequence. J. Biol. Chem. 267, 15485–15490. [PubMed] [Google Scholar]
- 46).Hirabayashi J., Ubukata T., Kasai K. (1996) Purification and molecular characterization of a novel 16-kDa galectin from the nematode Caenorhabditis elegans. J. Biol. Chem. 271, 2497–2505. [DOI] [PubMed] [Google Scholar]
- 47).Arata Y., Akimoto Y., Hirabayashi J., Kasai K., Hirano H. (1996) An immunohistochemical study of the 32-kDa galectin in the nematode Caenorhabditis elegans. Histochem. J. 28, 201–207. [DOI] [PubMed] [Google Scholar]
- 48).Hirabayashi J., Hashidate T., Arata Y., Nishi N., Nakamura T., Hirashima M., Urashima T., Oka T., Futai M., Muller W.E., Yagi F., Kasai K. (2002) Oligosaccharide specificity of galectins: a search by frontal affinity chromatography. Biochim. Biophys. Acta 1572, 232–254. [DOI] [PubMed] [Google Scholar]
- 49).Arata Y., Hirabayashi J., Kasai K. (2001) Sugar-binding properties of the two lectin domains of the tandem repeat-type galectin LEC-1 (N32) of Caenorhabditis elegans. Detailed analysis by an improved frontal affinity chromatography method. J. Biol. Chem. 276, 3068–3077. [DOI] [PubMed] [Google Scholar]
- 50).Nemoto-Sasaki Y., Hayama K., Ohya H., Arata Y., Kato-Kaneko M., Saitoh N., Hirabayashi J., Kasai K. (2008) Caenorhabditis elegans galectin LEC-1–LEC-11: Structural features and sugar-binding properties. Biochim. Biophys. Acta 1780, 1131–1142. [DOI] [PubMed] [Google Scholar]
- 51).Takeuchi T., Hayama K., Hirabayashi J., Kasai K. (2008) Caenorhabditis elegans N-glycans containing a Gal-Fuc disaccharide unit linked to the innermost GlcNAc residue are recognized by C. elegans galectin LEC-6. Glycobiology 18, 882–890. [DOI] [PubMed] [Google Scholar]
- 52).Takeuchi T., Nishiyama K., Sugiura K., Takahashi M., Yamada A., Kobayashi S., Takahashi H., Natsugari H., Kasai K. (2009) Caenorhabditis elegans galectins LEC-6 and LEC-1 recognizes a chemically synthesized Galβ1-4Fuc disaccharide unit which is present in Protostomia glycoconjugates. Glycobiology 19, 1503–1510. [DOI] [PubMed] [Google Scholar]
- 53).Makyio H., Takeuchi T., Tamura M., Nishiyama K., Takahashi H., Natsugari H., Arata Y., Kasai K., Yamada Y., Wakatsuki S., Kato R. (2013) Structural basis of preferential binding of fucose-containing saccharide by the Caenorhabditis elegans galectin LEC-6. Glycobiology 23, 797–805. [DOI] [PubMed] [Google Scholar]
- 54).Kamiya Y., Yamaguchi Y., Takahashi N., Arata Y., Kasai K., Ihara Y., Matsuo I., Ito Y., Yamamoto K., Kato K. (2005) Sugar-binding properties of VIP36, an intracellular animal lectin operating as a cargo receptor. J. Biol. Chem. 280, 37178–37182. [DOI] [PubMed] [Google Scholar]
- 55).Kamiya Y., Kamiya D., Yamamoto K., Nyfeler B., Hauri H.P., Kato K. (2008) Molecular basis of sugar recognition by the human L-type lectins ERGIC-53, VIPL, and VIP36. J. Biol. Chem. 283, 1857–1861. [DOI] [PubMed] [Google Scholar]
- 56).Nakamura-Tsuruta S., Uchiyama N., Hirabayashi J. (2006) High-throughput analysis of lectin-oligosaccharide interactions by automated frontal affinity chromatography. Methods Enzymol. 415, 311–325. [DOI] [PubMed] [Google Scholar]
- 57).Tateno H., Nakamura-Tsuruta S., Hirabayashi J. (2007) Frontal affinity chromatography: sugar-protein interactions. Nat. Protoc. 2, 2529–2537. [DOI] [PubMed] [Google Scholar]
- 58).Kuno A., Uchiyama N., Koseki-Kuno S., Ebe Y., Takashima S., Yamada M., Hirabayashi J. (2005) Evanescent-field fluorescence-assisted lectin microarray: a new strategy for glycan profiling. Nat. Methods 2, 851–856. [DOI] [PubMed] [Google Scholar]
- 59).Uchiyama N., Kuno A., Koseki-Kuno S., Ebe Y., Horio K., Yamada M., Hirabayashi J. (2006) Development of a lectin microarray based on an evanescent-field fluorescence principle. Methods Enzymol. 415, 341–351. [DOI] [PubMed] [Google Scholar]


