

Summary
The lack of in vitro prostate cancer models that recapitulate the diversity of human prostate cancer has hampered progress in understanding disease pathogenesis and therapy response. Using a 3D “organoid” system, we report success in long-term culture of prostate cancer from biopsy specimens and circulating tumor cells. The first seven fully characterized organoid lines recapitulate the molecular diversity of prostate cancer subtypes, including TMPRSS2-ERG fusion, SPOP mutation, SPINK1 overexpression and CHD1 loss. Whole exome sequencing shows a low mutational burden, consistent with genomics studies, but with mutations in FOXA1 and PIK3R1, as well as of DNA repair and chromatin modifier pathways that have been reported in advanced disease. Loss of p53 and RB tumor suppressor pathway function are the most common feature shared across the organoid lines. The methodology described here should enable the generation of a large repertoire of patient-derived prostate cancer lines amenable to genetic and pharmacologic studies.
Introduction
The discovery of molecular biomarkers of drug sensitivity is paramount for the precision treatment of cancer patients. As exemplified by gefitinib in non-small cell lung cancer, many drugs can lead to extraordinary responses in small subset of patients, which when left unidentified, result in negative clinical trials (Thatcher et al., 2005). In vitro cell lines, with the capacity for unlimited growth, amenability to high throughput screening and in vivo testing as xenografts have been an important resource in the identification of predictors of response and resistance mechanisms (Druker et al., 1996; Solit et al., 2006). Large-scale screens of cancer cell line panels that integrates genomic profiles with sensitivity to large number of compounds can identify drugs active in specific genetic contexts that might otherwise be missed (Barretina et al., 2012; Garnett et al., 2012). Early results from these studies suggest that genetic alterations and cell lineage are important determinants of drug sensitivity. Therefore, a large number of cell lines are required to study each specific lineage.
Prostate cancer is the most common malignancy and the second most common cause of cancer death in Western men. Despite its prevalence, prostate cancer has proven very difficult to propagate in vitro and is highly underrepresented with only 7 cell lines among ∼1000 cancer cell lines in public repositories (Horoszewicz et al., 1983; Kaighn et al., 1978; Korenchuk et al., 2001; Mertz et al., 2007; Navone et al., 1997; Sramkoski et al., 1999). Recent advances in genomics technology have generated a catalog of genetic lesions that underlie prostate tumorigenesis (Baca et al., 2013; Barbieri et al., 2012; Taylor et al., 2010), many of which (e.g., SPOP mutation, FOXA1 mutation, CHD1 loss) are not represented in available cell lines. Furthermore, in castration-resistant prostate cancer (CRPC) where the immense selection pressure of therapy can lead to significantly increased heterogeneity (Grasso et al., 2012), a large repository of CRPC lines would be required to represent different mechanisms of resistance.
We sought to generate in vitro models of prostate cancer derived from contemporary patients that represent the spectrum of those undergoing treatment for the disease. We have defined growth conditions for small intestine, large intestine, pancreas, and liver where single epithelial stem cells form organoids that recapitulate the tissue histology and lineage hierarchy in vitro (Barker et al., 2010; Huch et al., 2013a; Huch et al., 2013b; Sato et al., 2009). In the accompany manuscript (Karthaus et. al. 2014), we developed conditions optimized for continuous propagation of both normal human basal and luminal prostate epithelial cells. Using these prostate specific conditions, we report success in the generation and detailed molecular characterization of seven human-derived prostate cancer organoid lines derived from diverse disease sites including circulating tumor cells. These lines harbor copy number signatures of primary prostate cancer, including SPOP mutation, PTEN loss, TMPRSS2-ERG interstitial deletion, as well as alterations commonly found in CRPC including TP53, PIK3R1, FOXA1 and several chromatin modifier mutations. Further, the organoid lines recapitulate the phenotypic diversity of CRPC, including AR-dependent adenocarcinoma, AR-negative adenocarcinoma, neuroendocrine carcinoma, and squamous differentiation. Importantly, these lines are amenable to drug testing in vitro and in vivo.
Results
We plated prostate cancer metastasis samples, freshly collected by tissue biopsy and confirmed by pathology review to have >10% tumor cell content, into prostate organoid culture and established organoid lines from six patients that have been continuously propagated for > 6 months. A seventh organoid line was established from circulating tumor cells (CTCs) of a CRPC patient with a high CTC count (>100 cells per 8 mL of blood). The clinical characteristics and prognostic variables (Smaletz et al., 2002) of the seven patients span the spectrum of advanced prostate cancer (Table 1).
Table 1. Patient and Organoid Characteristics.
| Name | Tissue Site | Tissue Studies | Organoid Studies |
Doubling Time | Prior Therapy | KPS | HGB (g/dL) |
ALB (g/dL) |
PSA (ng/dL) |
ALP (U/L) | LDH (U/L) |
|---|---|---|---|---|---|---|---|---|---|---|---|
| MSK-PCa1 | L2 Vetebral Body | WES of FFPE archival pelvic lymph node | WES, RNA-Seq, array-CGH | 3 days | ADT, bicalutamide | 90% | 13.1 | 4.8 | < 0.05 | 56 | 190 |
| MSK-PCa2 | Acetabulum | WES, RNA-Seq of matched tumor | WES, RNA-Seq, array-CGH | 3 days | ADT, bicalutamide | 60% | 10.4 | 4 | 8.71 | 134 | 175 |
| MSK-PCa3 | Retroperitoneal lymph node | n/a | WES, RNA-Seq, array-CGH | 1 week | ADT, bicalutamide, docetaxel, carboplatin | 80% | 10.7 | 4.5 | 0.08 | 112 | 154 |
| MSK-PCa4 | Pleural Effusion | n/a | WES, RNA-Seq, array-CGH | 2 weeks | ADT, bicalutamide, docetaxel | 50% | 9.4 | 2.8 | 0.94 | 69 | 222 |
| MSK-PCa5 | Circulating tumor cells | WES of FFPE archival pelvic lymph node | WES, RNA-Seq, array-CGH | 1 week | ADT, bicalutamide, abiraterone acetate | 60% | 8.4 | 3.9 | 180 | 2402 | 452 |
| MSK-PCa6 | Salvage prostatectomy | RNA-Seq of matched tumor | WES, RNA-Seq, array-CGH | 5 days | ADT, bicalutamide | 80% | 12.3 | 4 | <0.05 | 67 | 249 |
| MSK-PCa7 | Retroperitoneal lymph node | WES, RNA-Seq of matched tumor | WES, RNA-Seq, array-CGH | 3 weeks | None | 90% | 16.2 | 4.7 | 3.87 | 199 | 114 |
In our hands, the efficiency for establishing continuously propagated organoid lines from metastatic biopsies was ∼15-20% (6 lines from 32 “attempts” of cancer bearing samples) and could presumably be improved by further optimization of growth conditions. It is worth noting that tumor organoids were reproducibly maintained for 1-2 months for ∼70% of soft tissue tumor biopsies and ∼30% of bone biopsy biopsies, but many of these tumor cultures were overtaken by tumor-associated spindle cells or normal epithelial cells present in the biopsy material. For example, two continuously proliferating organoid lines derived from liver and lung metastases had no copy number alterations and no mutations of 50 common cancer associated genes (not shown), which we interpret as more consistent with the lines originating from normal liver or lung epithelial cells rather than from prostate cancer. Indeed, others have reported that the growth conditions used here are broadly conducive to growth of multiple normal epithelial cell types (Barker et al., 2010; Huch et al., 2013a; Huch et al., 2013b; Sato et al., 2009). Strategies to selectively isolate tumor from the normal epithelial and stromal cells present in biopsies might overcome this problem. In addition, evaluation of other conditions to improve primary epithelial growth such as co-culture with stromal cells and ROCK inhibitor (Liu et al., 2012b) might further enhance efficiency. Nonetheless, the derivation of seven new lines over ∼9 months effectively doubles the number of existing prostate cancer cell lines.
Patient-derived organoid lines have copy number alteration signatures of aggressive prostate cancer
Stereotypic recurrent copy number changes found in high-grade primary and metastatic prostate cancer include gains of chromosome 7 and 8q and losses of chromosome 5q, 6q, 8p, 13q, and 18q (Demichelis et al., 2009; Grasso et al., 2012; Taylor et al., 2010). The seven prostate cancer organoid lines described here exhibit many of these typical copy number alterations, even more so than currently available prostate cancer cell lines (Figure 1A). For example, MSK-PCa1 and MSK-PCa3 exhibit the TMPRSS2-ERG interstitial deletion, and MSK-PCa1 and MSK-PCa7 harbor focal heterozygous deletion of SHQ1 and RYBP, both of which map to a region chromosome 3p21 previously shown to span the candidate tumor suppressors FOXP1, SHQ1 and RYBP (Krohn et al., 2013; Taylor et al., 2010).
Figure 1. Copy number landscape of patient derived prostate cancer organoid lines.
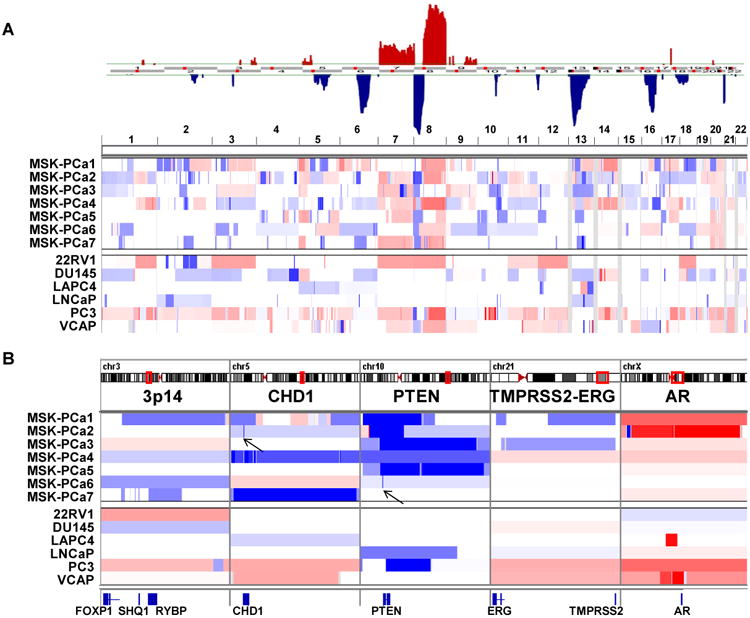
A. Top: Significant genomic aberrations in the prostate oncogenome from the MSKCC CGH dataset adopted from (Taylor et al., 2010). Bottom: Copy number landscape of seven patient derived organoid lines and six publically available prostate cancer cell lines using array CGH data. Shades of red and blue represent level of gain and loss. B. Copy number changes at chromosome 3p14 containing FOXP1, SHQ1, and RYBP, the CHD1 locus, the PTEN locus, the TMPRSS2-ERG locus and the AR locus. Arrows point to highly focal regions of biallelic deletion. See also Figure S1 for zoomed view together with corroborating RNA-Seq and WES reads.
Three organoid lines (MSK-PCa2, MSK-PCa4, MSK-PCa7) contain focal homozygous deletions of chromodomain helicase DNA binding protein 1(CHD1), that results in complete loss protein expression (Figure 1B, also see Figure 4B). CHD1 is the second most commonly homozygous deleted gene in prostate cancer (Burkhardt et al., 2013; Liu et al., 2012a). In MSK-PCa2, a sharp deletion results in abrupt termination of the transcript (Figure 1B, arrow) (Figure S1A).
Figure 4. Prostate cancer organoids exhibit diverse gene expression profiles.
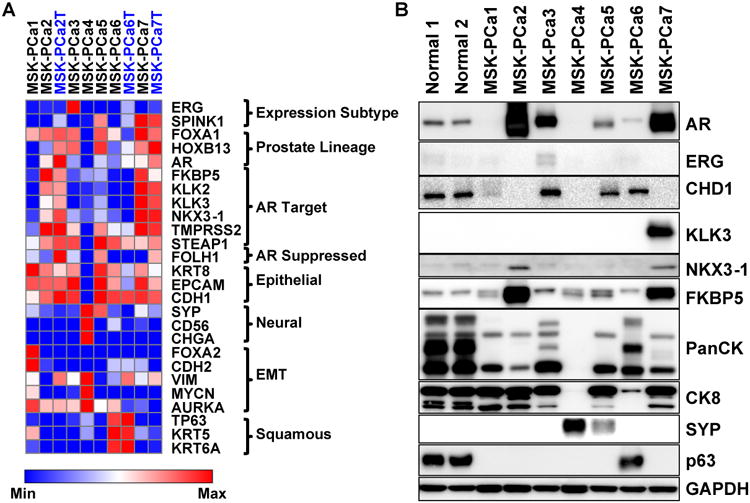
A. Heatmap of RNA expression of selected genes of seven organoid samples and three matched tumor samples (MSK-PCa2T, MSK-PCa6T, MSK-PCa7T) annotated in blue font. The genes are grouped by prostate cancer subclasses (ERG, SPINK1), prostate lineage transcription factors (FOXA1, HOXB13, AR), androgen receptor target genes (FKBP5, KLK2, KLK3, NKX3-1, TMPRSS2, STEAP1), a prostate lineage AR suppressed gene PSMA (FOLH1), epithelial markers (CK8, EPCAM, E-cadherin:CDH1), neuroendocrine markers (synaptophysin A:SYP, NCAM:CD56, chromogranin A:CHGA), genes whose expression is associated with epithelial to mesenchymal transition (FOXA2, N-cadherin:CDH2, vimentin: VIM, N-myc:MYCN, aurora kinase A: AURKA), squamous markers (TP63, KRT5, KRT6A). For each gene, the expression was log2 transformed and heatmap range is from minimum to maximum. B. Western Blot of selected proteins validating mRNA expression. Note pancytokeratin recognizes a pattern of low and high-molecular weight keratins. MSK-PCa6 displays a range similar to normal prostate organoids that contain both basal and luminal cells and MSK-PCa4 has lost expression of all cytokeratins. See also Figure S4 for hierarchical clustering of organoid mRNA expression and gene expression analysis of Michigan CRPC dataset. See also Figure S1 and S4.
Six of the seven organoid lines harbor focal homozygous deletion of PTEN or the PTEN promoter (Figure 1B, Figure S1B). In addition, MSK-PCa2 harbors an amplification of AR found in ∼50% of CRPC. Collectively, the human derived organoid lines harbor highly representative copy number alterations of prostate cancer and CRPC both in terms of overall landscape as well as highly prostate specific focal deletions.
Patient-derived organoid lines have a mutational landscape similar to prostate cancer
To catalog mutations present in the patient-derived organoid lines, we performed whole-exome sequencing (WES) of the organoid lines and identified somatic alterations by comparison to matched patient normal DNA (Table S1).
The number somatic non-synonymous single nucleotide variations (SNV) and indels ranged from 29 in MSK-PCa1 to 75 in MSK-PCa4 with a mean of 45.4 per sample, consistent with reported mutation frequency in CRPC tissue (Baca et al., 2013; Barbieri et al., 2012; Grasso et al., 2012) (Figure 2A, Table S2), and the specific genes are similar to those reported in metastatic CRPC (Figure 2B, Table S3).
Figure 2. Mutational landscape of patient-derived prostate cancer organoid lines.

A. Quantification of number of non-synonymous single nucleotide variations (SNV, pink) and insertion-deletions (Indel, orange) in each organoid sample compared to average total SNV and Indels of published whole-exome datasets (green). The light blue line represents the average mutations of the seven organoid lines. B. The alteration rate (green: mutation, including both non-synonymous SNV, blue: homozygous deletion, red: amplification, grey: multiple alterations) of genes mutated in the 7 organoid samples in prostate cancer datasets. C. Table of genes that are mutated in more than one sample as well as genes with putative functional oncogenic significance. The genes are color-coded by RNA-Seq based mRNA expression quantified as reads per kilobase mapped (RPKM). See also Figure S2 for view of TP53 and SPOP mutations. See also Table S1 for quality metrics of WES and Table S2 for all a list of all somatic mutations associated gene expression. D. Scatterplot of allele frequencies of point mutations (single-nucleotide variant, SNV) determined by whole-exome DNA sequencing between organoid sample and adjacent tumor tissue of MSK-PCa2 and MSK-PCa7. Most points lie on the regression line, suggestion preservation of the mutational landscape. E. Scatterplot of allele frequencies of expressed SNVs determined by RNA-Seq sequencing between organoid sample and adjacent tumor tissue. Among the expressed subset of SNV's, the allele frequencies lie on the regression line suggesting preservation of the mutational landscape. F. Scatterplot of allele frequencies of SNVs determined by whole-exome DNA sequencing between organoid sample and FFPE lymph node metastasis from ∼1 year prior of MSK-PCa1 and MSK-PCa5. The red dots indicate mutations found only in the organoid line. Some mutations lie above the regression line of the common mutations, indicating that they have gained allele frequency from primary tumor to organoid line. The slope of the regression line of ∼0.6 suggests 60% tumor purity of the lymph node specimen. See also Figure S2, Tables S1, S2 and S3.
TP53, the most commonly mutated gene in CRPC (Grasso et al., 2012; Kumar et al., 2011), was mutant in four organoid samples (Figure 2C). In all cases, only the mutant allele was detected by RNA-Seq, with complete loss of p53 function through either single copy loss or copy-neutral loss of heterozygosity (Figure S2A). FOXA1, a pioneer transcription factor, and PIK3R1, the regulatory subunit of PI3-kinase, were also found in organoid lines and are among the most mutated genes in CRPC.
The E3 ubiquitin ligase SPOP is the most commonly mutated gene in primary prostate cancer (∼10%) (Barbieri et al., 2012). MSK-PCa7 harbors a heterozygous SPOPF133L mutation within the substrate recognition domain (a known hotspot in human samples), making it the only known in vitro model of this mutation reported to date (Figure S2B).
We also observed mutations in genes that regulate genomic stability (ATRX, CHEK2) and in chromatin modifying enzymes (MED1, KDM4C, KDM4D, MLL2, SETDB1B, SETD2), all of which have been reported previously in CRPC (Grasso et al., 2012). In addition, the organoid lines harbor mutations in two well characterized tumors suppressors, TSC2 and CDK12 (Cancer Genome Atlas Research, 2011).
It is often difficult to discern driver and passage mutations in a small sample size. We reasoned that mutations in genes that are expressed would be more likely to be functional and therefore annotated the mutated genes by RNA-Seq based mRNA levels quantified as reads per kilobase mapped (RPKM) (Figure 2C). While most mutated genes are expressed at very low levels, mutations with high functional likelihood, including TP53, FOXA1, PIK3R1, and SPOP are all expressed at high levels. Four additional genes mutated in two samples, ABHD15, FAM193B, UTRN, and GIT2 demonstrated moderated to high expression levels and represent potential for followup.
Among the seven organoid lines, there was enough fresh frozen tumor tissue to perform WES in two (MSK-PCa2 and MSK-PCa7) specimens. We compared the mutational landscape between the tumor and the patient-derived organoid. We found 4 discrepant calls for MSK-PCa2 and 7 discrepant calls for MSK-PCa7, which, upon manual inspection, mapped to regions of low coverage or repeats and did not represent true differences (Table S2). Further, there was a high concordance between the allele frequencies found in the organoid lines and the corresponding tumor tissue (Figure 2D). In addition, using RNA-Seq data of match organoid and tumor sample of MSK-PCa6 (see below for RNA-Seq analysis), we examined the mRNA allele frequency of the mutant allele. We found that among expressed genes with somatic mutations, the allele frequency was highly concordant between the tumor and organoid line (Figure 2E). These data indicates that in 3 organoid samples, the organoid culture retained the mutational landscape of the tumor. Two additional patients (MSK-PCa1 and MSK-PCa5) had metastatic pelvic lymph nodes resected during radical retropubic prostatectomy ∼1 year prior to organoid acquisition. We performed WES on the archive formalin fixed paraffin embedded (FFPE) lymph node metastasis. Due to possible FFPE artifacts, we limited analysis to point mutations identified in the organoid sample. In MSK-Pca1 and MSK-PCa5 respectively, 15/23 (65%) and 23/33 (67%) of point mutations found in the organoid line were identified in the lymph node metastasis. While we cannot rule out the possibility that additional mutations were acquired during the culturing process, this data suggest that additional mutations were acquired during progression from hormone sensitive to castration resistant metastatic disease. In addition, several mutations had higher than expected allele frequencies (above the regression line) in the organoid sample suggesting further enrichment of the mutant allele (Figure 2E).
Human prostate cancer organoid lines recapitulate in situ histology in vitro and in vivo
Using organoid growth conditions, normal human epithelial cells form prostate-like structures in vitro that can be grafted in vivo to regenerate prostate glands (Karthaus, accompanying manuscript). Similarly, the seven organoid lines, and tumor grafts derived from these organoid lines, also display histological patterns present in the original patient sample. For example, the primary cancer from whom MSK-PCa1 was derived showed an intraductal growth pattern (Figure 3A), whereas the bone biopsy specimen showed only sparse tumor cells that stained positive for pan-cytokeratin (PanCK) and negative for AR (Figure S3A, not shown). Remarkably, the organoid lines derived from this bone marrow metastasis recapitulated the intraductal pattern of the primary cancer (Figure 3B). IHC showed that the organoids were positive for pan-cytokeratin and negative for AR, as seen in the corresponding biopsy specimen (Figure S3A). When grafted into SCID mice, the tumors recapitulated both the histological and immunohistological pattern of the patient sample (Figures 3C, S3A).
Figure 3. Histology of in situ prostate cancer, 3D organoids, and xengrafts.
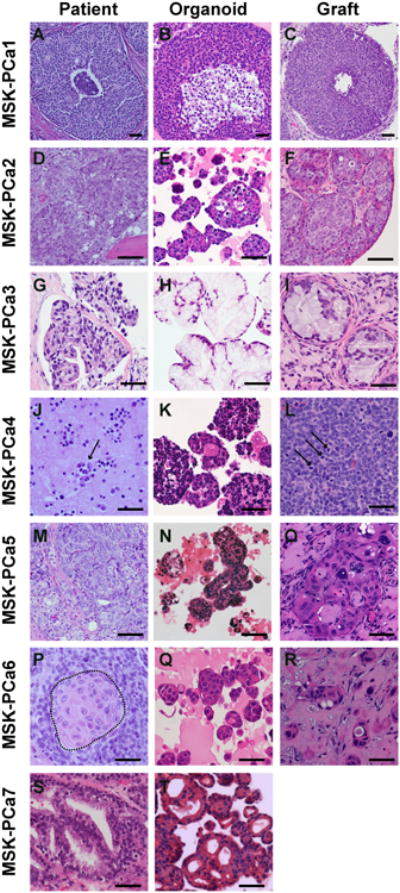
A. H&E of prostatectomy specimen of patient MSK-PCa1. B. H&E of organoids of MSK-PCa1. C. H&E of subcutaneous xenograft of MSK-PCa1. D. H&E of right acetabulum with metastatic prostate cancer from patient MSK-PCa2. E. H&E of organoids of MSK-PCa2. F. H&E of renal capsule xenograft of MSK-PCa2. G. H&E of retroperitoneal metastasis from patient MSK-PCa3. H. H&E of organoids of MSK-PCa3. I. H&E of subcutaneous xenograft of MSK-PCa3. J. Cytology of pleural effusion from patient MSK-PCa4. Arrows point to clusters of malignant cells. K. H&E of organoids of MSK-PCa4. L. H&E of subcutaneous xenograft of MSK-PCa4. Arrows point to mitotic figures. M. H&E of prostatectomy specimen of patient MSK-PCa5. N. H&E of circulating tumor cell-derived organoids of MSK-PCa5. O. H&E of subcutaneous xenograft of MSK-PCa5. P. H&E of extraprostatic prostate cancer from cystoprostatectomy specimen of patient MSK-PCa6. The field shown contains both adenocarcinoma and squamous differentiation highlighted in the dotted area. Q. H&E of organoids of MSK-PCa6. R. H&E of subcutaneous xenograft of MSK-PCa6. S. H&E of organoids of MSK-PCa7. T. H&E of organoids derived of MSK-PCa7. Scale bars represent 50 μM. See also Figure S3 for accompanying IHC.
The tissue specimens of MSK-PCa2, MSK-PCa3, MSK-PCa6 and MSK-PCa7 showed high-grade adenocarcinoma, mucinous adenocarcinoma (Johnson et al., 2013), adenocarcinoma with extensive squamous differentiation (Parwani et al., 2004) and Gleason pattern 4 adenocarcinoma with cribiform growth, respectively (Figures 3D, G, P, S). The histological pattern of each of these original tumors is also retained in the organoids (Figures 3E, H, Q, T). Tumors generated by engrafting MSK-PCa2, MSK-PCa3 and MSK-PCa6 into SCID mice were reminiscent of the tumor tissue (Figures 3F, I, R). Interestingly, the CTC-derived line MSK-PCa5 also generated organoids and grafts resembling the primary cancer (Figure 3M, N, O, S3E).
MSK-PCa4 is a prostate cancer with treatment-induced neuroendocrine differentiation isolated from a pleural effusion. It displays typical small cell features including high nuclear to cytoplasic ratio, multiple mitotic figures indicative of rapid proliferation, negative AR and positive synaptophysin staining both in 3D culture and when grafted in vivo (Figures 3J, K, L, S3D).
In summary, patient-derived organoids retain the microscopic features of the original patient sample across a range of histologies. However, a single histology tends to emerge from samples with intratumoral heterogeneity (i.e., MSK-PCa4 with both pan-cytokeratin positive and negative clones and MSK-PCa6 with both adenocarcinoma and squamous cells differentiation).
Patient-derived organoid lines exhibit diverse differentiation found in CRPC
We performed RNA-seq to catalog the gene expression profile of the seven organoid lines. As expected, hierarchical clustering of the profiles shows that the four AR-positive lines form one cluster, the two AR-negative lines form a second, while the AR-low line with squamous differentiation forms a third (Figure S4A).
More focused analysis of mRNA and protein expression of genes implicated in prostate cancer tumorigenesis and differentiation revealed that the seven organoids also recapitulate the diversity seen in human tumors (Figure 4A, B). MSK-PCa1 and MSK-PCa3 both harbor the TMPRSS2-ERG interstitial deletion but the AR-negative MSK-PCa1 no longer expresses the transcript, consistent with the observation that ∼50% of AR-negative CRPC prostate cancer harbor non-expressed TMPRSS2-ERG fusion (Schelling et al., 2013). MSK-PCa5 and MSK-PCa7 are positive for SPINK1, a gene expression based subtype of prostate cancer that is mutually exclusive with ETS translocations (Tomlins et al., 2008).
Two samples, MSK-PCa2 and MSK-PCa7 are characterized by high-level AR expression and expression of most AR target genes, with the exception that MSK-PCa2 has silenced KLK2/3 expression. MSK-PCa3, MSK-PCa5, and MSK-PCa6 have lower levels of AR expression but retain expression of selected AR target genes including STEAP1 and TMPRSS2. MSK-PCa1 has silenced AR but has retained epithelial differientation genes including CK8, EPCAM, and CHD1 (E-cadherin). MSK-PCa4, the neuroendocrine sample, expresses synaptophysin (SYP), chromogranin A (CHGA) and NCAM (CD56) but no epithelial cytokeratins. MSK-PCa6 shows expression of squamous basal keratins as well as the squamous/basal transcription factor TP63, consistent with its histology.
In the three tumor samples with sufficient fresh frozen tumor for which documented matching mutation profiles (MSK-PCa2, MSK-PCa6, MSK-PCa7), we further performed RNA-Seq on the in situ tumor specimens. There is a high concordance of gene expression between the tumor and the organoid lines, suggesting that in vitro culture maintains the differentiation state of the tumor (Figure 4A). The prostate cancer organoid lines encompass a surprising phenotypic diversity of aberrant differientation states from patients that all had adenocarcinoma in their initial biopsy of the primary disease. This highlights the plasticity of CRPC under selection pressure of treatment, and is appreciated by expression analysis of primary prostate cancer and CRPC samples from the Michigan dataset (Grasso et al., 2012) (Figure S4C-H).
Loss of PTEN, TP53, and RB tumor suppressor pathways in patient-derived organoid lines
The availability of comprehensive data on copy number alteration, mutation and expression provided an opportunity to examine the frequency of pathway alteration across the panel of organoid lines that may help identify alterations involved in progression to CRPC. Biallelic PTEN loss was seen in all 6 CRPC derived lines but not in the hormone sensitive MSK-PCa7 (Figure 5A, B). PTEN loss has been functionally associated with castration-resistance (Carver et al., 2011) and loss of PTEN function through copy number loss (blue), mutation (green) or decreased expression, is common in CRPC (30/36 samples) but only in ∼10% of primary cancer (Figure 5C and data not shown) (Baca et al., 2013; Barbieri et al., 2012; Taylor et al., 2010). Likewise, TP53 which is mutated in 4/6 CRPC organoid lines, is mutated, exhibits copy number loss, or is underexpressed in 27/36 CRPC samples but rarely in primary cancers (Figure 5D).
Figure 5. Loss of tumor suppressors PTEN, TP53, RB1, and CDKN2A in prostate organoid lines.

A. Oncoprint view of PTEN, TP53, RB1, and CDKN2A. The fill of the rectangle denotes copy number change (HOMOLOSS: dark blue, HETLOSS: light blue, GAIN: red). The border of the rectangle denotes gene expression change. Green square denotes mutation. B. Western Blot of PTEN, RB, phosphorylated RB (S807/S811), p16, and GAPDH of normal prostate organoids and prostate cancer organoid lines. C-E. Gene expression of PTEN, TP53, and RB1 in normal prostate tissue, primary cancer, and CRPC from the Michigan dataset. For CRPC, copy number and mutational data is available for most samples. Open circles indicates that mutational/copy number data is not available. Green fill indicates mutation. Light and dark blue fill indicates heterozygous and homozygous loss. F. Scatter plot of gene expression of RB1 and CDKN2A in benign (orange triangle), primary cancer (pink square) and CRPC (black circles). See also Figure S5 for RNA-Seq and Array-CGH tracks of CDKN2A.
Prior studies have documented heterozygous loss RB in prostate cancer, suggesting haploinsufficiency is sufficient to promote tumorigenesis (Sharma et al., 2010). Of note, three organoid lines had heterozygous RB1 loss (MSK-PCa1, MSK-PCa4, and MSK-PCa5) but had no detectable RB1 expression (Figure 5A, B). RNA-seq analysis revealed complete RB1 deletion in MSK-PCa5 that was missed on array-CGH and WES (Figure S1C), possibly explained by copy-neutral genomic rearrangement of the remaining allele. To explore whether complete loss of RB may be more common in prostate cancer than previously appreciated, we examined the RB gene locus and mRNA levels in a clinical CRPC dataset (Grasso et al., 2012) and found homozygous loss and reduced expression in ∼70% of cases (Figure 5E). Interestingly, two lines without RB alterations (MSK-PCa3 and MSK-PCa6) have biallelic loss of the tumor suppressor locus CDKN2A (Figure S5A, B), providing another mechanism to disable RB pathway function. Consistent with CDKN2A gene loss, these lines have hyperphosphorylated RB as a consequence of unrestrained CDK4/6 kinase activity due to loss of p16. CDKN2A deletion is seen rarely in clinical CRPC samples among the RB intact subset (3/67 total samples, 4.5%). Rather, most CRPC tumors exhibit CDKN2A overexpression, likely due p53/RB loss (Figure 5F). Indeed, the organoid lines with RB loss and P53 mutation had increased p16 expression (Figure 5B).
Patient derived organoid lines as genetically manipulatable models for drug response
To explore the suitability of CRPC-derived organoid lines for drug testing, we performed growth assays to determine sensitivity to enzalutamide as well as to two PI3-kinase pathway inhibitors, everolimus and BKM-120 that are currently in clinical trials for CRPC (Figure 6A-C). The AR amplified MSK-PCa2 line was exquisitely sensitive to enzalutamide with an IC-50 of approximately 50 nM whereas the other lines were resistant. The MSK-PCa2 organoid line, which harbors both PTEN loss and PIK3R1 mutation, was sensitive to both everolimus and BKM-120. These organoid models are also amenable to in vivo studies using bioluminescence to track tumor response. As expected, AR-amplified MSK-PCa2-derived xenografts were highly sensitive enzalutamide, recapitulating the in vitro result (Figure 6D, E) whereas AR negative MSK-PCa1 xenografts were resistant. For both MSK-PCa1 and MSK-PCa2, everolimus significantly slow tumor growth rate but did not induce shrinkage. Furthermore, everolimus significantly increased the tumor response to enzalutamide in MSK-PCa2.
Figure 6. Sensitivity to AR and PI3K inhibitor in organoid lines in vitro and in vivo.

A-C. Dose-response curves of organoid lines to enzalutamide, everolimus, and BKM120. Growth was measured in quadruplet and viability was assayed 4 days after treatment at the indicated drug concentrations (Mean +/- SD). D-E. Growth of MSK-PCA1 and MSK-PCA2 xenografts. Treatment was started with tumors reach an average size of 400 mm3. Each tumor was normalized to the pre-treatment size. (N=10, Mean +/-SEM). P value derived from unpaired two-tailed T-test of normalized tumor size at the end of treatment. Ev: everolimus, Enz: enzalutamide, Cast: castration.
Discussion
The past few years has seen a dramatic increase in the number of approved therapies with several promising investigational agents in late stage development to treat CRPC. These include the next-generation antiandrogen enzalutamide and the androgen synthesis inhibitor abiraterone acetate both which have been shown to significantly prolong life (de Bono et al., 2011; Ryan et al., 2012; Scher et al., 2012). The response however, is highly variable and only ∼30% attain durable response of > 6 months (Rathkopf and Scher, 2013). Thus, both an improved understanding of the molecular determinants of resistance to these agents as well as development of novel therapeutics are needed. Progress has been hampered by the lack of in vitro models that accurately represent the spectrum of disease. Here, we describe a method that allows for the establishment of patient-derived 3D organoid lines. As this report represents our initial attempt, we anticipate the method can be further optimized to improve success rate to generate the large repository of organoid lines required to study this highly heterogeneous disease. Biopsy and characterization of metastatic lesions are increasingly incorporated into therapeutic clinical trials of targeted agents in prostate cancer. This clinical practice should increase the opportunity to generate more organoid lines and may allow characterization of tumor genomes from biopsy material with too few tumor cells for direct analysis (e.g., MSK-PCa1, MSK-PCa2, and CTC sample MSK-PCa5).
Under selection pressure from treatment, CRPC is a highly heterogeneous disease. The widespread use of increasingly more efficacious AR pathway inhibitors may further generate multiple discrepant resistance mechanisms. CRPC tumor cells may remain dependent on AR or AR-like activity, or they may de-differentiate into AR-independent cells (Arora et al., 2013; Balbas et al., 2013; Beltran et al., 2011; Carver et al., 2011; Chen et al., 2013). The CRPC organoid lines described here already display a broad spectrum of AR levels as well as AR transcriptional activity. The generation of more lines with defined treatment histories should accelerate our mechanistic understanding of molecular determinants of sensitivity.
Prostate cancers harbor several disease-specific mutations, including ETS-translocations, SPOP mutations, FOXA1 mutations and CHD1 loss. We have generated models of each of these prostate-specific alterations and anticipate that more will be generated in the near future. Additionally, CRPC organoids provide an opportunity to define genetic lesions that mediate progression to metastatic CRPC. The high frequency of RB and TP53 pathway dysfunction in the CRPC organoid lines suggests that drugs targeting these pathways should become a therapeutic priority.
Experimental Procedures
Isolation & culture of metastatic prostate cancer cells and circulating tumor cells
Between December 2012 to November 2013, we collected 32 metastasis samples with documented tumor content >10% of the cells on pathology review (18 bone, 9 lymph node, 2 liver, 1 brain, 1 bladder, 1 pleural effusion) and 17 blood from patients with high CTC count >100 cells per 10mL of blood. Please see Extended Experimental Procedures for clinical details of the seven organoid lines.
All patients provided informed consent and samples were procured and the study was conducted under Memorial Sloan-Kettering Cancer Center Institutional Review Board approval (MSKCC IRB 90-040 or 06-107) prior to tissue acquisition. Clinical and pathologic data were entered and maintained in a database by our research project coordinator who generated a separate anonymized database for investigators. Metastatic prostate cancer biopsy pieces were minced and digested in 5 ml of 5 mg/ml collagenase type II (Invitrogen) in Advanced DMEM/F12 (ADMEM/F12) and digested for 0.5-2 hours at 37°C with gently shaking. Dissociated cells were washed and seeded in growth factor reduced Matrigel (BD biosciences).
For isolation of CTC, 8mL of blood samples was drawn into a heparin tube at Memorial Sloan-Kettering Cancer Center. Blood was incubated with 400ul RosetteSep Human CD45 Depletion Cocktail (Stem Cell technologies) for 20 minutes at room temperature, depleted the red blood cell and white blood cell using Ficoll-Paque (GE). Isolated circulating tumor cells were washed and seeded in growth factor reduced Matrigel (BD biosciences).
Human prostate cancer organoids were passaged either via trituration with a glass Pasteur pipet or dissociation with TrypLE (Sigma-Aldrich) for 5 min at 37 °C. Passage was performed weekly with a 1:3 ratio.
RNA-Sequencing and analysis
RNA was isolated from organoids with low passage number (less than 5) using Qiagen RNeasy kits. Library preparation and RNA sequencing was performed by MSKCC Genomics Core Laboratory using Illumina HiSeq with 50 or 75 bp paired-end reads and ∼30 million reads were generated for each sample. The reads were mapped human genome reference sequence (GRC37/hg19) using STAR (ver 2.3) (Dobin et al., 2013) and quantified into reads per kilobases mapped (RPKM) using Cufflinks with upper quartile normalization (ver 2.1) (Roberts et al., 2011). Heatmaps and clustering analysis using Pearson Correlation were generated using GENE-E (http://www.broadinstitute.org/cancer/software/GENE-E). Representative regions are displayed using Integrated Genomics Viewer (IGV).
DNA extraction, quality control library preparation
DNA from the 7 tumor organoid samples was extracted using Nucleospin tissue XS (Clontech) according to manufacturers protocol for cultured cells. The buffy coat DNA of the cases except MSK-PCa2 was extracted using Nucleospin tissue XS (Clontech) according to manufacturers protocol for blood samples. Promega Maxwell® 16 system was used to extracted DNA fresh frozen tissue. MSK-PCa2 normal DNA was extracted from 5 FFPE tissue curls using Promega Maxwell ® FFPE Plus LEV system.
Copy number analysis
Array-CGH using the Agilent SurePrint G3 1M microarray was performed using manufacturer's instructions by the MSKCC genomics core facility. We used either Promega pool's male DNA or patient normal DNA as the hybridization control. Segmentation and discrete copy number calls was performed using with Circular Binary Segmentation (Taylor et al., 2010). We uploaded prior Agilent 244A Array CGH data of existing prostate cancer cell lines from NCBI Gene Expression Omnibus (GSE21032) for analysis (22RV1, DU145, LAPC4, LNCaP, PC3, and VCAP) (Taylor et al., 2010). Data was mapped to human genome reference sequence (GRC37/hg19). Representative regions are displayed using Integrated Genomics Viewer (IGV).
Whole exome sequencing (WES) and data analysis
DNA library of the samples was prepared according to the Agilent SureSelectXT2 Target Enrichment System which covers about 51Mb of genomic regions corresponding to protein coding genes using 1μg input DNA.
Paired-end sequencing (2×75bp) was then performed using Illumina HiSeq 2500. Samples were multiplexed (2 samples per lane) to ensure a nominal coverage of ∼250× per sample. Raw sequences were aligned to the human genome reference sequence (GRC37/hg19) using BWA (Li and Durbin, 2010). We attained a mean of average coverage of ∼142× across samples with all samples showing more than 100× average coverage in the captured regions (range 103-178). On average, about 91% of captured bases where covered at >10× (Table S1). We then applied GATK base quality score recalibration, indel realignment, duplicate removal to remove potential artifacts and increase the quality of the alignment (McKenna et al., 2010).
Single nucleotide variant calls was performed using an in-house computational tool via the comparison the tumor – organoid – with its corresponding normal control. Indel analysis was performed using GATK according to best practices. Somatic events only, i.e. present in the tumor but not in the matching controls, are then refined by depth of coverage, variant allele frequency in the tumor and control, to filter out low quality calls. The final list is converted into a MAF file format.
Query of mutations in other prostate cancer datasets was done through the MSKCC computational biology portal (www.cbioprotal.org) (Cerami et al., 2012).
Cell viability and proliferation assay
Cell viability assays were conducted by plating 5000 organoids cells per well of a collagen coated 96 well cell culture plate in 100 μL complete human media with 0.1 nM DHT and treated with vehicle (DMSO) control or enzalutamide (0.01-500 nM), everolimus (0.25-50 nM), BKM120 (0.05-5 μM). Viable cells were counted using a CellTiter-Glo (Promega) Luminescent Cell Viability Assay. All cell viability experiments were conducted in quadruplicate and standard deviations were reported.
Xenograft studies
All mouse experiments was performed under MSKCC IACUC approved protocol. For subcutaneous growth, 2-4 million cells were mixed 50:50 with Matrigel and injected into mice CB17 SCID mice. For renal capsule growth, 100K cells were mixed into collagen plug and implanted under the renal capsule of CB17 SCID mice.
Drug treatment was started when tumors reached 500 mm3. Everolimus (Novartis) was dissolved in water and dosed at 10 mg/kg dose 5 days per week. Enzalutamide was dissolved in vehicle (1% carboxymethyl cellulose, 0.1% Tween-80, 5% DMSO) and used at 10 mg/kg dosed 5 days per week. Tumors size was measured twice weekly or weekly depending on growth rate.
Repositories
The organoid lines will be distributed by MSKCC in compliance to the IRB-approved informed consent signed by the patient. Genetics data from array-CGH, RNA-Seq, and whole-exome sequencing can be analyzed and downloaded from the MSKCC cBioportal (http://www.cbioportal.org) (Cerami et al., 2012).
Supplementary Material
Figure S1. Focal tumor suppressor lost in prostate cancer organoid lines. Related to Figure 1 and 4. A. The CHD1 locus in MSK-PCa2 harbors a focal loss involving exons 24-29 seen both by array CGH as well as by whole-exome sequencing capture efficiency. This results in a truncated transcript that abruptly ends at exon 24, seen on RNA-Seq. B. The PTEN locus of MSK-PCa6 harbors a focal loss of the PTEN promoter seen both by array CGH as well as by whole-exome sequencing capture efficiency. This results in no transcript detectable on RNA-Seq. C. The RB1 locus of MSK-PCa5 shows heterozygous loss detectable by either array-CGH or whole-exome sequencing. Yet, the transcript is truncated after exon 17 with excess reads mapping into intron 18. This is likely due combination of heterozygous loss and a structural variant (e.g., copy neutral translocation) of the remaining copy.
Figure S2. P53 and SPOP mutations in organoid lines. Related to Figure 2. A. View of the TP53 locus for the four samples with mutations. Array CGH indicates that the locus is diploid in MSK-PCa1 and MSK-PCA4 while there is heterozygous loss in MSK-PCa2 and MSK-PCa5. As expected, in the heterozygous loss samples, the remaining allele is mutated and the mutant accounts for 100% of the DNA and expressed transcript. Examination of the germline and tumor DNA indicates that the diploid samples exhibit loss of heterozygosity (LOH) and the mutation accounts for 100% of the DNA expressed transcript. B. View of the SPOP locus in MSK-PCa7 showing heterozygous mutation in tumor and organoid DNA and expression of the mutated transcript.
Figure S3. IHC of 3D organoids and xenografts. Related to Figure 3. H&E or IHC against the indicated antigens are shown for MSK-PCa1 (A), MSK-PCa2 (B), MSK-PCa3 (C), MSK-PCa4 (D), MSK-PCa5 (E), MSK-PCa6 (F), MSK-PCa1 (G). Scale bar is 50 μm.
Figure S4. Gene expression analysis of CRPC samples and organoid lines. Related to Figure 4. A. Unsupervised hierarchal clustering of organoid gene expression, showing AR-negative (MSK-PCa1, MSK-PCa4), AR-low (MSK-PCa3, MSK-PCa5), AR-high(MSK-PCa2, MSK-PCa7) clusters and separation of MSK-PCa6 squamous cell line. B. Principle component analysis of the Michigan dataset showing greatly increased heterogeneity of CRPC samples from primary disease. C-H. Gene expression of normal prostate tissue, primary cancer, and CRPC of AR, AR-target genes KLK2 and STEAP1, neuroendocrine marker CHGA, and squamous marker KRT5 from the Michigan dataset. There are samples with both increased and decreased AR and AR target gene expression, samples with loss of epithelial markers, samples with increased neuroendocrine marker expression as well as one sample with squamous differentiation.
Figure S5. Loss of CDKN2A in prostate cancer organoids. Related to Figure 5. A. Array CGH showing focal homozygous deletion around the CDKN2A locus in MSK-PCa3 and MSK-PCa5. B. Overlaid view of RNA-seq and array CGH data of the CDKN2A locus shows that focal deletion is associated with loss of mRNA. In addition, samples RB1 transcript loss (MSK-PCa1, MSK-PCa4, and MSK-PCa5, asterisks) have higher levels of both the p16 and p19 transcripts. Only MSK-PCa2 and MSK-PCa7 are intact for both CDKN2A and RB1.
Table S1: Whole exome sequencing metrics. Related to Figure 2.
Table S2: Mutation calls in organoid lines. Related to Figure 2.
Table S3: Percent of cases of CRPC from Grasso et. al. that have alterations of genes mutated in organd lines. Related to Figure 2.
Highlights.
Generation of prostate cancer organoids from metastasis and circulating tumor cells
Organoids retain the histological and molecular features of the patient specimen
Organoids recapitulate the diversity of castration-resistant prostate cancer
Organoid lines can be used for drug studies in vitro and as xenografts in vivo
Acknowledgments
We would like to thank the Prostate Cancer Foundation (PCF) for generous financial support as well as Drs. Howard Soule and Jonathon Simons for stimulating discussions. We thank the follow MSKCC core facilities: Genomics Core Laboratory (Daoqi You, Agnes Viales), and Molecular Cytology (Ning Fan and Mesruh Turkekul). We thank the National Institutes of Health (5K08CA140946, YC; P50CA092629 YC, HIS, BC, CLS; CA155169-01A1, CLS; 5R01CA116337, MB and MAR), US Department of Defense (W81XWH-10-1-0197, YC; W81XWH-09-1-0147, HIS), Movember Foundation (YC, DCD, BC, SBS, CLS), the Geoffrey Beene Cancer Center (YC, BC) the STARR Cancer Consortium for funding (I8-A722, YC, HB, MAR).
Footnotes
Author Contributions: DG, IV, PJI, and CD performed isolation, characterization, and growth of the human organoids. AS and SR performed integrative genomics analysis. BC, WRK, MAR, HIS, HC, CLS, and YC conceived and oversaw the project. AG and JMM performed pathologic evaluation. JNW, MK, TYM, EAU, LPB, WD, ZC, QFZ, IS and LR helped with experiments and provided technical support. JW performed mouse xenograft experiments. HB, VKA, JAE, KAT, PTS, VPL assessed, consented, and acquired surgical patient tissues. DER, MJM, DCD, SFS, and HIS assess, and consented patients for biopsy specimens. SBS assessed patients for biopsy site selection and performed biopsies. KRC is the research project coordinator who tracked clinical information and coordinated research biopsies. PC and HB provided intellectual input. YC and CLS wrote the manuscript and HIS, MAR and AS provided editorial input.
Publisher's Disclaimer: This is a PDF file of an unedited manuscript that has been accepted for publication. As a service to our customers we are providing this early version of the manuscript. The manuscript will undergo copyediting, typesetting, and review of the resulting proof before it is published in its final citable form. Please note that during the production process errors may be discovered which could affect the content, and all legal disclaimers that apply to the journal pertain.
References
- Arora VK, Schenkein E, Murali R, Subudhi SK, Wongvipat J, Balbas MD, Shah N, Cai L, Efstathiou E, Logothetis C, et al. Glucocorticoid receptor confers resistance to antiandrogens by bypassing androgen receptor blockade. Cell. 2013;155:1309–1322. doi: 10.1016/j.cell.2013.11.012. [DOI] [PMC free article] [PubMed] [Google Scholar]
- Baca SC, Prandi D, Lawrence MS, Mosquera JM, Romanel A, Drier Y, Park K, Kitabayashi N, Macdonald TY, Ghandi M, et al. Punctuated evolution of prostate cancer genomes. Cell. 2013;153:666–677. doi: 10.1016/j.cell.2013.03.021. [DOI] [PMC free article] [PubMed] [Google Scholar]
- Balbas MD, Evans MJ, Hosfield DJ, Wongvipat J, Arora VK, Watson PA, Chen Y, Greene GL, Shen Y, Sawyers CL. Overcoming mutation-based resistance to antiandrogens with rational drug design. eLife. 2013;2:e00499. doi: 10.7554/eLife.00499. [DOI] [PMC free article] [PubMed] [Google Scholar]
- Barbieri CE, Baca SC, Lawrence MS, Demichelis F, Blattner M, Theurillat JP, White TA, Stojanov P, Van Allen E, Stransky N, et al. Exome sequencing identifies recurrent SPOP, FOXA1 and MED12 mutations in prostate cancer. Nat Genet. 2012;44:685–689. doi: 10.1038/ng.2279. [DOI] [PMC free article] [PubMed] [Google Scholar]
- Barker N, Huch M, Kujala P, van de Wetering M, Snippert HJ, van Es JH, Sato T, Stange DE, Begthel H, van den Born M, et al. Lgr5(+ve) stem cells drive self-renewal in the stomach and build long-lived gastric units in vitro. Cell stem cell. 2010;6:25–36. doi: 10.1016/j.stem.2009.11.013. [DOI] [PubMed] [Google Scholar]
- Barretina J, Caponigro G, Stransky N, Venkatesan K, Margolin AA, Kim S, Wilson CJ, Lehar J, Kryukov GV, Sonkin D, et al. The Cancer Cell Line Encyclopedia enables predictive modelling of anticancer drug sensitivity. Nature. 2012;483:603–607. doi: 10.1038/nature11003. [DOI] [PMC free article] [PubMed] [Google Scholar]
- Beltran H, Rickman DS, Park K, Chae SS, Sboner A, MacDonald TY, Wang Y, Sheikh KL, Terry S, Tagawa ST, et al. Molecular characterization of neuroendocrine prostate cancer and identification of new drug targets. Cancer discovery. 2011;1:487–495. doi: 10.1158/2159-8290.CD-11-0130. [DOI] [PMC free article] [PubMed] [Google Scholar]
- Burkhardt L, Fuchs S, Krohn A, Masser S, Mader M, Kluth M, Bachmann F, Huland H, Steuber T, Graefen M, et al. CHD1 is a 5q21 tumor suppressor required for ERG rearrangement in prostate cancer. Cancer Res. 2013;73:2795–2805. doi: 10.1158/0008-5472.CAN-12-1342. [DOI] [PubMed] [Google Scholar]
- Cancer Genome Atlas Research, N. Integrated genomic analyses of ovarian carcinoma. Nature. 2011;474:609–615. doi: 10.1038/nature10166. [DOI] [PMC free article] [PubMed] [Google Scholar]
- Carver BS, Chapinski C, Wongvipat J, Hieronymus H, Chen Y, Chandarlapaty S, Arora VK, Le C, Koutcher J, Scher H, et al. Reciprocal Feedback Regulation of PI3K and Androgen Receptor Signaling in PTEN-Deficient Prostate Cancer. Cancer cell. 2011;19:575–586. doi: 10.1016/j.ccr.2011.04.008. [DOI] [PMC free article] [PubMed] [Google Scholar]
- Cerami E, Gao J, Dogrusoz U, Gross BE, Sumer SO, Aksoy BA, Jacobsen A, Byrne CJ, Heuer ML, Larsson E, et al. The cBio cancer genomics portal: an open platform for exploring multidimensional cancer genomics data. Cancer discovery. 2012;2:401–404. doi: 10.1158/2159-8290.CD-12-0095. [DOI] [PMC free article] [PubMed] [Google Scholar]
- Chen Y, Chi P, Rockowitz S, Iaquinta PJ, Shamu T, Shukla S, Gao D, Sirota I, Carver BS, Wongvipat J, et al. ETS factors reprogram the androgen receptor cistrome and prime prostate tumorigenesis in response to PTEN loss. Nat Med. 2013;19:1023–1029. doi: 10.1038/nm.3216. [DOI] [PMC free article] [PubMed] [Google Scholar]
- de Bono JS, Logothetis CJ, Molina A, Fizazi K, North S, Chu L, Chi KN, Jones RJ, Goodman OB, Jr, Saad F, et al. Abiraterone and increased survival in metastatic prostate cancer. N Engl J Med. 2011;364:1995–2005. doi: 10.1056/NEJMoa1014618. [DOI] [PMC free article] [PubMed] [Google Scholar]
- Demichelis F, Setlur SR, Beroukhim R, Perner S, Korbel JO, Lafargue CJ, Pflueger D, Pina C, Hofer MD, Sboner A, et al. Distinct genomic aberrations associated with ERG rearranged prostate cancer. Genes Chromosomes Cancer. 2009;48:366–380. doi: 10.1002/gcc.20647. [DOI] [PMC free article] [PubMed] [Google Scholar]
- Dobin A, Davis CA, Schlesinger F, Drenkow J, Zaleski C, Jha S, Batut P, Chaisson M, Gingeras TR. STAR: ultrafast universal RNA-seq aligner. Bioinformatics. 2013;29:15–21. doi: 10.1093/bioinformatics/bts635. [DOI] [PMC free article] [PubMed] [Google Scholar]
- Druker BJ, Tamura S, Buchdunger E, Ohno S, Segal GM, Fanning S, Zimmermann J, Lydon NB. Effects of a selective inhibitor of the Abl tyrosine kinase on the growth of Bcr-Abl positive cells. Nat Med. 1996;2:561–566. doi: 10.1038/nm0596-561. [DOI] [PubMed] [Google Scholar]
- Garnett MJ, Edelman EJ, Heidorn SJ, Greenman CD, Dastur A, Lau KW, Greninger P, Thompson IR, Luo X, Soares J, et al. Systematic identification of genomic markers of drug sensitivity in cancer cells. Nature. 2012;483:570–575. doi: 10.1038/nature11005. [DOI] [PMC free article] [PubMed] [Google Scholar]
- Grasso CS, Wu YM, Robinson DR, Cao X, Dhanasekaran SM, Khan AP, Quist MJ, Jing X, Lonigro RJ, Brenner JC, et al. The mutational landscape of lethal castration-resistant prostate cancer. Nature. 2012;487:239–243. doi: 10.1038/nature11125. [DOI] [PMC free article] [PubMed] [Google Scholar]
- Horoszewicz JS, Leong SS, Kawinski E, Karr JP, Rosenthal H, Chu TM, Mirand EA, Murphy GP. LNCaP model of human prostatic carcinoma. Cancer Res. 1983;43:1809–1818. [PubMed] [Google Scholar]
- Huch M, Bonfanti P, Boj SF, Sato T, Loomans CJ, van de Wetering M, Sojoodi M, Li VS, Schuijers J, Gracanin A, et al. Unlimited in vitro expansion of adult bi-potent pancreas progenitors through the Lgr5/R-spondin axis. EMBO J. 2013a;32:2708–2721. doi: 10.1038/emboj.2013.204. [DOI] [PMC free article] [PubMed] [Google Scholar]
- Huch M, Dorrell C, Boj SF, van Es JH, Li VS, van de Wetering M, Sato T, Hamer K, Sasaki N, Finegold MJ, et al. In vitro expansion of single Lgr5+ liver stem cells induced by Wnt-driven regeneration. Nature. 2013b;494:247–250. doi: 10.1038/nature11826. [DOI] [PMC free article] [PubMed] [Google Scholar]
- Johnson H, Zhou M, Osunkoya AO. ERG expression in mucinous prostatic adenocarcinoma and prostatic adenocarcinoma with mucinous features: comparison with conventional prostatic adenocarcinoma. Hum Pathol. 2013;44:2241–2246. doi: 10.1016/j.humpath.2013.05.006. [DOI] [PubMed] [Google Scholar]
- Kaighn ME, Lechner JF, Narayan KS, Jones LW. Prostate carcinoma: tissue culture cell lines. National Cancer Institute monograph. 1978:17–21. [PubMed] [Google Scholar]
- Korenchuk S, Lehr JE, L MC, Lee YG, Whitney S, Vessella R, Lin DL, Pienta KJ. VCaP, a cell-based model system of human prostate cancer. In vivo. 2001;15:163–168. [PubMed] [Google Scholar]
- Krohn A, Seidel A, Burkhardt L, Bachmann F, Mader M, Grupp K, Eichenauer T, Becker A, Adam M, Graefen M, et al. Recurrent deletion of 3p13 targets multiple tumour suppressor genes and defines a distinct subgroup of aggressive ERG fusion-positive prostate cancers. J Pathol. 2013;231:130–141. doi: 10.1002/path.4223. [DOI] [PubMed] [Google Scholar]
- Kumar A, White TA, MacKenzie AP, Clegg N, Lee C, Dumpit RF, Coleman I, Ng SB, Salipante SJ, Rieder MJ, et al. Exome sequencing identifies a spectrum of mutation frequencies in advanced and lethal prostate cancers. Proc Natl Acad Sci U S A. 2011;108:17087–17092. doi: 10.1073/pnas.1108745108. [DOI] [PMC free article] [PubMed] [Google Scholar]
- Li H, Durbin R. Fast and accurate long-read alignment with Burrows-Wheeler transform. Bioinformatics. 2010;26:589–595. doi: 10.1093/bioinformatics/btp698. [DOI] [PMC free article] [PubMed] [Google Scholar]
- Liu W, Lindberg J, Sui G, Luo J, Egevad L, Li T, Xie C, Wan M, Kim ST, Wang Z, et al. Identification of novel CHD1-associated collaborative alterations of genomic structure and functional assessment of CHD1 in prostate cancer. Oncogene. 2012a;31:3939–3948. doi: 10.1038/onc.2011.554. [DOI] [PMC free article] [PubMed] [Google Scholar]
- Liu X, Ory V, Chapman S, Yuan H, Albanese C, Kallakury B, Timofeeva OA, Nealon C, Dakic A, Simic V, et al. ROCK inhibitor and feeder cells induce the conditional reprogramming of epithelial cells. Am J Pathol. 2012b;180:599–607. doi: 10.1016/j.ajpath.2011.10.036. [DOI] [PMC free article] [PubMed] [Google Scholar]
- McKenna A, Hanna M, Banks E, Sivachenko A, Cibulskis K, Kernytsky A, Garimella K, Altshuler D, Gabriel S, Daly M, et al. The Genome Analysis Toolkit: a MapReduce framework for analyzing next-generation DNA sequencing data. Genome Res. 2010;20:1297–1303. doi: 10.1101/gr.107524.110. [DOI] [PMC free article] [PubMed] [Google Scholar]
- Mertz KD, Setlur SR, Dhanasekaran SM, Demichelis F, Perner S, Tomlins S, Tchinda J, Laxman B, Vessella RL, Beroukhim R, et al. Molecular characterization of TMPRSS2-ERG gene fusion in the NCI-H660 prostate cancer cell line: a new perspective for an old model. Neoplasia. 2007;9:200–206. doi: 10.1593/neo.07103. [DOI] [PMC free article] [PubMed] [Google Scholar]
- Navone NM, Olive M, Ozen M, Davis R, Troncoso P, Tu SM, Johnston D, Pollack A, Pathak S, von Eschenbach AC, et al. Establishment of two human prostate cancer cell lines derived from a single bone metastasis. Clin Cancer Res. 1997;3:2493–2500. [PubMed] [Google Scholar]
- Parwani AV, Kronz JD, Genega EM, Gaudin P, Chang S, Epstein JI. Prostate carcinoma with squamous differentiation: an analysis of 33 cases. Am J Surg Pathol. 2004;28:651–657. doi: 10.1097/00000478-200405000-00014. [DOI] [PubMed] [Google Scholar]
- Rathkopf D, Scher HI. Androgen receptor antagonists in castration-resistant prostate cancer. Cancer journal. 2013;19:43–49. doi: 10.1097/PPO.0b013e318282635a. [DOI] [PMC free article] [PubMed] [Google Scholar]
- Roberts A, Trapnell C, Donaghey J, Rinn JL, Pachter L. Improving RNA-Seq expression estimates by correcting for fragment bias. Genome Biol. 2011;12:R22. doi: 10.1186/gb-2011-12-3-r22. [DOI] [PMC free article] [PubMed] [Google Scholar]
- Ryan CJ, Smith MR, De Bono JS, Molina A, Logothetis C, De Souza PL, Fizazi K, Mainwaring PN, Piulats Rodriguez JM, Ng S, et al. Interim analysis (IA) results of COU-AA-302, a randomized, phase III study of abiraterone acetate (AA) in chemotherapy-naive patients (pts) with metastatic castration-resistant prostate cancer (mCRPC) ASCO Meeting Abstracts. 2012;30:LBA4518. [Google Scholar]
- Sato T, Vries RG, Snippert HJ, van de Wetering M, Barker N, Stange DE, van Es JH, Abo A, Kujala P, Peters PJ, et al. Single Lgr5 stem cells build crypt-villus structures in vitro without a mesenchymal niche. Nature. 2009;459:262–265. doi: 10.1038/nature07935. [DOI] [PubMed] [Google Scholar]
- Schelling LA, Williamson SR, Zhang S, Yao JL, Wang M, Huang J, Montironi R, Lopez-Beltran A, Emerson RE, Idrees MT, et al. Frequent TMPRSS2-ERG rearrangement in prostatic small cell carcinoma detected by fluorescence in situ hybridization: the superiority of fluorescence in situ hybridization over ERG immunohistochemistry. Hum Pathol. 2013;44:2227–2233. doi: 10.1016/j.humpath.2013.05.005. [DOI] [PubMed] [Google Scholar]
- Scher HI, Fizazi K, Saad F, Taplin ME, Sternberg CN, Miller K, de Wit R, Mulders P, Chi KN, Shore ND, et al. Increased survival with enzalutamide in prostate cancer after chemotherapy. N Engl J Med. 2012;367:1187–1197. doi: 10.1056/NEJMoa1207506. [DOI] [PubMed] [Google Scholar]
- Sharma A, Yeow WS, Ertel A, Coleman I, Clegg N, Thangavel C, Morrissey C, Zhang X, Comstock CE, Witkiewicz AK, et al. The retinoblastoma tumor suppressor controls androgen signaling and human prostate cancer progression. J Clin Invest. 2010;120:4478–4492. doi: 10.1172/JCI44239. [DOI] [PMC free article] [PubMed] [Google Scholar]
- Smaletz O, Scher HI, Small EJ, Verbel DA, McMillan A, Regan K, Kelly WK, Kattan MW. Nomogram for overall survival of patients with progressive metastatic prostate cancer after castration. J Clin Oncol. 2002;20:3972–3982. doi: 10.1200/JCO.2002.11.021. [DOI] [PubMed] [Google Scholar]
- Solit DB, Garraway LA, Pratilas CA, Sawai A, Getz G, Basso A, Ye Q, Lobo JM, She Y, Osman I, et al. BRAF mutation predicts sensitivity to MEK inhibition. Nature. 2006;439:358–362. doi: 10.1038/nature04304. [DOI] [PMC free article] [PubMed] [Google Scholar]
- Sramkoski RM, Pretlow TG, 2nd, Giaconia JM, Pretlow TP, Schwartz S, Sy MS, Marengo SR, Rhim JS, Zhang D, Jacobberger JW. A new human prostate carcinoma cell line, 22Rv1. In vitro cellular & developmental biology Animal. 1999;35:403–409. doi: 10.1007/s11626-999-0115-4. [DOI] [PubMed] [Google Scholar]
- Taylor BS, Schultz N, Hieronymus H, Gopalan A, Xiao Y, Carver BS, Arora VK, Kaushik P, Cerami E, Reva B, et al. Integrative genomic profiling of human prostate cancer. Cancer Cell. 2010;18:11–22. doi: 10.1016/j.ccr.2010.05.026. [DOI] [PMC free article] [PubMed] [Google Scholar]
- Thatcher N, Chang A, Parikh P, Rodrigues Pereira J, Ciuleanu T, von Pawel J, Thongprasert S, Tan EH, Pemberton K, Archer V, et al. Gefitinib plus best supportive care in previously treated patients with refractory advanced non-small-cell lung cancer: results from a randomised, placebo-controlled, multicentre study (Iressa Survival Evaluation in Lung Cancer) Lancet. 2005;366:1527–1537. doi: 10.1016/S0140-6736(05)67625-8. [DOI] [PubMed] [Google Scholar]
- Tomlins SA, Rhodes DR, Yu J, Varambally S, Mehra R, Perner S, Demichelis F, Helgeson BE, Laxman B, Morris DS, et al. The role of SPINK1 in ETS rearrangement-negative prostate cancers. Cancer Cell. 2008;13:519–528. doi: 10.1016/j.ccr.2008.04.016. [DOI] [PMC free article] [PubMed] [Google Scholar]
Associated Data
This section collects any data citations, data availability statements, or supplementary materials included in this article.
Supplementary Materials
Figure S1. Focal tumor suppressor lost in prostate cancer organoid lines. Related to Figure 1 and 4. A. The CHD1 locus in MSK-PCa2 harbors a focal loss involving exons 24-29 seen both by array CGH as well as by whole-exome sequencing capture efficiency. This results in a truncated transcript that abruptly ends at exon 24, seen on RNA-Seq. B. The PTEN locus of MSK-PCa6 harbors a focal loss of the PTEN promoter seen both by array CGH as well as by whole-exome sequencing capture efficiency. This results in no transcript detectable on RNA-Seq. C. The RB1 locus of MSK-PCa5 shows heterozygous loss detectable by either array-CGH or whole-exome sequencing. Yet, the transcript is truncated after exon 17 with excess reads mapping into intron 18. This is likely due combination of heterozygous loss and a structural variant (e.g., copy neutral translocation) of the remaining copy.
Figure S2. P53 and SPOP mutations in organoid lines. Related to Figure 2. A. View of the TP53 locus for the four samples with mutations. Array CGH indicates that the locus is diploid in MSK-PCa1 and MSK-PCA4 while there is heterozygous loss in MSK-PCa2 and MSK-PCa5. As expected, in the heterozygous loss samples, the remaining allele is mutated and the mutant accounts for 100% of the DNA and expressed transcript. Examination of the germline and tumor DNA indicates that the diploid samples exhibit loss of heterozygosity (LOH) and the mutation accounts for 100% of the DNA expressed transcript. B. View of the SPOP locus in MSK-PCa7 showing heterozygous mutation in tumor and organoid DNA and expression of the mutated transcript.
Figure S3. IHC of 3D organoids and xenografts. Related to Figure 3. H&E or IHC against the indicated antigens are shown for MSK-PCa1 (A), MSK-PCa2 (B), MSK-PCa3 (C), MSK-PCa4 (D), MSK-PCa5 (E), MSK-PCa6 (F), MSK-PCa1 (G). Scale bar is 50 μm.
Figure S4. Gene expression analysis of CRPC samples and organoid lines. Related to Figure 4. A. Unsupervised hierarchal clustering of organoid gene expression, showing AR-negative (MSK-PCa1, MSK-PCa4), AR-low (MSK-PCa3, MSK-PCa5), AR-high(MSK-PCa2, MSK-PCa7) clusters and separation of MSK-PCa6 squamous cell line. B. Principle component analysis of the Michigan dataset showing greatly increased heterogeneity of CRPC samples from primary disease. C-H. Gene expression of normal prostate tissue, primary cancer, and CRPC of AR, AR-target genes KLK2 and STEAP1, neuroendocrine marker CHGA, and squamous marker KRT5 from the Michigan dataset. There are samples with both increased and decreased AR and AR target gene expression, samples with loss of epithelial markers, samples with increased neuroendocrine marker expression as well as one sample with squamous differentiation.
Figure S5. Loss of CDKN2A in prostate cancer organoids. Related to Figure 5. A. Array CGH showing focal homozygous deletion around the CDKN2A locus in MSK-PCa3 and MSK-PCa5. B. Overlaid view of RNA-seq and array CGH data of the CDKN2A locus shows that focal deletion is associated with loss of mRNA. In addition, samples RB1 transcript loss (MSK-PCa1, MSK-PCa4, and MSK-PCa5, asterisks) have higher levels of both the p16 and p19 transcripts. Only MSK-PCa2 and MSK-PCa7 are intact for both CDKN2A and RB1.
Table S1: Whole exome sequencing metrics. Related to Figure 2.
Table S2: Mutation calls in organoid lines. Related to Figure 2.
Table S3: Percent of cases of CRPC from Grasso et. al. that have alterations of genes mutated in organd lines. Related to Figure 2.