

Abstract
Hyperhomocysteinemia (HHcy) is associated with increased diabetic cardiovascular diseases. However, the role of HHcy in atherogenesis associated with hyperglycemia (HG) remains unknown. To examine the role and mechanisms by which HHcy accelerates HG-induced atherosclerosis, we established an atherosclerosis-susceptible HHcy and HG mouse model. HHcy was established in mice deficient in cystathionine β-synthase (Cbs) in which the homocysteine (Hcy) level could be lowered by inducing transgenic human CBS (Tg-hCBS) using Zn supplementation. HG was induced by streptozotocin injection. Atherosclerosis was induced by crossing Tg-hCBS Cbs mice with apolipoprotein E-deficient (ApoE−/−) mice and feeding them a high-fat diet for 2 weeks. We demonstrated that HHcy and HG accelerated atherosclerosis and increased lesion monocytes (MCs) and macrophages (MØs) and further increased inflammatory MC and MØ levels in peripheral tissues. Furthermore, Hcy-lowering reversed circulating mononuclear cells, MC, and inflammatory MC and MC-derived MØ levels. In addition, inflammatory MC correlated positively with plasma Hcy levels and negatively with plasma s-adenosylmethionine–to–s-adenosylhomocysteine ratios. Finally, l-Hcy and d-glucose promoted inflammatory MC differentiation in primary mouse splenocytes, which was reversed by adenoviral DNA methyltransferase-1. HHcy and HG, individually and synergistically, accelerated atherosclerosis and inflammatory MC and MØ differentiation, at least in part, via DNA hypomethylation.
Introduction
Hyperhomocysteinemia (HHcy) is an independent risk factor for atherosclerosis in the general population (1,2) and for diabetic cardiovascular diseases (CVDs) (3–5). Compared with healthy control subjects, the prevalence of HHcy and the homocysteine (Hcy) mean level are both increased in type 1 diabetic patients (4), and increased Hcy elevated mortality in diabetic patients (6,7). More specifically, HHcy has been associated with an increased risk for type 2 diabetic coronary artery disease (6,8), retinopathy (9,10), macroangiopathy (11), and nephropathy (11). HHcy is also associated with type 1 diabetic retinopathy (12,13). However, the role and mechanisms of HHcy in macrovascular complications in hyperglycemia (HG) has not been studied.
Because HHcy has been recognized as an important vascular risk factor in diabetes, several clinical trials evaluating the effect of Hcy-lowering therapy on disease outcomes have been conducted, and the results are inconsistent (14–17). High doses of folic acid, vitamin B6 and/or B12 did not result in a decrease in vascular events or type 2 diabetes development but did improve endothelial function in children with type 1 diabetes. The complexity of the patient’s pathological condition might attenuate the beneficial effect of Hcy-lowering on the prevention and/or treatment of vascular events in diabetes.
That inflammation is critical to the pathogenesis of a broad range of human diseases, including cancer, viral infection, autoimmune diseases, metabolic diseases, and CVDs, is becoming increasingly clear (18–22). Soluble tumor necrosis factor receptor 1 (sTNF-R1) (23) and interleukin 18 (IL-18) (24) correlated positively with Hcy levels in patients with type 2 diabetes. Moreover, elevated Hcy levels are associated with increased levels of von Willebrand factor, soluble intercellular adhesion molecule 1, sTNF-R1, and sTNF-R2 (25) in patients with type 1 diabetes.
We recently demonstrated that HHcy promotes circulating inflammatory monocyte (MC) Ly6Cmiddle+high subset differentiation in HHcy mice with (26,27) and without (26) hyperlipidemia. However, how HG affects inflammatory MC differentiation and how HHcy affects inflammatory MC differentiation and contributes to HG-induced atherosclerosis remain unknown.
In the current study, we investigated the causative role of HHcy on HG-induced atherogenesis, MC differentiation and system inflammation. We examined aortic atherosclerotic lesion formation, inflammatory MC and macrophage (MØ) differentiation, and potential biochemical mechanisms in a HHcy+HG mouse model and in cultured primary mouse splenocytes.
Research Design and Methods
HHcy Mouse Model
Tg-hCBS Cbs apolipoprotein E-deficient (ApoE−/−) mice (provided by Dr. Warren D. Kruger, Fox Chase Cancer Center, Philadelphia, PA) were created as described previously (26,28). Hcy is an intermediate amino acid in methionine metabolism that is converted to cysteine by transsulfuration or to methionine by remethylation (29). Cystathionine β-synthase (Cbs) is the rate-limiting enzyme of the transsulfuration pathway that condenses Hcy with serine into cystathionine; thus, a decreased rate of transsulfuration pathway by Cbs knockout can lead to HHcy. However, most Cbs−/− mice have a short life span and die of liver failure before weaning (26). To circumvent this neonatal lethality, Dr. Kruger’s laboratory created a transgenic human CBS (Tg-hCBS) mouse in which the hCBS cDNA is under the control of a Zn-inducible metallothionein promoter (28). By supplying these animals with Zn water during pregnancy and lactation, Tg-hCBS is able to rescue the neonatal lethal phenotype (26). ZnSO4 is withdrawn at weaning, which causes the animals to develop HHcy (26).
HG Mouse Model
Streptozotocin (STZ; 50 mg/kg body weight) was administered intraperitoneally daily in 8-week-old male Tg-hCBS Cbs ApoE−/− mice for 5 days to induce HG (blood glucose [Glu] concentration ≥300 mg/dL). At 10 weeks of age, mice were switched to a high-fat diet (21.0% fat, TD 08028; Harlan Teklad) and/or Zn water for 2 weeks (Fig. 1A). For the blood Glu measurement, study mice were fasted overnight, and blood samples were obtained from the tail vein, collected in HemoCue Glucose 201 Microcuvettes (HemoCue, Brea, CA) and analyzed on a HemoCue Glucose 201 analyzer.
Figure 1.

HHcy and HG exacerbate metabolism and increase heart weights in mice. A: HHcy and HG mouse model. Tg-hCBS Cbs ApoE−/− mice were supplied with drinking water containing Zn that was withdrawn at 4 weeks of age to shut down hCBS expression and cause HHcy. At 8 weeks of age, mice received intraperitoneal sodium nitrate (vehicle CT) or STZ (50 mg/kg body weight) daily for 5 days to induce HG. At 10 weeks of age, mice with confirmed HG were switched to a high-fat diet for 2 weeks and killed. B: Zn-induced Tg-hCBS protein expression. Tg-hCBS Cbs ApoE−/− mice were fed drinking water containing Zn to induce Tg-hCBS gene expression until 4 weeks old. Protein was extracted from the liver and examined for Tg-hCBS protein expression. C: Plasma total Hcy (tHcy) levels. Blood was collected when mice were killed, and tHcy levels were measured. D: Blood Glu levels. Tg-hCBS Cbs−/− ApoE−/− mice treated with STZ showed the highest blood Glu level. To evaluate mouse metabolism status, all of the Tg-hCBS Cbs ApoE−/− mice were monitored for food intake (E), water intake (F), urine secretion (G), and body weight (H) changes after 24 h accommodation in the metabolic cages (Harvard Apparatus, Holliston, MA). Body weight loss, food intake, water consumption, and urine secretion were increased in HHcy and HG mice compared with HG-alone mice. Water intake and urine secretion were significantly increased in HHcy and HG mice. The trend of an increase in stool in HHcy and HG mice was observed but did not reach statistical significance. Weights of spleen (I), heart (J), and liver (K) relative to tibia length were measured when mice were killed. The trend of an increase in spleen weight in HHcy and HG mice was observed but did not reach statistical significance. Heart weights were increased in HHcy and HG mice. Liver weights were increased in HG alone and in HHcy and HG mice. Plasma cholesterol (L), HDL-C (M), LDL-C (N), and TG (O) in Tg-hCBS Cbs ApoE−/− mice. Plain bars represent CT mice. Diagonal bars represent mice on STZ. Measurements are expressed as means ± SD. One-way ANOVA with post hoc Bonferroni was used for analysis (n = 5–16). *P < 0.05, **P < 0.01, and ***P < 0.001. Syn, synergy.
All experiments were conducted in accordance with the National Institutes of Health Guidelines for the Care and Use of Laboratory Animals and with approval from Temple University School of Medicine Institutional Animal Care and Use Committee.
Analysis of Plasma Total Hcy, S-Adenosylmethionine, and S-Adenosylhomocysteine by Liquid Chromatography Tandem Mass Spectrometry
Mice were killed, and blood was withdrawn by a syringe puncturing the heart and centrifuged immediately at 3,000 rpm for 20 min to obtain plasma. The plasma (50 µL) was batched, frozen, and transported to Institute of Metabolic Disease (Dallas, TX). Total plasma Hcy was determined by liquid chromatography-electrospray ionization (ESI) tandem mass spectrometry (LC-ESI-MS/MS), as previously described (30). The analysis of s-adenosylmethionine (SAM) and s-adenosylhomocysteine (SAH) in plasma was performed using stable-isotope dilution LC-ESI-MS/MS, as previously described (31).
Plasma Lipid Determination
Blood was obtained from fasted mice, and the plasma was separated (3,000g for 20 min). Plasma total cholesterol, HDL-cholesterol (C), LDL-C, and triglyceride (TG) were analyzed at the National Mouse Metabolic Phenotyping Center at the University of Massachusetts by Cobas Clinical Chemistry Analyzer (Roche).
Immunohistochemistry Staining for Atherosclerotic Lesion Analysis
To measure the aortic lesion size, mouse aortas were sectioned, stained, and quantified as previously described (27).
Flow Cytometry Analysis for Mononuclear Cell, MC, and MC/MØ Subset Characterization
Mononuclear cells (MNCs), MCs, and MØs from mouse bone marrow (BM), peripheral blood, and spleen were isolated and identified by flow cytometry as previously described (27).
Inflammatory Mediator Measurements
Plasma MCP-1 was analyzed at the National Mouse Metabolic Phenotyping Center at the University of Massachusetts by Luminex (Luminex). Plasma IL-18 was analyzed at the National Mouse Metabolic Phenotyping Center at the University of Massachusetts by ELISA.
In Vitro Studies
Primary Mouse Splenocyte Culture for MC Differentiation
Primary mouse splenocytes from 2-month-old wild-type mice (C57BL/6) were isolated as previously described (27). To examine the effect of l-Hcy and d-Glu on Ly6C+ MC subset differentiation, splenocytes were treated as illustrated in Fig. 7A and analyzed by flow cytometry.
Figure 7.

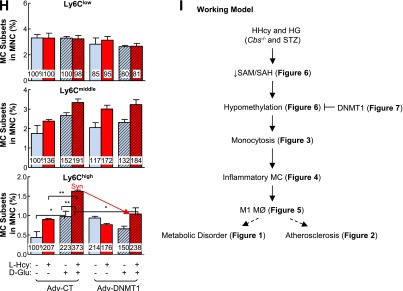
Inflammatory MC subsets are increased in cultured primary mouse splenocytes treated with l-Hcy plus d-Glu, and transduced Adv-DNMT1 reversed-inflammatory MC differentiation. Splenocytes were isolated from 2-month-old C57BL/6 wild-type mice and cultured. Cells were treated with recombinant interferon-γ (rIFNγ; 100 units/mL) at 0 h. After 24 h, l-Hcy (200 μmol/L), d-Glu (25 mmol/L), l-Glu (25 mmol/L), and/or AZC (1 μmol/L) were added for an additional 48 h for the differentiation study. Cells were stained with mouse antibodies against CD11b and Ly6C and analyzed by flow cytometry. CD11b+Ly6Clow, CD11b+Ly6Cmiddle, and CD11b+Ly6Chigh MCs are defined based on CD11b and Ly6C expression levels. A: Schematic design describes the experimental strategies. B: Representative dot plots depict the distribution of MC subsets. C: MC subset quantifications. D: DNMT1 protein levels were examined by Western blotting with antibodies against DNMT1 and normalized with β-actin expression levels. E: DNMT1 activities. For DNMT1 activity assay, nuclear extracts (20 µg) were prepared and incubated with hemimethylated double-stranded DNA for DNMT1 activity in the presence of [3H]SAM. DNMT1 activities were determined by the radioactivity level of DNA substrates. Expression levels of adenoviral DNMT1 protein were examined by Western blotting (F) and flow cytometry (G). For Western blotting, protein levels were detected by using antibodies against mouse DNMT1 and blotted with β-actin antibody. H: Adenoviral DNMT1 rescue effect. Primary mouse splenocytes were infected with Adv-CT or Adv-DNMT1 at 50 MOI for 24 h and then treated with l-Hcy (200 μmol/L) and/or d-Glu (25 mmol/L) for another 48 h. Quantifications of adenoviral DNMT1 rescue effect on MC subset differentiation were depicted. Note that l-Hcy and d-Glu increased CD11b+Ly6Cmiddle and CD11b+Ly6Chigh MC and that this effect was rescued by DNMT1. Plain bars represent CT groups. Diagonal bars represent d-Glu groups. Dotted bars represent l-Glu groups. Data are representative of three separate experiments and are shown as means ± SD. One-way ANOVA with post hoc Bonferroni was used for analysis. I: Working model. *P < 0.05, **P < 0.01, and ***P < 0.001. GFP, green fluorescent protein; SSC, side scatter; Syn, synergy.
DNA Methyltransferase Activity Assay
Primary mouse splenocytes (1.0 × 10⁸) were cultured on 150-mm plates. The cells were treated with mouse recombinant interferon-γ at 0 h and with 200 μmol/L l-Hcy, 25 mmol/L d-Glu, 25 mmol/L l-Glu, and/or 1 μmol/L 5′-azacytidine (AZC) at 24 h for another 48 h. Nuclear extract was prepared, and DNA methyltransferase (DNMT) activity was assessed as described (32).
Adenoviral-Transduced DNMT1 Expression for DNA Methylation Rescuing Test
The recombinant adenoviruses expressing the DNMT1 (Adv-DNMT1) gene were constructed with a replication-defective adenoviral shuttle vector pAdtrack–cytomegalovirus-green fluorescent protein as described (32). Western blotting was done to examine ectopic gene expression using antibodies against DNMT1 (60B1220.1, IMG-261A; IMGENEX, San Diego, CA). The recombinant adenovirus encoding only the green fluorescent protein was used as a control (CT).
Antibodies and Chemicals
l-Hcy was freshly prepared by reducing l-Hcy with onefold molar excess of dithiothreitol for 30 min at 37°C, pH 8.0, as described previously (33). If not otherwise specified, all the fluorescence-conjugated antibodies and isotype CTs were purchased from BD, and all chemicals were purchased from Sigma-Aldrich.
Data Analysis and Statistics
Each experiment was repeated at least 3 times. Statistical analyses were performed with Prism 3.03 software (GraphPad Software, La Jolla, CA). Results are expressed as the means ± SD. Statistical significance, at P ≤ 0.05, was calculated using the Student t test for two comparison groups and one-way ANOVA with Bonferroni correction for more than two comparison groups. Correlations between the variables were performed using Spearman correlation analysis.
Results
Tg-hCBS Cbs−/− ApoE−/− Mice Develop HHcy, Which Is Largely Corrected by Zn-Induced hCBS Expression
Deficiency of the Cbs gene results in HHcy in Tg-hCBS Cbs−/− ApoE−/− mice. The plasma Hcy level was 107 ± 31 μmol/L in Tg-hCBS Cbs−/− ApoE−/− mice (Fig. 1C) and increased to 182 ± 20 μmol/L after daily intraperitoneal injection of STZ for 5 days. Zn supplementation induced hCBS expression effectively (Fig. 1B), and lowered the plasma Hcy level from 107 ± 31 to 13 ± 7 μmol/L in Tg-hCBS Cbs−/− ApoE−/− mice and from 182 ± 20 to 5 ± 2 μmol/L in Tg-hCBS Cbs−/− ApoE−/− mice administered STZ. Thus, HHcy was induced successfully, and Zn-induced hCBS expression was sufficient to correct HHcy.
STZ Injection Induces HG
STZ injection resulted in 443 ± 44 mg/dL blood Glu in Tg-hCBS Cbs+/+ ApoE−/− mice (Fig. 1D). The blood Glu level further increased to 514 ± 112 mg/dL in Tg-hCBS Cbs−/− ApoE−/− mice administered STZ. Zn supplementation reduced the blood Glu level to 440 ± 65 mg/dL in mice administered STZ. Thus, HG was induced successfully, and Zn decreased STZ-induced HG in Tg-hCBS Cbs−/− ApoE−/− mice.
HHcy Exacerbates HG-Induced Metabolic Disorder
HHcy increased HG-induced food intake (Fig. 1E), water intake (Fig. 1F), and urine secretion (Fig. 1G) and decreased HG-induced body weight loss (Fig. 1H). Spleen weights were not changed (Fig. 1I). Heart weights increased in HHcy and HG mice, whereas liver weights increased in HG mice (Fig. 1J and K), suggesting that HHcy and HG may increase inflammation in mouse heart and liver (an undergoing study in the laboratory).
HG Increases Plasma Lipid Profiles
Lipid profiling of Tg-hCBS Cbs ApoE−/− mouse plasma showed higher levels of cholesterol, LDL-C, and TG in Tg-hCBS Cbs−/− ApoE−/− mice administered STZ (Fig. 1L–O).
HHcy Accelerates HG-Induced Atherosclerosis and Atherosclerotic MC and MØ Accumulations
To sensitize the atherogenic effect of HHcy under the HG condition, we crossed Tg-hCBS Cbs−/+ mice with ApoE−/− mice and fed them a high-fat diet for 2 weeks. Atherosclerotic lesions were evaluated on aortic sinus cross-sections stained with Oil Red O staining. HHcy increased lesion area from 10.24 to 14.56 × 104 µm2. HG also increased the lesion size. In the presence of HHcy and HG, there was a significant increase in lesion size (from 14.56 to 42.14 × 104 µm2; Fig. 2A, B, and D). Furthermore, the results from all groups showed that Hcy and Glu both correlated positively with lesion size (Fig. 2F and G), suggesting that HHcy exacerbates HG-induced atherosclerosis. Zn-induced Hcy lowering did not reduce the atherosclerotic lesion area significantly, suggesting the inadequate therapeutic effect of Hcy lowering on atherogenesis in HG.
Figure 2.

HHcy and HG increase atherosclerotic lesion size and increase MC and MØ accumulation in the aortic root of mice. Tg-hCBS Cbs ApoE−/− mice received intraperitoneal sodium nitrate (vehicle CT) or STZ (50 mg/kg body weight) daily for 5 days at 8 weeks old. STZ caused the mice to develop HG (blood Glu ≥300 mg/dL). At 10 weeks old, all mice were switched to a high-fat diet for another 2 weeks and killed. Hearts were isolated from Tg-hCBS Cbs ApoE−/− mice. Cryostat sections (10 µm) were collected and stained with Oil Red O (lipids, red), counterstained with hematoxylin (nuclear, blue), or immunostained with MOMA-2 (MC and MØ marker, red) and counterstained with DAPI (nuclear, blue). Images were acquired by Axioskop 2 plus (Zeiss, Stuttgart, Germany). A: Photomicrographs of mouse aortic sinus cross-sections. Merge shows the accumulation of MC and MØ in the lesion. Quantitative analysis of lesion area (B), MC/MØ area (C), lesion area of the aortic sinuses (D), and MC/MØ area of the aortic sinuses (E). Atherosclerotic lesion areas are defined as the intimal region between the lumen and the internal elastic lumina (IEL). The areas of the lesions were measured with Image-Pro Plus 6.0 software. F: Correlation analysis was performed between plasma Hcy levels and atherosclerotic lesion area from all groups. One data dot represents data from a single mouse. G: Correlation analysis was performed between blood Glu and atherosclerotic lesion area from all groups. Note that atherosclerotic lesion areas and MC and MØ areas were increased in HHcy and HG mice. Plain bars represent CT mice. Diagonal bars represent mice on STZ. Measurements are expressed as means ± SD. One-way ANOVA with post hoc Bonferroni was used for analysis (n = 5–15). *P < 0.05, **P < 0.01, and ***P < 0.001. Syn, synergy; tHcy, total homocysteine.
In addition, we examined MC infiltration into the atherosclerotic lesion by immunofluorescent staining with monoclonal antibodies anti-mouse MOMA-2 (MC and MØ marker). We found that atherosclerotic lesions are abundant with MC and MØ. Indeed, HHcy and HG increased the MC and MØ area from 100% to 185% and 303%, respectively (Fig. 2C and E). Moreover, the combination of HHcy and HG synergistically induced the MC and MØ area to 820% compared with the control mice (i.e., an 8.2-fold induction). Zn-induced Hcy lowering reversed the HG-induced MC and MØ area percentage in the lesion from 386% to 214% (Fig. 2E). This result suggested the causative role of Hcy on HG-induced MC and MØ accumulation in the lesion.
HHcy and HG Synergistically Increase MNC and Total MC in the BM, Peripheral Blood, and Spleen
We studied the MNC and MC populations in the BM, peripheral blood, and spleen. MNC was characterized based on lower granularity and larger cell size (gate ii; Fig. 3A). MC was defined as CD11b+ MNC (Fig. 3C). HHcy increased the MNC population from 24%, 4%, and 12% in BM, peripheral blood, and spleen of Tg-hCBS Cbs+/+ ApoE−/− mice to 38%, 10%, and 19% in Tg-hCBS Cbs−/− ApoE−/− mice, an 1.60-, 3.12-, and 2.48-fold increase, respectively (Fig. 3B). Similarly, HHcy increased the MC population by 2.87-, 4.11-, and 3.96-fold in these three tissue compartments (Fig. 3D). HG dramatically induced the MC population by 4.11-, 6.80-, and 5.06-fold in the BM, peripheral blood, and spleens of HG mice. Interestingly, the combination of HHcy and HG synergistically increased MNC by 2.05-, 4.08- and 7.40-fold and elevated MC by 12.29-, 6.84-, and 16.36-fold in the BM, peripheral blood, and spleens of STZ-treated HHcy mice, respectively.
Figure 3.

HHcy and HG synergistically increase MNCs and monocytosis in BM, peripheral blood, and spleen of mice. Tg-hCBS Cbs ApoE−/− mice received intraperitoneal sodium nitrate (vehicle CT) or STZ (50 mg/kg body weight) daily for 5 days at 8 weeks old. STZ caused the mice to develop HG (blood Glu ≥300 mg/dL). At 10 weeks old, all mice were switched to a high-fat diet for 2 weeks and killed. BM, peripheral blood, and spleen cells were isolated, stained with anti-CD11b mouse antibody, and analyzed by flow cytometry. A: Representative MNC and MC dot plots depict nucleated cells (gate i) and MNCs (gate ii). B: Quantitative analyses of total MNC in BM, peripheral blood, and spleen are shown in bar graphs. C: Representative histograms depict MC identified as CD11b+ MNC. D: Quantitative analyses of MC in BM, peripheral blood, and spleen are shown in bar graphs. Note that MNCs and MCs were increased in HHcy and HG mice. Measurements are expressed as means ± SD. One-way ANOVA with post hoc Bonferroni was used for analysis (n = 8–16). *P < 0.05, **P < 0.01, and ***P < 0.001. FSC, forward scatter; IgG, mouse CD11b IgG isotype antibody control; SSC, side scatter; Syn, synergy.
Zn-induced Hcy-lowering reversed the effect of HHcy on MNC induction in the spleen and MC induction in all three tissues.
HHcy and HG Synergistically Elevate Inflammatory MC Subsets in the BM, Peripheral Blood, and Spleen
To test the effect of HHcy and HG on MC subset differentiation, we characterized MC subsets by flow cytometry using antibodies against CD11b, an MC marker, and Ly6C, an inflammatory MC marker. MCs were divided into three subsets by Ly6C expression levels (CD11b+Ly6Clow, CD11b+Ly6Cmiddle, and CD11b+Ly6Chigh; Fig. 4A). We examined intracellular superoxide level by dihydroethidium staining, a reactive oxygen species indicator, combined with flow cytometry analysis (Fig. 4B). We found that more Ly6Chigh MCs (18.3%) were under oxidative stress compared with Ly6Cmiddle (4.44%) and Ly6Clow (0.53%) cells (Fig. 4D). We also performed intracellular TNF-α staining by flow cytometry to characterize inflammatory feature of these subsets and found that Ly6Cmiddle+high MC expressed higher levels of TNF-α, an inflammatory cytokine (Fig. 4C and E).
Figure 4.


HHcy and HG induce inflammatory MC subsets in BM, peripheral blood, and spleen of mice. Tg-hCBS Cbs ApoE−/− mice received intraperitoneal sodium nitrate (vehicle CT) or STZ (50 mg/kg body weight) for 5 consecutive days at 8 weeks old. STZ caused the mice to develop HG (blood Glu ≥300 mg/dL). At 10 weeks old, all mice were switched to a high-fat diet for an additional 2 weeks and killed. BM, peripheral blood, and spleen cells were isolated, stained with anti-CD11b and anti-Ly6C mouse antibodies, and analyzed by flow cytometry. A: Representative nucleated cells, MNC, and MC subset dot plots depict nucleated cells (gate i) and MNCs (gate ii). MNCs are further divided into three subsets: CD11b+Ly6Clow, CD11b+Ly6Cmiddle, and CD11b+Ly6Chigh. B: Superoxide anion levels of different MC subsets were examined by flow cytometry with a free radical sensor, dihydroethidium (DHE). Ly6Chigh MCs, Ly6Cmiddle MCs, and Ly6Clow MCs have the highest, second highest, and lowest levels of superoxide anion, respectively. C: Cells from BM, peripheral blood, and spleen were treated with lipopolysaccharide (0.1 μg/mL) and a Golgi blocker, brefeldin A (1 μL/mL), for 5 h and then stained with antibody against mouse TNF-α and analyzed by flow cytometry. Note that Ly6Cmiddle+high MCs have larger TNF-α+ cell populations than Ly6Clow MCs. D: Quantitative analysis of DHE+ cells in Ly6Clow, Ly6Cmiddle, and Ly6Chigh from spleen. E: Quantitative analyses of TNF-α+ cells in Ly6Clow and Ly6Cmiddle+high from BM, peripheral blood, and spleen are shown in bar graphs. CD11b+Ly6Cmiddle+high MCs have higher TNF-α+ cell percentage. F: Representative MC subset dot plots depict MC subsets in different mouse groups. G: Quantitative analyses of MC subsets in BM, peripheral blood, and spleen are shown in bar graphs. Note that CD11b+Ly6Cmiddle and/or CD11b+Ly6Chigh MC subsets were increased in HHcy and HG mice. Values represent means ± SD. Independent t test (E) or one-way ANOVA (D and G) were used for analysis (n = 8–16). *P < 0.05, **P < 0.01, and ***P < 0.001. FSC, forward scatter; IgG, TNF-α IgG isotype antibody control; SSC, side scatter; Syn, synergy.
HHcy increased Ly6Cmiddle and Ly6Chigh MC by 1.35- and 1.38-fold in BM, by 1.48- and 2.83-fold in peripheral blood, and by 3.20- and 4.58-fold in the spleen in Tg-hCBS Cbs−/− ApoE−/− mice, respectively (Fig. 4F and G). HG also boosted Ly6Cmiddle+high from 44% and 22% to 59% and 26%, in BM and peripheral blood in STZ-receiving mice, respectively. The combination of HHcy and HG promoted the inflammatory MC subsets (Ly6Cmiddle and Ly6Chigh) by 1.53- and 1.67-; 2.34- and 3.98-; and 3.32- and 4.72-fold in the three peripheral tissues in Tg-hCBS Cbs−/− ApoE−/− mice with STZ, respectively. Hcy lowering prevented the increase of Ly6Cmiddle and Ly6Chigh populations in all three tissues in Tg-hCBS Cbs−/− ApoE−/− mice with and without HG. Thus, HHcy and HG increased Ly6Cmiddle and Ly6Chigh inflammatory MC subsets in BM, peripheral blood, and spleen.
HHcy and HG Synergistically Promote MC-Derived M1 MØ Polarization in BM, Peripheral Blood, and Spleen
MØs are derived from MCs and are the main effector cell in atherosclerotic plaque to drive inflammatory response. We assessed the MØ population by priming cells with lipopolysaccharide for 5 h and analyzing via flow cytometry (Fig. 5A). MØ subsets were characterized based on F4/80 (MØ marker), TNF-α (M1 MØ marker) and mannose receptor (MR; M2 MØ marker) expression. M1 MØ was identified as F4/80+TNF-α+ cells. M2 MØ was identified as F4/80+MR+ (Fig. 5B and D). HHcy increased MC-derived M1 MØ by 2.19-, 1.85-, and 2.49- fold and decreased MC-derived M2 MØs by 0.52-, 0.78-, and 0.91-fold in BM, peripheral blood, and spleen in Tg-hCBS Cbs−/− ApoE−/− mice, respectively (Fig. 5E and F). HG also pushed the MØ polarization toward M1 MØ (2.92-, 1.49-, and 2.82- fold) in respective tissues in mice treated with STZ. HHcy and HG synergistically increased M1 MØ by 4.10-, 3.95-, and 3.38-fold and decreased M2 MØ by 0.26-, 0.33-, and 0.43-fold in respective tissues in Tg-hCBS Cbs−/− ApoE−/− mice with HG. Zn-induced Hcy lowering effectively abolished the effect of HHcy and HG on the MC-derived M1 MØ increase in BM. Hence, HHcy and HG favored MØ polarization toward M1 in Tg-hCBS Cbs ApoE−/− mice.
Figure 5.
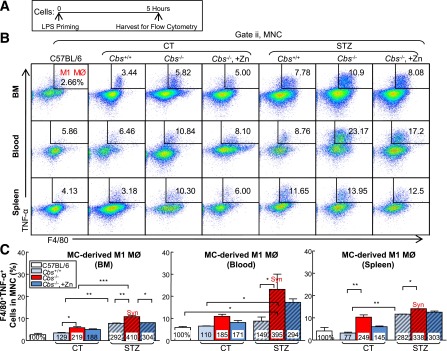

HHcy and HG increase M1 MØ and decrease M2 MØ in BM, peripheral blood and spleen of mice. A: Schematic design describing the experimental strategies. Tg-hCBS Cbs ApoE−/− mice received intraperitoneal sodium nitrate (vehicle CT) or STZ (50 mg/kg body weight) daily for 5 days at 8 weeks old. STZ caused the mice to develop HG (blood Glu ≥300 mg/dL). At 10 weeks old, all mice were switched to a high-fat diet for 2 weeks and killed. Cells from mouse BM, peripheral blood, and spleen were incubated with lipopolysaccharide (LPS; 0.1 μg/mL) for 5 h. Suspended cells were stained with mouse antibodies against F4/80 (MØ marker), TNF-α (proinflammatory MØ marker), mannose receptor (anti-inflammatory MØ marker), and assayed by flow cytometry. Two cellular populations, M1 MØ (F4/80+TNF-α+) and M2 MØ (F4/80+MR+), were analyzed separately. B and C: Representative dot plots and quantification of cell suspensions depicting M1 MØ. D and E: Representative dot plots and quantification of M2 MØ in BM, peripheral blood, and spleen. Note that M1 MØs were increased in HHcy and HG mice, whereas M2 MØs were decreased in HHcy and HG mice. The level of MCP-1 (F) and IL-18 (G) in plasma by Luminex and ELISA, respectively. H: Mouse MC and MØ subset differentiation and functions. In the steady state, Ly6Chigh MC differentiate into Ly6Clow MC in the circulation. Ly6Clow MC patrol and are recruited into normal tissues and become M2 MØ. Ly6Chigh MC have a high antimicrobial capability due to their potent capacity of producing reactive oxygen species (ROS) and proinflammatory cytokines. During vascular inflammation, Ly6Chigh MC invade the vessel and polarize to inflammatory M1 MØ, which are characterized by secretion of proinflammatory cytokines. Plain bars represent CT mice. Diagonal bars represent mice on STZ. Values represent means ± SD. One-way ANOVA with post hoc Bonferroni was used for analysis (n = 5–8). *P < 0.05, **P < 0.01, and ***P < 0.001. Syn, synergy.
HHcy and HG Synergistically Increase MCP-1 in Mouse Plasma
MCP-1 is one of the key chemokines that regulate migration and infiltration of MC and MØ in response to inflammation (34). IL-18 is a highly proinflammatory cytokine activated and released from inflammasome (35). To detect these inflammatory markers in the Tg-hCBS Cbs ApoE−/− mice, we collected plasma from five mice in each group and compared the results. The Tg-hCBS Cbs−/− ApoE−/− mice on STZ had higher MCP-1 plasma levels compared with Tg-hCBS Cbs−/− ApoE−/− mice or Tg-hCBS Cbs+/+ ApoE−/− mice on STZ (Fig. 5F). Zn-induced Hcy lowering reversed MCP-1 plasma levels in Tg-hCBS Cbs−/− ApoE−/− mice on STZ (Fig. 5F). IL-18 measurement showed HHcy and HG both increased its levels in mouse plasma (Fig. 5G). Thus, we proposed the MC and MØ subset differentiation model shown in Fig. 5H.
Plasma SAM-to-SAH Ratio Is Negatively Correlated With Hcy Levels and Inflammatory MC Percentage in BM, Peripheral Blood, and Spleen
The SAM-to-SAH ratio is a recognized indicator for methylation status. We examined plasma SAM and SAH levels and the correlation of the SAM-to-SAH ratio with Hcy levels and inflammatory MC populations. Using linear regression analysis, we found that the Hcy level correlated negatively with the SAM-to-SAH ratio (Fig. 6A), as did the blood Glu level (Fig. 6B). A positive linear regression relationship was identified between plasma Hcy levels and Ly6Cmiddle+high MC and BM, peripheral blood, and spleen M1 MØ counts (Fig. 6C and E). In contrast, the SAM-to-SAH ratio was negatively correlated with Ly6Cmiddle+high MCs and M1 MØs (Fig. 6D and F) suggesting a negative association exists between methylation levels and inflammatory MC and MØ subset populations.
Figure 6.

Inflammatory MC and MØ subset populations are positively correlated with plasma Hcy concentrations and negatively correlated with plasma SAM-to-SAH ratios in Tg-hCBS Cbs ApoE−/− mice. Tg-hCBS Cbs ApoE−/− mice received intraperitoneal sodium nitrate (vehicle CT) or STZ (50 mg/kg body weight) daily for 5 days at 8 weeks old. STZ caused the mice to develop HG (blood Glu ≥300 mg/dL). At 10 weeks old, all mice were switched to a high-fat diet for 2 weeks. Fasting Glu levels were measured by HemoCue Glucose 201 (HemoCue Ab, Angelholm, Sweden) before mice were killed. Blood was collected when the mice were killed, and the supernatant was kept at −80°C immediately after centrifugation. Hcy, SAM, and SAH levels were measured by high-performance liquid chromatography (Dr. Teodoro Bottiglieri, Baylor University, Waco, TX). MC subsets were measured as described in Fig 3. A: Correlation between SAM-to-SAH and Hcy. Linear regression analysis was performed between plasma SAM-to-SAH ratios and Hcy. B: Correlation between plasma SAM-to-SAH ratios and Glu were assessed with linear regression analysis. C: Correlations between plasma Hcy levels and Ly6Cmiddle+high MC percentages in mouse BM, peripheral blood, and spleen. Each data point represents one mouse. D: Correlations between plasma SAM-to-SAH ratios and Ly6Cmiddle+high MC percentages in mouse BM, peripheral blood, and spleen. Each data point represents one mouse. Note that SAM-to-SAH ratios were negatively correlated with CD11b+Ly6Cmiddle+high cell percentages in all three tissues. E: Correlations between plasma Hcy levels and M1 MØ percentages in mouse BM, peripheral blood, and spleen. Each data point represents one mouse. F: Correlations between plasma SAM-to-SAH ratios and M1 MØ percentages in mouse BM, peripheral blood, and spleen. Each data point represents one mouse. Note that SAM-to-SAH ratios were negatively correlated with M1 MØ percentages in all three tissues. Probability values are from independent t test (n = 11–21). Syn, synergy.
l-Hcy and d-Glu Synergistically Increase Inflammatory MC Differentiation in Cultured Primary Mouse Splenocytes
To study the mechanisms of HHcy and HG on MC differentiation, we established a cellular model by culturing primary mouse splenocytes from 2-month-old C57BL/6 mice for 72 h (Fig. 7A) and priming the cells with recombinant interferon-γ. We found that l-Hcy (200 μmol/L) increased inflammatory CD11b+Ly6Cmiddle and CD11b+Ly6Chigh MC populations by 1.60- and 1.96-fold, respectively (Fig. 7B and C). d-Glu (25 mmol/L) increased inflammatory CD11b+Ly6Cmiddle and CD11b+Ly6Chigh MC populations by 2.00- and 1.92-fold, respectively. The combination of l-Hcy and d-Glu increased Ly6Cmiddle and Ly6Chigh MC by 2.43-fold. l-Glu, an osmotic pressure CT, did not have the same effect. AZC, a DNA methylation inhibitor, similarly increased inflammatory CD11b+Ly6Cmiddle and CD11b+Ly6Chigh MC differentiation by more than twofold. Thus, l-Hcy, d-Glu, and the combination of both promoted inflammatory MC differentiation in cultured primary mouse splenocytes, which was mimicked by a DNA methylation inhibitor, AZC.
l-Hcy and d-Glu Synergistically Decrease DNMT1 Activity in Cultured Primary Mouse Splenocytes
DNMT1 protein levels were not changed by l-Hcy and d-Glu treatment (Fig. 7D). In contrast, DNMT1 activity was reduced to 45% in l-Hcy– and d-Glu–treated primary mouse splenocytes compared with that of cells treated with d-Glu alone (Fig. 7E).
DNMT1 Reduces l-Hcy– and d-Glu–Induced Inflammatory MC Differentiation in Cultured Primary Mouse Splenocytes
To further elucidate if DNA hypomethylation mediates HHcy+HG-induced inflammatory MC differentiation, we preincubated primary mouse splenocytes with Adv-DNMT1 (Fig. 7F and G) and examined the inflammatory MC differentiation after l-Hcy and d-Glu treatment. Adv-DNMT1 (50 MOI) reduced the Ly6Chigh subset induced by l-Hcy from 207% to 176% in the l-Hcy–treated group and from 373% to 238% in l-Hcy+d-Glu–treated group, and had no significant effect on this population in d-Glu–treated MCs (Fig. 7H). Thus, DNMT1 partially rescued l-Hcy–induced inflammatory MC differentiation in the absence and presence of d-Glu in cultured primary mouse splenocytes.
Discussion
In this report, we examined the causative role of HHcy in HG-induced atherogenesis and MC and MØ differentiation by using a model system consisting of HHcy and HG. We also assessed underlying mechanisms in mouse primary splenocytes. We found that HHcy increased HG-induced atherosclerosis, lesion MC/MØ content, and monocytosis, inflammatory Ly6Cmiddle+high MC and M1 MØ differentiation, but reduced the anti-inflammatory M2 MØ subset in peripheral tissues in mice. Hcy levels and inflammatory MC/MØ populations are negatively correlated with the plasma SAM-to-SAH ratio, an indicator of methylation. Finally, l-Hcy (200 μmol/L) and d-Glu (25 mmol/L) synergistically increased inflammatory MC subset differentiation and decreased DNMT1 activity in cultured primary mouse splenocytes. These effects were mimicked by a DNA methylation inhibitor, AZC, and reversed by transduced Adv-DNMT1 expression. We therefore conclude that HHcy promotes MC and MØ differentiation toward the inflammatory subsets and accelerates HG-induced atherosclerosis at least partially by DNA hypomethylation. Most of the epidemiological studies (4–6,8–11,13,25,36,37) only connected HHcy with microvascular diseases in type 1 and type 2 diabetes. Our study is the first to demonstrate that HHcy promotes HG-induced atherosclerosis and inflammatory MC and MØ differentiation.
To the best of our knowledge, we are the first to report that HHcy increased blood Glu in STZ-treated mice (Fig. 1D). This effect can be explained by HHcy-associated renal dysfunction (38). Impaired renal function slows the elimination of Glu into the urine and thus increases the blood Glu levels.
STZ-treated mice had increased cholesterol, LDL-C, and TG, and Zn supplement reversed it (Fig. 1L–O). The effect of STZ could be explained by impaired lipoprotein lipase activity and LDL receptor (LDLR) functions due to STZ-induced insulin deficiency (39). The tendency of Zn to reverse all of the increases might involve its increasing adipose depot mass function (40).
Our present work extended the knowledge discovered from our laboratory (26,27). We showed here inflammatory MC contribute not only to HHcy-induced atherosclerosis but also to this process in HG. We found that HG increased MNC, MC, inflammatory MC, and inflammatory BM-derived, peripheral blood-derived, and spleen MØ in mice (Fig. 2–5). We also found that the combination of HHcy and HG selectively increased inflammatory MC/MØ differentiation in peripheral tissues and worsened atherosclerosis. Our data supported the notion that CD11b+Ly6Cmiddle+high MC is inflammatory MC because it produced higher levels of the proinflammatory cytokine TNF-α and superoxide anion upon lipopolysaccharide stimulation (Fig. 4C and D). This is supported by the fact that Ly6Cmiddle+high MC preferentially infiltrates into atherosclerotic lesions and exacerbates atherosclerosis (41). We believe that increased circulating Ly6Cmiddle+high MC in HHcy and HG mice is an important causative factor in HG-induced atherosclerosis. Active studies are underway to determine whether HHcy causes inflammatory MC differentiation in type 2 diabetes.
We proved that HHcy is a promising therapeutic target for atherosclerosis in diabetic patients. Our HHcy+HG mouse model developed 182 μmol/L plasma Hcy (Fig. 1C), and our in vitro 200 μmol/L l-Hcy dose is relevant to CBS-deficient patients, who could develop 155–471 μmol/L circulating Hcy levels (42). The induction of hCBS expression effectively lowered plasma Hcy level and partially reduced HHcy and HG-induced lesion MC and MØ content along with MNC, MC, and inflammatory MC/MØ counts in the peripheral tissues. We observed Hcy-lowering treatment had a tendency to reverse HG-induced atherosclerotic lesions. That no significant reduction in atherosclerotic lesions was found may be due to short duration of the Zn treatment (2 weeks). We think longer Hcy-lowering treatment would be beneficial for prevention and treatment of diabetic atherosclerosis.
Our data provide strong evidence supporting the causative role of HHcy in promoting HG-induced inflammatory MC and MØ differentiation because HHcy-lowering treatment largely prevented this induction. This is consistent with Hcy-lowering studies in Cbs-deficient mice in which lowering Hcy levels in plasma completely reversed inflammatory MC subsets in vessel and peripheral tissues (26,27). Our Hcy-lowering strategy by supplementing Zn in water demonstrated its possible anti-inflammation benefits. Moreover, MC and MØ differentiation may not be the sole target of HHcy+HG. Studies are underway to determine whether HHcy+HG affects endothelial cell proliferation, function, and death.
Our previous findings provided inflammation as a mechanism to explain the possibly causative role of inflammatory MC in accelerating CVD (26,27). More Ly6Chigh inflammatory MCs were found in aortas and lesions from HHcy mice, which produced increased levels of TNF-α, IL-6, and superoxide anion and might accelerate atherogenesis. A connection between inflammation and diabetic macrovascular disease has also been suggested indirectly because IL-18 (24), von Willebrand factor, soluble intercellular adhesion molecule-1, sTNF-R1, and sTNF-R2 (23,25) were associated with HHcy in diabetic patients. We found a more direct and critical contribution of MC-derived inflammation in HHcy-induced atherogenesis in HG. We demonstrated that HHcy and HG synergistically increased lesion MC and MØ accumulation (Fig. 2B–E) and that inflammatory MC produced increased levels of TNF-α and superoxide anion (Fig. 4B–E).
Finally, we provided evidence supporting DNA hypomethylation as a biochemical mechanism determining HHcy+HG-induced MC and MØ differentiation toward an inflammatory lineage. We found positive correlation of HHcy and HG with a reduced SAM-to-SAH ratio, an indicator of methylation (Fig. 6A). This is consistent with our findings (32) and others’ (32,43–46) in which HHcy or HG (47–50) can induce DNA hypomethylation. Here, Adv-DNMT1 transduction reversed Ly6Chigh induction in HHcy+HG-treated primary mouse splenocytes and also demonstrated the possible benefit of increasing DNA methylation status (Fig. 6E and F). Our data suggest that reversing DNA hypomethylation may be a therapeutic target in inflammatory diseases.
In conclusion, we provide evidence of the role and mechanism of HHcy in HG-induced atherosclerosis and inflammatory MC and MØ differentiation, as illustrated in Fig. 7I, and propose inflammatory MC and MØ differentiation as a potential causative factor in HHcy+HG-induced atherosclerosis.
Article Information
Acknowledgments. The authors acknowledge the technical contributions of Dr. Donghua Yang, Fox Chase Cancer Center Biosample Repository Facility, for immunohistochemical staining.
Funding. This work was supported in part by National Institutes of Health grants HL077288, HL110764, and HL117654 (H.W.) and HL108910 and HL116917 (X-f.Y.).
Duality of Interest. No potential conflicts of interest relevant to this article were reported.
Author Contributions. P.F. and H.W. contributed to the writing and editing of the manuscript. D.Z., Z.C., C.Y., X.J., E.T.C., Y.H., and X-f.Y. contributed to discussion. W.D.K. and S.M. conducted genotyping. E.A. and T.B. performed Hcy, SAM, and SAH measurements. P.F. and H.W. are the guarantors of this work and, as such, had full access to all the data in the study and take responsibility for the integrity of the data and the accuracy of the data analysis.
Prior Presentation. Parts of this study were presented at in Arteriosclerosis, Thrombosis and Vascular Biology Scientific Sessions, Chicago, IL, 28–30 April 2011 and Experimental Biology 2012, San Diego, CA, 21–25 April 2012.
References
- 1.Selhub J, Jacques PF, Bostom AG, et al. Association between plasma homocysteine concentrations and extracranial carotid-artery stenosis. N Engl J Med 1995;332:286–291 [DOI] [PubMed] [Google Scholar]
- 2.Stühlinger MC, Oka RK, Graf EE, et al. Endothelial dysfunction induced by hyperhomocyst(e)inemia: role of asymmetric dimethylarginine. Circulation 2003;108:933–938 [DOI] [PubMed] [Google Scholar]
- 3.Smulders YM, Rakic M, Slaats EH, et al. Fasting and post-methionine homocysteine levels in NIDDM. Determinants and correlations with retinopathy, albuminuria, and cardiovascular disease. Diabetes Care 1999;22:125–132 [DOI] [PubMed] [Google Scholar]
- 4.Hofmann MA, Kohl B, Zumbach MS, et al. Hyperhomocyst(e)inemia and endothelial dysfunction in IDDM. Diabetes Care 1998;21:841–848 [DOI] [PubMed] [Google Scholar]
- 5.Hoogeveen EK, Kostense PJ, Beks PJ, et al. Hyperhomocysteinemia is associated with an increased risk of cardiovascular disease, especially in non-insulin-dependent diabetes mellitus: a population-based study. Arterioscler Thromb Vasc Biol 1998;18:133–138 [DOI] [PubMed] [Google Scholar]
- 6.Soinio M, Marniemi J, Laakso M, Lehto S, Rönnemaa T. Elevated plasma homocysteine level is an independent predictor of coronary heart disease events in patients with type 2 diabetes mellitus. Ann Intern Med 2004;140:94–100 [DOI] [PubMed] [Google Scholar]
- 7.Hoogeveen EK, Kostense PJ, Jakobs C, et al. Hyperhomocysteinemia increases risk of death, especially in type 2 diabetes : 5-year follow-up of the Hoorn Study. Circulation 2000;101:1506–1511 [DOI] [PubMed] [Google Scholar]
- 8.Okada E, Oida K, Tada H, et al. Hyperhomocysteinemia is a risk factor for coronary arteriosclerosis in Japanese patients with type 2 diabetes. Diabetes Care 1999;22:484–490 [DOI] [PubMed] [Google Scholar]
- 9.Brazionis L, Rowley K, Sr, Itsiopoulos C, Harper CA, O’Dea K. Homocysteine and diabetic retinopathy. Diabetes Care 2008;31:50–56 [DOI] [PubMed] [Google Scholar]
- 10.Hoogeveen EK, Kostense PJ, Eysink PE, et al. Hyperhomocysteinemia is associated with the presence of retinopathy in type 2 diabetes mellitus: the Hoorn study. Arch Intern Med 2000;160:2984–2990 [DOI] [PubMed] [Google Scholar]
- 11.Buysschaert M, Dramais AS, Wallemacq PE, Hermans MP. Hyperhomocysteinemia in type 2 diabetes: relationship to macroangiopathy, nephropathy, and insulin resistance. Diabetes Care 2000;23:1816–1822 [DOI] [PubMed] [Google Scholar]
- 12.Vaccaro O, Ingrosso D, Rivellese A, Greco G, Riccardi G. Moderate hyperhomocysteinaemia and retinopathy in insulin-dependent diabetes. Lancet 1997;349:1102–1103 [DOI] [PubMed] [Google Scholar]
- 13.Neugebauer S, Baba T, Kurokawa K, Watanabe T. Defective homocysteine metabolism as a risk factor for diabetic retinopathy. Lancet 1997;349:473–474 [DOI] [PubMed] [Google Scholar]
- 14.House AA, Eliasziw M, Cattran DC, et al. Effect of B-vitamin therapy on progression of diabetic nephropathy: a randomized controlled trial. JAMA 2010;303:1603–1609DOI: 10.1001/jama.2010.490 [DOI] [PubMed] [Google Scholar]
- 15.Ray JG, Kearon C, Yi Q, et al. Heart Outcomes Prevention Evaluation 2 (HOPE-2) Investigators . Homocysteine-lowering therapy and risk for venous thromboembolism: a randomized trial. Ann Intern Med 2007;146:761–767 [DOI] [PubMed] [Google Scholar]
- 16.Song Y, Cook NR, Albert CM, Van Denburgh M, Manson JE. Effect of homocysteine-lowering treatment with folic Acid and B vitamins on risk of type 2 diabetes in women: a randomized, controlled trial. Diabetes 2009;58:1921–1928 [DOI] [PMC free article] [PubMed] [Google Scholar]
- 17.Wiltshire EJ, Gent R, Hirte C, Pena A, Thomas DW, Couper JJ. Endothelial dysfunction relates to folate status in children and adolescents with type 1 diabetes. Diabetes 2002;51:2282–2286 [DOI] [PubMed] [Google Scholar]
- 18.Coussens LM, Zitvogel L, Palucka AK. Neutralizing tumor-promoting chronic inflammation: a magic bullet? Science 2013;339:286–291 [DOI] [PMC free article] [PubMed] [Google Scholar]
- 19.Rehermann B. Pathogenesis of chronic viral hepatitis: differential roles of T cells and NK cells. Nat Med 2013;19:859–868 [DOI] [PMC free article] [PubMed] [Google Scholar]
- 20.Lamkanfi M, Dixit VM. Inflammasomes and their roles in health and disease. Annu Rev Cell Dev Biol 2012;28:137–161 [DOI] [PubMed] [Google Scholar]
- 21.Odegaard JI, Chawla A. Pleiotropic actions of insulin resistance and inflammation in metabolic homeostasis. Science 2013;339:172–177 [DOI] [PMC free article] [PubMed] [Google Scholar]
- 22.Libby P, Lichtman AH, Hansson GK. Immune effector mechanisms implicated in atherosclerosis: from mice to humans. Immunity 2013;38:1092–1104 [DOI] [PMC free article] [PubMed] [Google Scholar]
- 23.Taniguchi A, Fukushima M, Nakai Y, et al. Soluble tumor necrosis factor receptor 1 is strongly and independently associated with serum homocysteine in nonobese Japanese type 2 diabetic patients. Diabetes Care 2006;29:949–950 [DOI] [PubMed] [Google Scholar]
- 24.Aso Y, Okumura K, Takebayashi K, Wakabayashi S, Inukai T. Relationships of plasma interleukin-18 concentrations to hyperhomocysteinemia and carotid intimal-media wall thickness in patients with type 2 diabetes. Diabetes Care 2003;26:2622–2627 [DOI] [PubMed] [Google Scholar]
- 25.Targher G, Zenari L, Bertolini L, Falezza G, Muggeo M, Zoppini G. Plasma total homocysteine levels are associated with von Willebrand factor, soluble intercellular adhesion molecule-1, and soluble tumor necrosis factor-alpha receptors in young type 1 diabetic patients without clinical evidence of macrovascular complications. Diabetes Care 2001;24:1496–1497 [DOI] [PubMed] [Google Scholar]
- 26.Zhang D, Jiang X, Fang P, et al. Hyperhomocysteinemia promotes inflammatory monocyte generation and accelerates atherosclerosis in transgenic cystathionine beta-synthase-deficient mice. Circulation 2009;120:1893–1902 [DOI] [PMC free article] [PubMed] [Google Scholar]
- 27.Zhang D, Fang P, Jiang X, et al. Severe hyperhomocysteinemia promotes bone marrow-derived and resident inflammatory monocyte differentiation and atherosclerosis in LDLr/CBS-deficient mice. Circ Res 2012;111:37–49 [DOI] [PMC free article] [PubMed] [Google Scholar]
- 28.Wang L, Jhee KH, Hua X, DiBello PM, Jacobsen DW, Kruger WD. Modulation of cystathionine beta-synthase level regulates total serum homocysteine in mice. Circ Res 2004;94:1318–1324 [DOI] [PubMed] [Google Scholar]
- 29.Watanabe M, Osada J, Aratani Y, et al. Mice deficient in cystathionine beta-synthase: animal models for mild and severe homocyst(e)inemia. Proc Natl Acad Sci U S A 1995;92:1585–1589 [DOI] [PMC free article] [PubMed] [Google Scholar]
- 30.Ducros V, Belva-Besnet H, Casetta B, Favier A. A robust liquid chromatography tandem mass spectrometry method for total plasma homocysteine determination in clinical practice. Clin Chem Lab Med 2006;44:987–990 [DOI] [PubMed] [Google Scholar]
- 31.Inoue-Choi M, Nelson HH, Robien K, et al. One-carbon metabolism nutrient status and plasma S-adenosylmethionine concentrations in middle-aged and older Chinese in Singapore. Int J Mol Epidemiol Genet 2012;3:160–173 [PMC free article] [PubMed] [Google Scholar]
- 32.Jamaluddin MD, Chen I, Yang F, et al. Homocysteine inhibits endothelial cell growth via DNA hypomethylation of the cyclin A gene. Blood 2007;110:3648–3655 [DOI] [PMC free article] [PubMed] [Google Scholar]
- 33.Zimny J, Sikora M, Guranowski A, Jakubowski H. Protective mechanisms against homocysteine toxicity: the role of bleomycin hydrolase. J Biol Chem 2006;281:22485–22492 [DOI] [PubMed] [Google Scholar]
- 34.Goldberg MD, Lo RC, Abele S, Macka M, Gomez FA. Development of microfluidic chips for heterogeneous receptor-ligand interaction studies. Anal Chem 2009;81:5095–5098 [DOI] [PubMed] [Google Scholar]
- 35.Walsh JG, Muruve DA, Power C. Inflammasomes in the CNS. Nat Rev Neurosci 2014;15:84–97 [DOI] [PubMed] [Google Scholar]
- 36.Wile DJ, Toth C. Association of metformin, elevated homocysteine, and methylmalonic acid levels and clinically worsened diabetic peripheral neuropathy. Diabetes Care 2010;33:156–161 [DOI] [PMC free article] [PubMed] [Google Scholar]
- 37.Meigs JB, Jacques PF, Selhub J, et al. Framingham Offspring Study . Fasting plasma homocysteine levels in the insulin resistance syndrome: the Framingham offspring study. Diabetes Care 2001;24:1403–1410 [DOI] [PubMed] [Google Scholar]
- 38.Muntner P, Hamm LL, Kusek JW, Chen J, Whelton PK, He J. The prevalence of nontraditional risk factors for coronary heart disease in patients with chronic kidney disease. Ann Intern Med 2004;140:9–17 [DOI] [PubMed] [Google Scholar]
- 39.Ginsberg HN. Lipoprotein physiology in nondiabetic and diabetic states. Relationship to atherogenesis. Diabetes Care 1991;14:839–855 [DOI] [PubMed] [Google Scholar]
- 40.Kang X, Zhong W, Liu J, et al. Zinc supplementation reverses alcohol-induced steatosis in mice through reactivating hepatocyte nuclear factor-4alpha and peroxisome proliferator-activated receptor-alpha. Hepatology 2009;50:1241–1250 [DOI] [PMC free article] [PubMed] [Google Scholar]
- 41.Swirski FK, Libby P, Aikawa E, et al. Ly-6Chi monocytes dominate hypercholesterolemia-associated monocytosis and give rise to macrophages in atheromata. J Clin Invest 2007;117:195–205 [DOI] [PMC free article] [PubMed] [Google Scholar]
- 42.Stabler SP, Steegborn C, Wahl MC, et al. Elevated plasma total homocysteine in severe methionine adenosyltransferase I/III deficiency. Metabolism 2002;51:981–988 [DOI] [PubMed] [Google Scholar]
- 43.Ingrosso D, Cimmino A, Perna AF, et al. Folate treatment and unbalanced methylation and changes of allelic expression induced by hyperhomocysteinaemia in patients with uraemia. Lancet 2003;361:1693–1699 [DOI] [PubMed] [Google Scholar]
- 44.Linhart HG, Troen A, Bell GW, et al. Folate deficiency induces genomic uracil misincorporation and hypomethylation but does not increase DNA point mutations. Gastroenterology 2009;136:227–235.e3 [DOI] [PMC free article] [PubMed]
- 45.James SJ, Melnyk S, Pogribna M, Pogribny IP, Caudill MA. Elevation in S-adenosylhomocysteine and DNA hypomethylation: potential epigenetic mechanism for homocysteine-related pathology. J Nutr 2002;132(Suppl.):2361S–2366S [DOI] [PubMed] [Google Scholar]
- 46.Jamaluddin MS, Yang X, Wang H. Hyperhomocysteinemia, DNA methylation and vascular disease. Clin Chem Lab Med 2007;45:1660–1666 [DOI] [PubMed] [Google Scholar]
- 47.Mackay DJ, Callaway JL, Marks SM, et al. Hypomethylation of multiple imprinted loci in individuals with transient neonatal diabetes is associated with mutations in ZFP57. Nat Genet 2008;40:949–951 [DOI] [PubMed] [Google Scholar]
- 48.Boonen SE, Mackay DJ, Hahnemann JM, et al. Transient neonatal diabetes, ZFP57, and hypomethylation of multiple imprinted loci: a detailed follow-up. Diabetes Care 2013;36:505–512 [DOI] [PMC free article] [PubMed] [Google Scholar]
- 49.Toperoff G, Aran D, Kark JD, et al. Genome-wide survey reveals predisposing diabetes type 2-related DNA methylation variations in human peripheral blood. Hum Mol Genet 2012;21:371–383 [DOI] [PMC free article] [PubMed] [Google Scholar]
- 50.Olsen AS, Sarras MP, Jr, Leontovich A, Intine RV. Heritable transmission of diabetic metabolic memory in zebrafish correlates with DNA hypomethylation and aberrant gene expression. Diabetes 2012;61:485–491 [DOI] [PMC free article] [PubMed] [Google Scholar]