Abstract
Purpose
The clinical advantage of intensity modulated proton therapy (IMPT) may be diminished by range and patient setup uncertainties. We evaluated the effectiveness of robust optimization that incorporates uncertainties into the treatment planning optimization algorithm for treatment of base of skull cancers.
Methods and materials
We compared 2 IMPT planning methods for 10 patients with base of skull chordomas and chondrosarcomas: (1) conventional optimization, in which uncertainties are dealt with by creating a planning target volume (PTV); and (2) robust optimization, in which uncertainties are dealt with by optimizing individual spot weights without a PTV. We calculated root-mean-square deviation doses (RMSDs) for every voxel to generate RMSD volume histograms (RVHs). The area under the RVH curve was used for relative comparison of the 2 methods’ plan robustness. Potential benefits of robust planning, in terms of target dose coverage and homogeneity and sparing of organs at risk (OARs) were evaluated using established clinical metrics. Then the plan evaluation metrics were averaged and compared with 2-sided paired t tests. The impact of tumor volume on the effectiveness of robust optimization was also analyzed.
Results
Relative to conventionally optimized plans, robustly optimized plans were less sensitive for both targets and OARs. In the nominal scenario, robust and conventional optimization resulted in similar D95% doses (D95% clinical target volume [CTV]: 63.3 and 64.8 Gy relative biologic effectiveness [RBE]), P <.01]) and D5%-D95% (D5%-D95% CTV: 8.0 and 7.1 Gy[RBE], [P < .01); irradiation of OARs was less with robust optimization (brainstem V60: 0.076 vs 0.26 cm3 [P <.01], left temporal lobe V70: 0.22 vs 0.41 cm3, [P = .068], right temporal lobe V70: 0.016 vs 0.11 cm3, [P = .096], left cochlea Dmean: 28.1 vs 30.1 Gy[RBE], [P = .023], right cochlea Dmean: 23.7 vs 25.2 Gy [RBE], [P = .059]). Results in the worst-case scenario were analogous.
Conclusions
Robust optimization is effective for creating clinically feasible IMPT plans for tumors of the base of skull.
Introduction
Currently, most proton treatment centers employ passive scattering proton therapy (PSPT), in which broad beams are shaped laterally using custom apertures and distally using compensators. However, the majority of centers under development will use scanning beams capable of delivering intensity modulated proton therapy (IMPT), which utilizes magnetic scanning of a “pencil” proton beam to cover target volumes. The IMPT may improve high-dose conformity compared with PSPT.1–4 However, multifield IMPT is more sensitive than PSPT in regard to patient setup and range uncertainties because each beam is designed to deliver nonuniform dose, with a uniform dose achieved only by summing the contributions from all beams. Uncertainties to convert the computed tomography (CT) number to the proton stopping power ratio can cause up to a 3.5% range uncertainty, while perturbation of tissue density due to geometric errors (ie, setup and internal organ motion error) and anatomic deformation can degrade the intended dose distribution in the patient.5–8
Different beam delivery techniques require different treatment planning methods to account for the setup and range uncertainty. For PSPT, patient setup uncertainties are dealt with by expanding the aperture and range uncertainty through smearing the compensator and using appropriate beam-specific distal and proximal margins. For IMPT plans generated with single-field optimization, Park et al9 recently demonstrated that a beam-specific planning target volume (PTV) could account for both setup and range uncertainties. However, in multifield optimized (MFO) IMPT, the highly heterogeneous dose distributions for each beam, both within and outside the target volume, render PTV-based optimization strategies ineffective.10,11 Even modest uncertainties may perturb the total dose distribution from all beams to a significant degree, which may lead to unforeseen clinical consequences. Additionally, since the PTV is by definition larger than the clinical target volume (CTV), more normal tissues surrounding the CTV are irradiated. Nevertheless, current commercial planning software uses the conventional photon PTV concept in IMPT optimization.6,10
Many research groups have proposed to use robust optimization by taking uncertainties into account directly in the optimization algorithm 7,8,11–18 Robust optimization can not only render IMPT plans less sensitive to uncertainties but also achieve better sparing of normal tissues than PTV-based conventional optimization.7,8,12,13,15,19,20 Although robust optimization does not aim to directly minimize the dose delivered to normal tissues in the nominal scenario (without any uncertainties considered), direct targeting the CTV instead of the larger PTV improves plan quality compared with conventional PTV-based optimization.7,8,19,20
Although previous work has shown that robust planning is superior to PTV-based planning for cancers of various disease sites,7,8,12,13,15,19,20 no published patient population study has looked at the base-of-skull site, which is subject to complex tissue heterogeneities, a high number of critical structures in close proximity, and with the need for high doses to achieve disease control. Furthermore, no study has yet analyzed the potential benefits of robust planning in terms of meaningful or standard clinical metrics. The current analysis was undertaken to fill both those gaps in knowledge. Specifically, we compared the 2 types of planning for base-of-skull chordomas and chondrosarcomas using clinical dose constraints.
Methods and materials
Patients and beam configurations
We retrospectively prepared treatment plans for 10 patients treated at our institution. Seven patients had undergone IMPT for chordomas and 3 for chondrosarco-mas, all arising in the clival region. A 2-Gy(RBE [relative biological effectiveness]) dose per fraction was used in each case, yielding a total prescribed dose of 70 Gy(RBE) for 5 patients with chordoma, 66 Gy(RBE) for 2 patients with chordoma, and 66, 68, and 70 Gy(RBE) for each of 3 patients with chondrosarcoma (Table 1). Six patients had received adjuvant radiation therapy following subtotal resections, and 4 had received radiation therapy for disease that recurred following the initial resection. Gross disease was present in each case.
Table 1.
Prescribed doses, target volumes, and beam angles
| Patient | Diagnosis | No. of fractions | Prescribed doses (Gy[RBE])
|
Target volumes (cm3)
|
Beam angles (gantry, couch)
|
||||||
|---|---|---|---|---|---|---|---|---|---|---|---|
| GTV | CTV1 a | CTV2 b | GTV | CTV1 | CTV2 | Field 1 | Field 2 | Field 3 | |||
| 1 | Chordoma | 35 | 70 | 63 | 30.2 | 59.0 | 270°, 50° | 75°, 320° | 180°, 0° | ||
| 2 | Chordoma | 33 | 66 | 66 | 4.6 | 28.1 | 300°, 95° | 290°, 0° | 70°, 0° | ||
| 3 | Chordoma | 35 | 70 | 70 | 3.0 | 15.8 | 285°, 0° | 70°, 0° | 265°, 90° | ||
| 4 | Chordoma | 35 | 70 | 63 | 8.5 | 19.6 | 280°, 0° | 80°, 0° | 285°, 90° | ||
| 5 | Chordoma | 35 | 70 | 70 | 38.7 | 84.2 | 260°, 0° | 50°, 0° | 105°, 0° | ||
| 6 | Chondrosarcoma | 33 | 66 | 66 | 7.0 | 24.5 | 300°, 0° | 180°, 0° | 290°, 90° | ||
| 7 | Chondrosarcoma | 34 | 68 | 68 | 13.2 | 23.3 | 295°, 15° | 90°, 345° | 290°, 90° | ||
| 8 | Chordoma | 33 | 66 | 66 | 10.7 | 45.8 | 60°, 0° | 290°, 0° | 320°, 0° | ||
| 9 | Chondrosarcoma | 35 | 70 | 70 | 63 | 12.1 | 25.0 | 47.0 | 55°, 0° | 105°, 0° | 70°, 290° |
| 10 | Chordoma | 35 | 70 | 70 | 63 | 10.1 | 31.4 | 300°, 15° | 190°, 90° | 290°, 90° | |
CTV, clinical target volume; GTV, gross tumor volume; RBE, relative biologic effectiveness.
CTV1 includes any gross disease with a 0.5–1 cm margin.
CTV2 has a further expansion, typically 0.8–1 cm.
We used an in-house developed treatment planning system.7,8,21 Three fields were employed. The prescribed doses, target volumes, and beam angles are listed in Table 1. The targets were delineated by physicians with CTV1 typically including any gross disease with a 0.5 to 1 cm margin tailored to include preoperative areas of disease if feasible. CTV2 has a further expansion, typically 0.8 to 1 cm to cover areas at lower risk for recurrence. For each patient, both CTV-based robust optimization and PTV-based conventional optimization were used to account for setup and range uncertainties. Setup uncertainties of ±3 mm and range uncertainties of ±3.5% of the beams’ nominal ranges were assumed, which are adopted from the current practice of image guided radiation therapy at our institution.22,23 The dose grid resolution for all cases was 2.5 mm. The PTVs were formed by isotropic expansion of the CTVs by 3 mm. IMPT spot arrangement was the same for both PTV-based conventional optimization and CTV-based robust optimization (Supplemental Table e1; available online only at www.practicalradonc.org). The CTV-to-PTV margin was assigned only to account for setup uncertainties; an additional margin was assigned during spot arrangement to account for the penumbra and ensure that the PTV was covered to an acceptable level. This margin is similar to the block margin in PSPT.
At our institution, the recommended dose constraints for base-of-skull cancers are as follows: for brainstem, the maximum surface dose ≤64 Gy(RBE) and V60 (the volume receiving ≥60 Gy(RBE)) ≤0.9 cm3; for temporal lobes, the maximum dose ≤70 Gy(RBE); for parotid glands, the mean dose ≤26 Gy(RBE); for optic nerves and optic chiasm, the maximum dose ≤54 Gy(RBE); and for cochlea, the mean dose ≤35 Gy(RBE).
Optimization algorithms
The worst-case robust optimization method has been reported elsewhere.7,8 Briefly, the objective function value for a given iteration is computed using the “worst-case dose distribution.”24 No geometric margin is used; rather, uncertainties are considered and accounted for in the optimization algorithm. To incorporate setup uncertainties, one shifts the patient isocenter in the anterior-posterior (A–P), superior–inferior (S–I), and patient right–left (R–L) directions, yielding 6 sets of dose distributions for all beamlets (“influence matrices”). The magnitude of the shift is 3 mm. The isocenter for each patient is typically placed in the geometric center of the target volume(s). Range uncertainties were incorporated by modifying the stopping power ratios by −3.5% and 3.5% to generate 2 additional influence matrices, respectively, corresponding to the maximum and minimum proton ranges under the nominal setup position. The worst-case dose distribution is then represented by the minimum of the 9 dose distributions in each voxel in the targets and the maximum of the 9 dose distributions in each voxel outside the targets.24
Plan robustness
Plan robustness is loosely defined as the ability of a plan to retain its objectives under the influence of uncertainties. In order to quantify the robustness of the plans created here, we calculated the root-mean-square dose (RMSD) of the 21 dose distributions calculated under the extreme bounds of uncertainties for each voxel: with the isocenter of the patient at the nominal position and with the isocenter rigidly shifted in the A–P, S–I, and R–L directions for each of the 3 proton ranges (nominal, minimum, and maximum) yielding 21 dose distributions (7 per proton range). We then calculated RMSD volume histograms (RVHs).19 Each pair of RVH plots for a given structure, 1 for the PTV-based plan and 1 for CTV-based plan, provides a relative indication of a plan’s robustness. The area under the RVH curve (AUC) gives a relative numeric measure; the smaller the AUC, the more robust the plan.
Evaluating target dose coverage, homogeneity, and normal tissue sparing
To evaluate target dose coverage, homogeneity, and normal tissue sparing, we used conventional dose–volume indices. As we did in quantifying plan robustness, we rigidly shifted the patient isocenter. Two dose–volume histograms (DVHs) were generated for each target; one by choosing the minimum of the 21 dose distributions in each voxel in the target and the other by choosing the maximum. Then, D95% and D5% (the dose that covered the 5% of the structure volume) – D95% were used to assess target dose coverage and homogeneity in the worst-case scenario. D95% was derived from the minimum DVH, and D5% was derived from the maximum DVH. The corresponding values of D95% and D5% – D95% in the nominal scenario were also derived.
The DVHs for organs at risk (OARs) based on worst-case dose distributions (by choosing the maximum of the 21 dose distributions in each voxel) and nominal dose distributions were also generated. The following dosimetric parameters were used to measure the sparing of OARs: mean dose (Dmean) for the cochlea, parotid glands, and hippocampus; D1% for the brainstem, spinal cord, optic chiasm, temporal lobes, optic nerves, and whole brain; V60 for the brainstem and temporal lobes; and V70 for the temporal lobes.
Evaluating the improvement due to robust optimization of plan robustness, target dose homogeneity, and normal tissue sparing
We defined improvement in plan robustness as the difference between the AUCs of the CTVs from the 2 methods normalized by the AUC of the CTVs from the conventional method; ie, (AUCPTV−AUCRobust)/AUCPTV. We defined a heterogeneity index (HI) as (D5%−D95%)/D0, where D0 is the prescribed dose. We then defined target dose homogeneity improvement (TDHI) as the difference between the HIs from the 2 plans normalized by the HI from the PTV-based plan: TDHI = (HIPTV−HIRobust)/HIPTV. Improvements of normal tissue sparing were defined similarly.
Statistical analysis
Mean AUCs, D95%, and D5% − D95% values for targets, and metrics for OAR sparing were compared by paired t tests (or by the Wilcoxon test if outliers were present) using SPSS, version 19.0, software (IBM, Armonk, New York). A derived value of P <.05 was considered statistically significant.
Results
Plan robustness
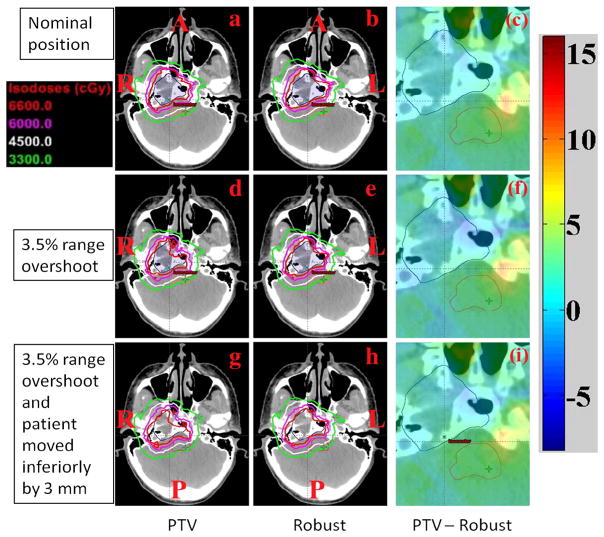
Figure 1 depicts the transverse dose distributions for a single axial CT slice for patient 6 comparing the PTV-based conventional optimization (panels a, d, and g) and CTV-based robust optimization (b, e, and h). Comparing a 3.5% range overshoot (panels d and e) as well as a combination of range overshoot and 3-mm shift (panel g and h) reveals that isodose lines in the PTV-based plan are perturbed to a significantly greater degree than in the robustly optimized plan. A 3.5% range overshoot with or without inferior displacement leads to a loss of CTV coverage (prescribed dose of 66 Gy[RBE]). Moreover, brainstem exposure to low, intermediate, and high dose regions is increased, particularly with the combination of range and setup uncertainty (panels g and h). In order to more clearly highlight the above conclusions, panels c, f, and i show differential dose distributions from the PTV plan minus the dose distribution from the robust plan. Prescription dose coverage of the CTV is inferior for the PTV-based plan (blue in panel f and i), while the dose to the brainstem region is increased (yellow in panel c, f, and i). This case scenario highlights better brainstem sparing offered by robust planning not only in the perturbed scenarios (panels f and i) but also in the nominal scenario (panel c). Additional OARs are not depicted for clarity.
Figure 1.
Dose distributions in the transverse plane for patient 6. The depicted distributions illustrate that the CTV-based robustly optimized plan (panels b, e, h) is insensitive to uncertainties relative to the planning target volume (PTV)-based conventionally optimized plan (panels a, d, g). Panels c, f, i, dose difference between PTV-based plans and robustly optimized plans. (clinical target volume, dark blue segment; brainstem, orange segment; A, anterior; L, left; P, posterior; R; right).
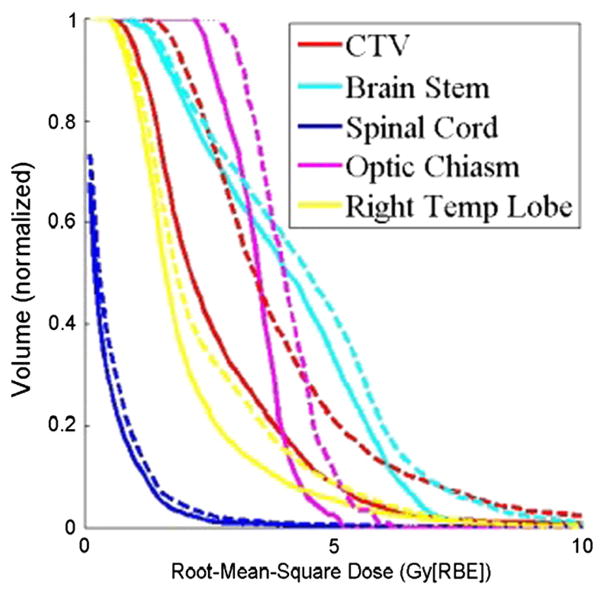
Figure 2 illustrates RVH curves for patient 7. The plan’s robustness to uncertainties was improved using robust optimization. Variances in dose distributions under uncertainties in the robustly optimized plan for CTV (red solid lines; AUC = 26.0) and brainstem (cyan solid lines; AUC = 39.6) were smaller than those in the PTV-based plan (red and cyan dashed lines; AUC = 39.3 and 43.7, respectively).
Figure 2.
The RVH curves derived from the robust plan (solid lines) and the PTV-based plan (dashed lines) for patient 7. Each curve was normalized by the total volume of the corresponding organ. RVH AUCs for the robustly optimized plan were smaller than those for the PTV-based plan, indicating that AUCs can be useful for relative comparisons of the plans in terms of robustness. (AUC, area under the RVH curve; CTV, clinical target volume; PTV, planning target volume; RBE, relative biologic effectiveness; RVH, RMSD volume histograms; Right Temp Lobe, right temporal lobe)
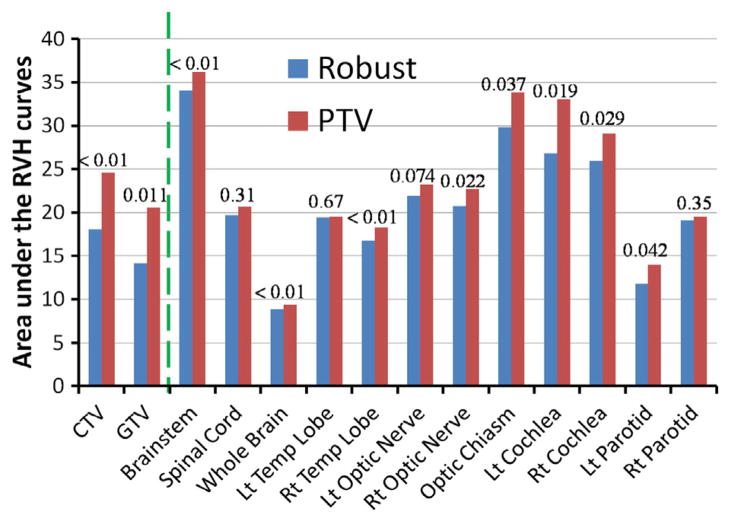
Average AUCs for all structures examined in the 10 patients are shown in Fig 3 and Supplemental Table e2 (available online only at www.practicalradonc.org). Compared with conventional optimization, robust optimization was less affected by uncertainties not only for the targets but also for the OARs; AUCs were smaller for all structures.
Figure 3.
Average RVH AUCs for various structures in the 10 base-of-skull cancer patients in both the robust and PTV-based plans. The dashed line separates the data for targets (CTV and GTV) from the data for normal tissues; P values are indicated. (AUC, area under the RVH curve; CTV, clinical target volume; GTV, gross tumor volume; Lt, left; PTV, planning target volume; RVH, RMSD volume histograms; Rt, right)
Plan optimality in the nominal scenario
In the nominal scenario, target dose coverage obtained by robust optimization was similar to that obtained by conventional optimization (GTV D95%, 66.2 and 66.4 Gy [RBE] [P = .69]; CTV D95%, 63.3 and 64.8 Gy[RBE] [P <.01]) and produced similarly homogeneous dose distributions (D5% − D95% GTV, 4.4 and 4.7 Gy[RBE] [P = .41]; CTV, 8.0 and 7.1 Gy[RBE] [P = .16]). However, robust optimization significantly reduced doses to OARs (Fig 4 and Supplemental Table e3; available online only at www.practicalradonc.org).
Figure 4.
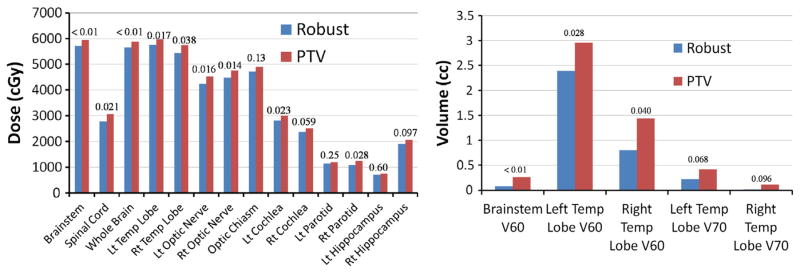
Organs at risk sparing in the nominal scenario in the robust and planning target volume (PTV)-based plans. (Left) Average Dmean for cochlea, parotids, and hippocampi, and average D1% for other organs. (Right) average V60 for brainstem and temporal (Temp) lobes and average V70 for temporal lobes. P values are indicated.
Plan optimality in the worst-case scenario
Target coverage obtained by robust optimization was also similar to that obtained by conventional optimization in the worst-case scenario (GTV D95%, 62.9 and 61.4 Gy [RBE] [P = .075], CTV D95%, 57.1 and 57.5 Gy[RBE] [P = .54]) yet produced more homogeneous dose distributions (GTV D5% − D95%, 9.5 and 13.2 Gy[RBE] [P <.01], CTV D5% − D95%, 16.6 and 17.9 Gy[RBE] [P = 0.074]). Robust optimization also reduced doses to OARs (Fig 5 and Supplemental Table e4; available online only at www.practicalradonc.org). Nearly all endpoints differed significantly between the 2 methods. The clinical requirement for brainstem V60 was satisfied even in the worst-case scenario.
Figure 5.
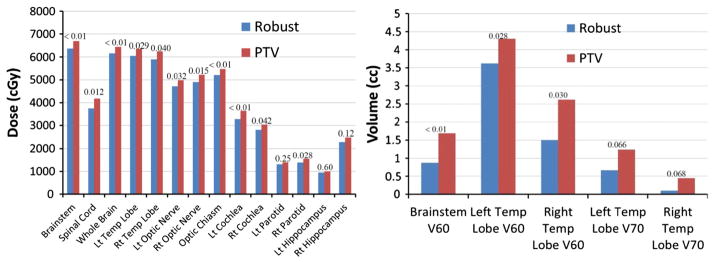
Organs at risk sparing in the worst-case scenario in the robust and planning target volume (PTV)-based plans. (Left) Average Dmean for cochlea, parotids, and hippocampi and average D1% for other organs. (Right) Average V60 for brainstem and temporal (Temp) lobes and average V70 for temporal lobes. P values are indicated.
Impact of tumor volume upon improvement due to robust optimization
We next sought to analyze the effect of tumor volume on the amount of improvement yielded by robust optimization compared with conventional optimization. We observed that if the CTV was no more than 25 cm3, the median improvement in plan robustness was 33.4% (range, 20.1%–45.9%), and if the CTV was greater than 25 cm3, the median improvement in plan robustness was 20.1% (range, 4.1%–43.0%). It therefore appeared that our robust optimization method generally improved target dose robustness to uncertainties more if the CTV was no more than 25 cm3. The same conclusion was reached for improvement in target dose homogeneity in the worst-case scenario. The median TDHI was 17.8% (range, 10.5%–31.8%) compared with 1.2% (range, −14.1%–21.5%).
On the contrary, the improvements in sparing of brainstem D1%, left optic nerve D1%, and right optic nerve D1% due to robust optimization were found to increase with tumor volume, while no obvious relationships between tumor volume and improvements in the sparing of other normal tissues were observed.
Please note that the 25 cm3 CTV threshold value warrants further study because of the small number of cases analyzed here. Conclusions regarding the impact of tumor volume on the effectiveness of robust optimization compared with the conventional optimization are preliminary, although we did observe certain trends.
Discussion
Our finding in these clinically challenging base-of-skull cancer cases reaffirms that robust treatment planning is superior to PTV-based planning for IMPT. Our results showed that CTV-based robust optimization can reduce the impact of uncertainties in IMPT plans for base-of-skull cancer and can improve sparing of OARs when compared with PTV-based conventional optimization.
For photon therapy a uniformly expanded PTV works well in addressing daily setup uncertainty if the PTV is covered by the prescription dose in the nominal scenario. However, the validity of the PTV concept relies on the assumption that the change of anatomy due to uncertainty would only perturb the dose distribution minimally.25 This is not true for proton therapy,5,6,24 especially for MFO-IMPT. In the absence of a suitable method to account for uncertainties, the current though unsatisfactory practice of MFO-IMPT has been to expand the CTV into traditional PTV with the margin of setup uncertainties.26 Based on the current study, robust optimization is a promising approach to handle both setup and range uncertainties in MFO-IMPT.
We found that, in contrast to conventional optimization, robust optimization maintained dose homogeneity even after the incorporation of uncertainties. This may be of importance as several groups have shown that dose inhomogeneity within target volumes may be associated with increased rates of local disease recurrence.3 Likewise, irradiation of normal tissues, particularly the brainstem, beyond specified dose constraints may be associated with higher rates of severe toxicity.1 As shown in this study, the utilization of PTV-based conventional optimization may be inadequate to account for uncertainties. Although the plan generated using PTV-based techniques was able to meet some normal tissue constraints (eg, brainstem V60), uncertainties could degrade plan quality and increase the dose received by critical normal tissues, exceeding tolerance doses.
Although CTV-based robust optimization performed better than PTV-based conventional optimization, the improvement from robust optimization compared with PTV optimization varied with the CTV size. On the one hand, the relative improvement of plan robustness and CTV dose homogeneity in the worst-case scenario using robust optimization compared with the conventional optimization was better for smaller CTVs. This is likely because the shift with the PTV margin is a larger perturbation compared with the target size; ie, Δr/r is larger if the CTV is smaller, where we assume CTV is a sphere with a radius of r and Δr = 3 mm is the PTV margin. Thus robust optimization has more room to improve from the conventional optimization if the CTV is smaller.
On the other hand, we found that the relative improvement of normal tissue sparing due to CTV-based robust optimization compared with the PTV-based conventional optimization was better. This is likely because the absolute volume enclosed by a PTV margin 4πr2 Δr would be larger with a larger CTV, given the same assumptions about tumor radius and PTV margin size, increasing the chances for more volumes of nearby normal tissues to overlap with the PTV. Thus CTV-based robust optimization would spare nearby normal tissue better due to the reduction of PTV concept in CTV-based robust optimization.
In general, robust optimization forces the inverse treatment planning process to minimize variance in dose within the CTV under different uncertainty scenarios at the cost of producing a less optimal dose distribution for the targets and other OARs under the nominal scenario. However, in the absence of robust optimization, the only practical way to deal with setup uncertainty is to use a PTV, which increases dose to normal tissues and to OARs near the CTV. Because PTV-based plans always add dose to nontarget tissues, CTV-based robust optimization can produce plans that are robust to uncertainties and yet deliver an equal or lower dose to tissues surrounding the CTV.
There are several limitations to the current study. In this work, only rigid interfractional patient setup and range uncertainties are considered. In principle, robust optimization must also consider nonrigid interfractional and intrafractional anatomic variations. We are in fact exploring such studies. Regardless, based on the findings in the current study, we believe that translating robust optimization into clinical practice will significantly improve the quality of IMPT for base-of-skull cancers.
Supplementary Material
Acknowledgments
Sources of support: This research was supported by the National Cancer Institute through grants P01CA021239, K25CA168984, and Cancer Center Support Grant CA016672 and by the University Cancer Foundation via the Institutional Research Grant program at The University of Texas MD Anderson Cancer Center. The content is solely the responsibility of the authors and does not necessarily represent the official views of the National Institutes of Health.
Footnotes
Supplementary material for this article (http://dx.doi.org/10.1016/j.prro.2013.12.001) can be found online at www.practicalradonc.org.
Conflicts of interest: None.
References
- 1.Debus J, Hug EB, Liebsch NJ, et al. Brainstem tolerance to conformal radiotherapy of skull base tumors. Int J Radiat Oncol Biol Phys. 1997;39:967–975. doi: 10.1016/s0360-3016(97)00364-7. [DOI] [PubMed] [Google Scholar]
- 2.Hug EB, Loredo LN, Slater JD, et al. Proton radiation therapy for chordomas and chondrosarcomas of the skull base. J Neurosurg. 1999;91:432–439. doi: 10.3171/jns.1999.91.3.0432. [DOI] [PubMed] [Google Scholar]
- 3.Noël G, Feuvret L, Ferrand R, Boisserie G, Mazeron JJ, Habrand JL. Radiotherapeutic factors in the management of cervical-basal chordomas and chondrosarcomas. Neurosurgery. 2004;55:1252–1262. doi: 10.1227/01.neu.0000143330.30405.aa. [DOI] [PubMed] [Google Scholar]
- 4.Terahara A, Niemierko A, Goitein M, et al. Analysis of the relationship between tumor dose inhomogeneity and local control in patients with skull base chordoma. Int J Radiat Oncol Biol Phys. 1999;45:351–358. doi: 10.1016/s0360-3016(99)00146-7. [DOI] [PubMed] [Google Scholar]
- 5.Lomax AJ. Intensity modulated proton therapy and its sensitivity to treatment uncertainties 1: the potential effects of calculational uncertainties. Phys Med Biol. 2008;53:1027–1042. doi: 10.1088/0031-9155/53/4/014. [DOI] [PubMed] [Google Scholar]
- 6.Lomax AJ. Intensity modulated proton therapy and its sensitivity to treatment uncertainties 2: the potential effects of inter-fraction and inter-field motions. Phys Med Biol. 2008;53:1043–1056. doi: 10.1088/0031-9155/53/4/015. [DOI] [PubMed] [Google Scholar]
- 7.Liu W, Li Y, Li X, et al. Influence of robust optimization in intensity-modulated proton therapy with different dose delivery techniques. Med Phys. 2012;39:3089–4001. doi: 10.1118/1.4711909. [DOI] [PMC free article] [PubMed] [Google Scholar]
- 8.Liu W, Zhang X, Li Y, et al. Robust optimization in intensity-modulated proton therapy. Med Phys. 2012;39:1079–1091. doi: 10.1118/1.3679340. [DOI] [PMC free article] [PubMed] [Google Scholar]
- 9.Park PC, Zhu XR, Lee AK, et al. A beam-specific planning target volume (PTV) design for proton therapy to account for setup and range uncertainties. Int J Radiat Oncol Biol Phys. 2012;82:e329–e336. doi: 10.1016/j.ijrobp.2011.05.011. [DOI] [PMC free article] [PubMed] [Google Scholar]
- 10.Albertini F, Hug EB, Lomax AJ. Is it necessary to plan with safety margins for actively scanned proton therapy? Phys Med Biol. 2011;56:4399–4413. doi: 10.1088/0031-9155/56/14/011. [DOI] [PubMed] [Google Scholar]
- 11.Chen W, Unkelbach J, Trofimov A, et al. Including robustness in multi-criteria optimization for intensity-modulated proton therapy. Phys Med Biol. 2012;57:591–608. doi: 10.1088/0031-9155/57/3/591. [DOI] [PMC free article] [PubMed] [Google Scholar]
- 12.Fredriksson A. A characterization of robust radiation therapy treatment planning methods-from expected value to worst case optimization. Med Phys. 2012;39:5169–5181. doi: 10.1118/1.4737113. [DOI] [PubMed] [Google Scholar]
- 13.Fredriksson A, Forsgren A, Hårdemark B. Minimax optimization for handling range and setup uncertainties in proton therapy. Med Phys. 2011;38:1672–1684. doi: 10.1118/1.3556559. [DOI] [PubMed] [Google Scholar]
- 14.Pflugfelder D, Wilkens JJ, Oelfke U. Worst case optimization: A method to account for uncertainties in the optimization of intensity modulated proton therapy. Phys Med Biol. 2008;53:1689–1700. doi: 10.1088/0031-9155/53/6/013. [DOI] [PubMed] [Google Scholar]
- 15.Stuschke M, Kaiser A, Pöttgen C, Lübcke W, Farr J. Potentials of robust intensity modulated scanning proton plans for locally advanced lung cancer in comparison to intensity modulated photon plans. Radiother Oncol. 2012;104:45–51. doi: 10.1016/j.radonc.2012.03.017. [DOI] [PubMed] [Google Scholar]
- 16.Unkelbach J, Bortfeld T, Martin BC, Soukup M. Reducing the sensitivity of IMPT treatment plans to setup errors and range uncertainties via probabilistic treatment planning. Med Phys. 2009;36:149–163. doi: 10.1118/1.3021139. [DOI] [PMC free article] [PubMed] [Google Scholar]
- 17.Unkelbach J, Chan TCY, Bortfeld T. Accounting for range uncertainties in the optimization of intensity modulated proton therapy. Phys Med Biol. 2007;52:2755–2773. doi: 10.1088/0031-9155/52/10/009. [DOI] [PubMed] [Google Scholar]
- 18.Lomax AJ, Boehringer T, Coray A, et al. Intensity modulated proton therapy: A clinical example. Med Phys. 2001;28:317–324. doi: 10.1118/1.1350587. [DOI] [PubMed] [Google Scholar]
- 19.Liu W, Frank SJ, Li X, et al. Effectiveness of robust optimization in intensity-modulated proton therapy planning for head and neck cancers. Med Phys. 2013;40:051711. doi: 10.1118/1.4801899. [DOI] [PMC free article] [PubMed] [Google Scholar]
- 20.Liu W, Frank SJ, Li X, Li Y, Zhu RX, Mohan R. PTV-based IMPT optimization incorporating planning risk volumes vs robust optimization. Med Phys. 2013;40:021709. doi: 10.1118/1.4774363. [DOI] [PMC free article] [PubMed] [Google Scholar]
- 21.Li Y, Zhu RX, Sahoo N, Anand A, Zhang X. Beyond the two Gaussians: A study of single spot modeling for scanning proton dose calculation. Phys Med Biol. 2012;57:983–997. doi: 10.1088/0031-9155/57/4/983. [DOI] [PMC free article] [PubMed] [Google Scholar]
- 22.Yang M, Zhu XR, Park PC, et al. Comprehensive analysis of proton ra7nge uncertainties related to patient stopping-power-ratio estimation using the stoichiometric calibration. Phys Med Biol. 2012;57:4095–4115. doi: 10.1088/0031-9155/57/13/4095. [DOI] [PMC free article] [PubMed] [Google Scholar]
- 23.Moyers MF, Sardesai M, Sun S, Miller DW. Ion stopping powers and CT numbers. Med Dosim. 2010;35:179–194. doi: 10.1016/j.meddos.2009.05.004. [DOI] [PubMed] [Google Scholar]
- 24.Lomax AJ, Pedroni E, Rutz H, Goitein G. The clinical potential of intensity modulated proton therapy. Z Med Phys. 2004;14:147–152. doi: 10.1078/0939-3889-00217. [DOI] [PubMed] [Google Scholar]
- 25.Schwarz M. Treatment planning in proton therapy. Eur Phys J Plus. 2011;126:67–76. [Google Scholar]
- 26.Meyer J, Bluett J, Amos R, et al. Spot scanning proton beam therapy for prostate cancer: treatment planning technique and analysis of consequence of rotational and translational alignment errors. Int J Radiat Oncol Biol Phys. 2010;78:428–434. doi: 10.1016/j.ijrobp.2009.07.1696. [DOI] [PubMed] [Google Scholar]
Associated Data
This section collects any data citations, data availability statements, or supplementary materials included in this article.


