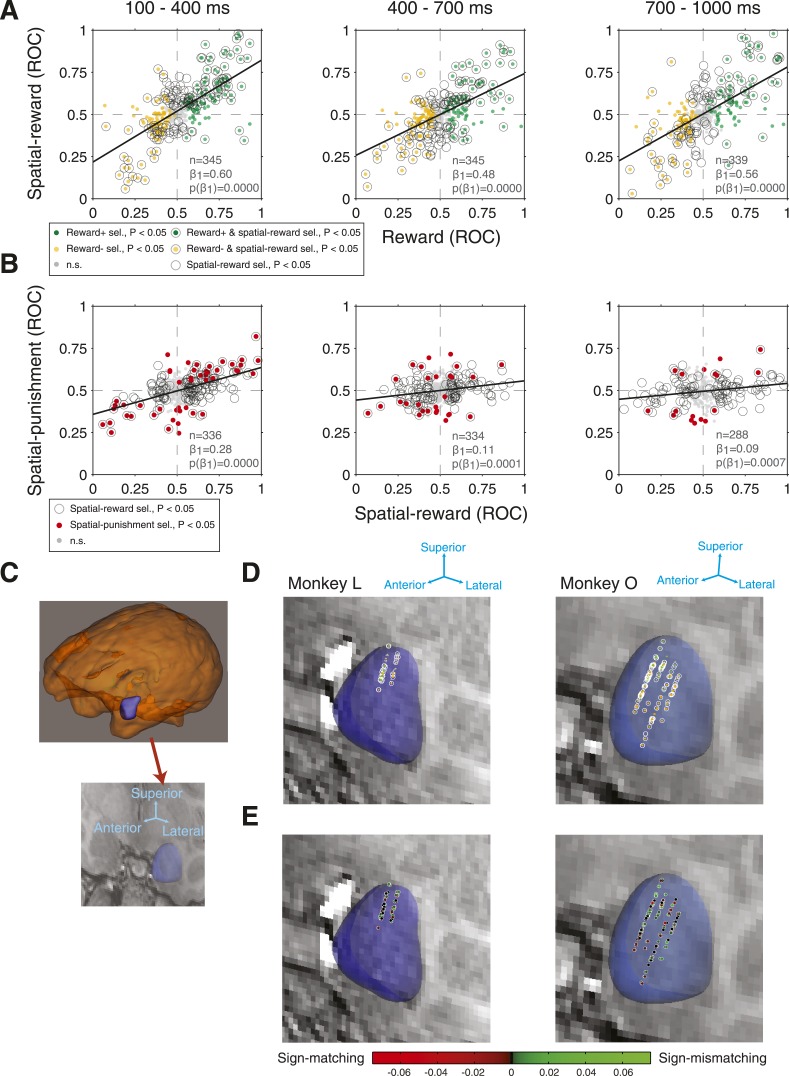
Figure 4. Amygdala neurons exhibit consistency between reward selectivity, spatial-reward selectivity, and spatial-punishment selectivity.
(A) Relationship between reward selectivity and spatial-reward selectivity indices in each time epoch. (B) Relationship between spatial-reward selectivity and spatial-punishment selectivity indices. For both (A) and (B), plot style indicates the significance selectivity for each recording site (see legends) and regressions lines are plotted (significant in each case, p < 0.001). (C) 3D reconstruction of the whole brain and the amygdala for Monkey O (top), and the 3D reconstruction of the amygdala overlaid on a single coronal MRI slice for that monkey (bottom). (D and E) Recording sites. Each coronal slice has been tilted to enable visualization of all electrode tracks. Arrows provide the orientation of the slice after tilting. Each data point represents the location of one site recorded during the task for each monkey (Monkey L: left; Monkey O: right) and the significance of selectivity for that site (D, as in A; p < 0.05 in at least one time epoch) or the degree of sign-matching/magnitude of the spatial-reward and spatial-punishment selectivity indices (E). In (E) positive values (green dots) indicate those neurons with matching signs of selectivity, while negative values (red dots) indicate non-matching selectivity; the brightness of the data points indicates the magnitude of the selectivity.

