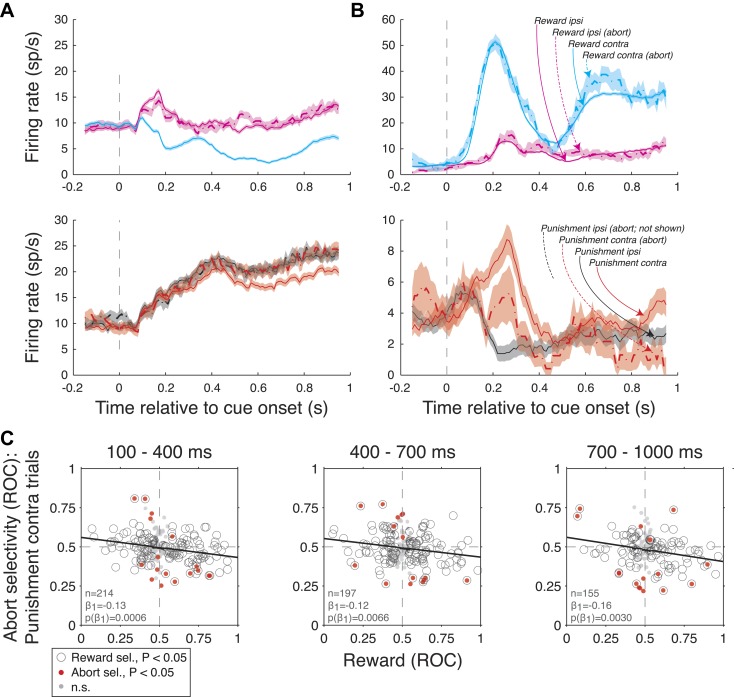
Author response image 2.
Amygdala firing rate selectivity for aborted trials. (A and B) Example neuron cue-aligned firing rates for aborted (dashed lines) and non-aborted trials (solid lines) on R-present trials (left; R-contra, R-ipsi) and R-absent trials (right; P-contra, P-ipsi). Shading indicates standard error across trials. Note that firing rates for abort trials are not plotted in cases where there were less than 6 aborts. (A) Neuron with reward selectivity and spatial-reward selectivity indices <0.5 in all time epochs (p<0.05). Abort selectivity was significant only on P-contra trials in the 700-1000 ms epoch (index = 0.70, p<0.05). (B) Neuron with reward selectivity and spatial-reward selectivity indices >0.5 in all time epochs (p<0.05). Abort selectivity was significant only on P-contra trials in the 700-1000 ms epoch (index = 0.39, p<0.05). Different y-axis ranges are used for R-present and R-absent trials to illustrate abort selectivity. (C) Relationship between reward selectivity and abort selectivity indices on punishment-contra trials for each time epoch. Plot style indicates the significance of selectivity indices (see legend); solid lines indicate significant regressions (p<0.05).

