Abstract
Background and Aim:
Arterial carbon dioxide tension (PaCO2) is considered the gold standard for scrupulous monitoring in pediatric intensive care unit (PICU), but it is invasive, laborious, expensive, and intermittent. The study aims to explore when we can use end-tidal carbon dioxide tension (PETCO2) as a reliable, continuous, and noninvasive monitor of arterial CO2
Materials and Methods:
Concurrent PETCO2, fraction of inspired oxygen, PaCO2, and arterial oxygen tension values of clinically stable children on mechanical ventilation were recorded. Children with extra-pulmonary ventriculoatrial shunts were excluded. The PETCO2 and PaCO2 difference and its variability and reproducibility were studied.
Results:
A total of 624 concurrent readings were obtained from 105 children (mean age [SD] 5.53 [5.43] years) requiring invasive bi-level positive airway pressure ventilation in the PICU. All had continuous PETCO2 monitoring and an arterial line for blood gas measurement. The mean (SD) number of concurrent readings obtained from each child, 4-6 h apart was 6.0 (4.05). The PETCO2 values were higher than PaCO2 in 142 observations (22.7%). The PaCO2–PETCO2 difference was individual admission specific (ANOVA, P < 0.001). The PaCO2–PETCO2 difference correlated positively with the alveolar-arterial oxygen tension [P(A-a)O2] difference (ρ = 0.381 P < 0.0001). There was a fixed bias between the PETCO2 and PaCO2 measuring methods, difference +0.66 KPa (95% confidence interval: +0.57 to +0.76).
Conclusions:
The PaCO2–PETCO2 difference was individual specific. It was not affected by the primary disorder leading to the ventilation.
Keywords: Capnography, carbon dioxide partial pressure, critical care, pediatrics
Introduction
The measurement of partial pressure of carbon dioxide in arterial blood (arterial carbon dioxide tension [PaCO2]) is an essential diagnostic and monitoring tool used in current clinical practice. However, its measurement remains invasive and intermittent.[1] The graphic display of CO2 concentration (or partial pressure) during the respiratory cycle (capnography) has offered many uses in adult[2,3,4] and pediatric clinical practice.[5,6] The absolute numerical measurement of CO2 concentration (or partial pressure) during the respiratory cycle has proved less useful. This is because the partial pressure of CO2 at the end of exhalation (end-tidal carbon dioxide tension [PETCO2]) does not reliably correlate with PaCO2. Our study was designed to investigate the relationship between PETCO2 and PaCO2 in children during steady state mechanical ventilation in the pediatric intensive care unit (PICU).
Materials and Methods
All patients receiving treatment in our PICU have their vital signs data automatically recorded and saved in an electronic patient record system (MetaVision, iMD-Soft systems, Schiessstraße 55, 40549, Düsseldorf, Germany). The laboratory investigation results and blood gases are saved in the same record. Mechanically ventilated patients also have their fraction of inspired oxygen (FiO2) and PETCO2 measured concurrently and automatically recorded. The FiO2 was measured by an oxygen electrode (calibrated daily) located at the inspiratory limb of the ventilator (Draeger Evita 4 XL ventilator, Drägerwerk AG & Co. KgaA, Moislinger Allee 53-55, 23558 Lübeck, Germany) whereas PETCO2 was measured by micro-stream sampling (Philips server, model M3015A/B, attached to the Philips MP30 and MP70 IntelliVue monitors, calibrated with each device check, Philips Healthcare, P.O. Box 10.000, 5680 DA Best, The Netherlands).
We collected above data and clinical diagnoses of children who were mechanically ventilated in the PICU over a 12-month period (January–December 2012). Children who had (a) an end tidal CO2 recording; (b) an arterial line for blood gas measurements and (c) were “clinically stable” (i.e, not in a resuscitation phase, and hemodynamically stable); and (d) on invasive bi-level positive airway pressure (BiPAP) ventilation were recruited. The maximum number of concurrent readings obtained from any single patient, if available, was capped to the first 16. All children had cuffed endotracheal tubes and minimal air leaks. A specific data collection form was used. They also had intermittent arterial blood gas measurements (corrected to 37°C) and continuous pulse oximetry (SpO2). We retrieved concurrently recorded FiO2, SpO2, PETCO2, PaCO2, PaO2, data every 4-6 h from all qualifying children using the “Metavision” electronic database. Children with suspected intracardiac shunting and/or poor cardiac output states were excluded. Furthermore, children on high-frequency oscillation (HFO) were excluded as they had no PETCO2 measurement.
The standard alveolar-gas equation (Eq. 1) was used to calculate the alveolar oxygen tension (PAO2).[7] The alveolar-arterial oxygen tension difference [P(A-a)O2] was estimated by subtracting the concurrent measured PaO2 from the calculated PAO2 in mmHg.
Equation 1: The alveolar gas equation: PAO2 = alveolar oxygen tension in mmHg; FiO2 = fractional inspired oxygen concentration; Patm = atmospheric pressure in mmHg; PH2O = partial pressure of water (47 mmHg at 37°C); and R = 0.8
PAO2 = (FiO2× [Patm − PH2O]) − (PaCO2÷ R) (1)
Statistics
The P(A-a)O2 difference was interpreted as indicative of the degree of intra-pulmonary shunt. Partial pressures were expressed in mmHg where necessary using a standard conversion (1 KPa = 7.5006 mmHg). The variability of the PETCO2 and PaCO2 difference (between children and between disorders) was studied using one-way ANOVA. The performance of PETCO2 and PaCO2 measurement methods were compared using a Bland-Altman plot.[8]
Ethics
This was an observational study of routinely monitored respiratory and hemodynamic parameters of children requiring mechanical ventilation in the PICU. There was neither any direct intervention in patient management nor a need to use any patient identifiable information. Therefore, according to local guidelines, an Ethics Committee review was not required. The study was registered as a service evaluation project.
Results
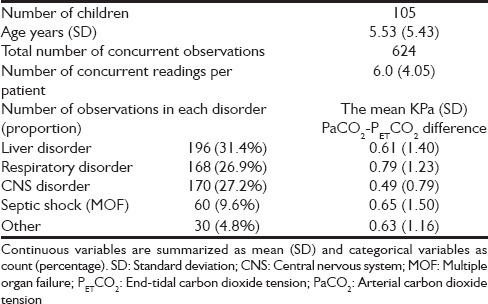
We obtained 624 concurrent readings from 105 children requiring invasive bi-level ventilation in the PICU. All children were in a clinically steady state and had an arterial line in situ for blood gas measurements and continuous PETCO2 monitoring. The demographic data of the study population are shown in Table 1.
Table 1.
Demographic data of the study population

The PETCO2 values recorded were higher than the concurrent PaCO2 (i.e, PaCO2 /PETCO2 ratio was <1) in 142 observations (22.7%). The proportions with PaCO2 /PETCO2 ratio <1 in the subcategories were, liver disorder 26.0%, respiratory disorder 20.8%, central nervous system disorder 16.5%, septic shock (multiple organ failure) 33.3%, and others 26.7% respectively.
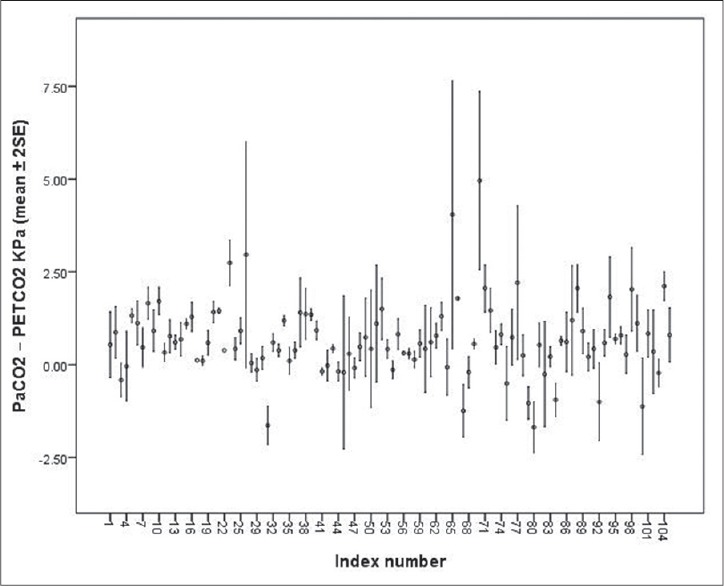
The PaCO2–PETCO2 difference was not significantly influenced by the disorders leading to mechanical ventilation (df 4, ANOVA, P = 0.6) [Table 1]. However, the mean PaCO2–PETCO2 difference was individual specific (df 103, ANOVA, P < 0.0001) [Figure 1]. This finding is limited by the fact that, in larger group analyses, ANOVA in SPSS (IBM United Kingdom Limited, PO Box 41, North Harbour, Portsmouth, Hampshire, PO6 3AU) only tells you at least one group in the analysis is different from at least one other. For the confirmation of this finding follow-up data are needed in the same groups and this is obviously not realistic in our cohort.
Figure 1.

Individual variability of arterial carbon dioxide tension (PaCO2)–end-tidal carbon dioxide tension (PETCO2) difference during a single pediatric intensive care unit admission
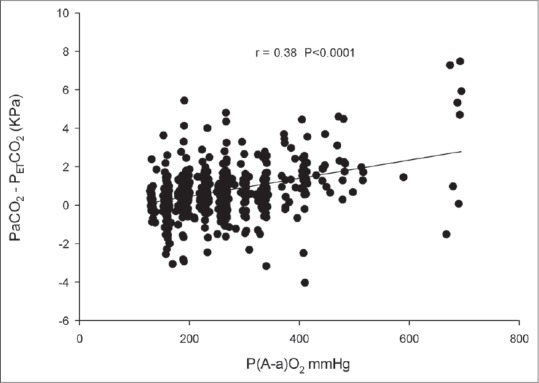
The PaCO2–PETCO2 difference positively correlated with P(A-a)O2 difference (two-tailed Pearson's correlation, ρ = 0.381, P < 0.0001) [Figure 2]. Please note scarcity of data at high FiO2 concentrations. This is because these children were on HFO and excluded. The PaCO2–PETCO2 difference did not correlate with age when averaged.
Figure 2.

The arterial carbon dioxide tension (PaCO2)–end-tidal carbon dioxide tension (PETCO2) difference correlates positively with alveolar-arterial oxygen tension [P(A-a)O2] difference (two-tailed Pearson correlation 0.381 P < 0.0001)
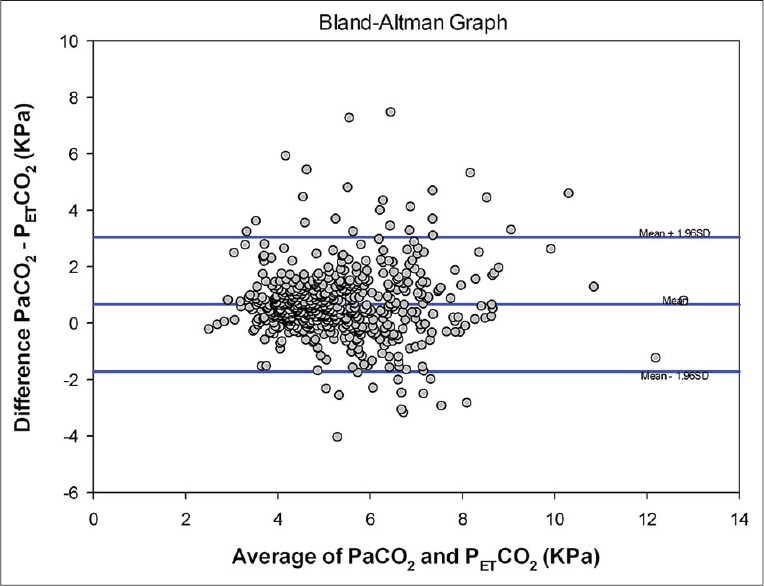
We compared PaCO2 and PETCO2, without bias, using the Bland-Altman method.[8] We found that the average reading of PaCO2 was consistently +0.66 KPa (95% confidence interval: +0.57 to +0.76) higher than that of PETCO2 [Figure 3].
Figure 3.

A Bland-Altman plot comparing concurrent arterial carbon dioxide tension (PaCO2) and end-tidal carbon dioxide tension (PETCO2) measurements (bias = 0.66, standard deviation = 1.22, limits of agreement = −1.72, 3.05, bias confidence interval [CI] 95% CI = 0.57-0.76, lower limit of agreement CI 95% CI = −1.89 to −1.56, upper limit of agreementCI 95% CI = 2.88–3.21)
Discussion
PETCO2 allows global evaluation of three main bodily functions: Metabolism, circulation, and ventilation.[9] Our study was designed to investigate the relationship of PETCO2 and PaCO2 in PICU patients, during different disease states. Circulation, ventilation and metabolic parameters were considered to be in a steady state whilst on invasive bi-level mechanical ventilation. We have shown that PaCO2–PETCO2 difference is consistent in each individual. Thus, in a clinically “steady” state of mechanical ventilation, the PETCO2 and PaCO2 difference can be expected to be static but unique to the individual in that setting. We also observed that the variability of PaCO2–PETCO2 was not affected by the primary disorder leading to the PICU admission.
The study demonstrates that in clinically stable children on mechanical ventilation, irrespective of their disease status, the PETCO2 and PaCO2 difference is consistent but individual specific. The corollary of this finding is that if an unstable difference between PaCO2 and PETCO2 becomes stable, this may suggest a clinical improvement as far as the ventilation/perfusion (V/Q) status of the lungs is concerned. Through attention to PaCO2–PETCO2 difference in PICU patients, unnecessary blood gas measurements can be avoided. A trend analysis of PaCO2–PETCO2 difference may therefore be valuable in the PICU setting.
Efforts to study PETCO2 against PaCO2 are not new. In order to have a noninvasive measure of PaCO2, several authors have investigated the relationship between PaCO2 and PETCO2 with mixed results. Sharma found the PETCO2 -PaCO2 mean difference to be stable and patient specific but variable between individuals.[10] Our findings go a step further. PETCO2 alone is not sufficiently reliable to replace arterial blood sampling based measurements,[11] but becomes useful once the PaCO2–PETCO2 difference is known.
Capnography provides a numerical measurement of inspired and end tidal CO2. Previous investigators have reported an average PETCO2 -PaCO2 difference of 4-6 mmHg in patients with normal lungs.[11,12,13,14,15] In patients with respiratory failure, the average PaCO2–PETCO2 difference was 18 mmHg.[16] We noted a difference of 4.9 mmHg (0.66 KPa) in our study.
Intra-pulmonary shunting in lung disease due to alveolar collapse/consolidation and/or diffusion abnormalities minimally affects CO2 elimination in the early stages.[17] With worsening lung disease, right-to-left shunting increases and results in poor oxygenation and carbon dioxide elimination. Therefore, for any given degree of arterial oxygen de-saturation there is an associated and obligatory PaCO2–PETCO2 difference. Using the shunt equation, we have shown a positive correlation between the PaCO2–PETCO2 difference and the P(A-a)O2 difference, and this provides an explanation to the above observations. As the FiO2 requirement increases, the greater the PaCO2–PETCO2 difference.
Approximately 20% of our PETCO2 values read higher than the concurrent PaCO2 measurement, resulting in a negative PaCO2–PETCO2 difference. Similar negative PaCO2–PETCO2 differences have been observed more than 30 years ago by Nunn and Hill during anesthesia but no explanation was offered.[12] There does not appear to be any correlation between this negative difference and the primary disease. This suggests the factors contributing to this difference may be more technical and not related to the primary disease. For example, McSwain et al. has recently shown an increase in the PaCO2–PETCO2 difference with rising dead space/tidal volume ratio.[18] Fletcher and Jonson observed negative or zero PaCO2–PETCO2 values in 12% of normal subjects during intermittent positive pressure ventilation with large tidal volumes and low frequencies under anesthesia.[19] Negative PaCO2–PETCO2 values were also observed during anesthesia in 50% of pregnant subjects, in 8.1% of patients after postcardiac bypass and in 50% of infants.[20,21,22,23,24,25]
The following hypotheses may explain the observed negative PaCO2–PETCO2 differences. Low tidal volume and high frequency ventilation settings may result in poor ventilation of dependent but well-perfused alveoli, resulting in worse V/Q matching. The gas emptying from these slow alveoli may remain in the airways during small frequent breaths. Under these circumstances, the low V/Q areas (alveoli with higher PCO2) make a higher contribution to overall gas exchange. The net effect of these factors is to enable the terminal part of phase III of the end tidal CO2 wave to exceed mean PaCO2, resulting in a negative PaCO2–PETCO2 .
Alternatively, very elevated mixed venous PCO2, as in exercise or septic shock, may contribute to a negative PaCO2–PETCO2 difference. In healthy adults, PaCO2–PETCO2 difference was shown to be inversely related to the frequency of breathing and directly related to tidal volume and CO2 output.[26] A negative PaCO2–PETCO2 difference in pregnancy has been attributed to higher CO2 production. The same explanation may hold true for children and infants with relatively higher metabolic rates. This study demonstrates that 33% of children in septic shock have negative PaCO2–PETCO2 observations.
The study had several limitations. For example, the standard alveolar gas equation is a simplification of the actual relationship between FiO2, PaCO2, and PaO2 and may deviate up to 10 mmHg (when FiO2 = 1.0) from the more rigorous, full calculation. In addition, values used in the equation may not be precisely known, particularly the value of respiratory quotient of 0.8 (R), which may shift depending upon the relative utilization of carbohydrate, protein, and fat. The breath-to-breath variability of respiratory rate or tidal volume that may occur during invasive BiPAP mode ventilation has also not been accounted for.
Conclusion
The PaCO2–PETCO2 difference is individual specific in mechanically ventilated children. It is not affected by the disorder leading to mechanical ventilation. The P(A-a)O2 difference has a minor but a significant influence upon PaCO2–PETCO2 difference. In a “steady” state of mechanical ventilation the PaCO2–PETCO2 difference is static.
Acknowledgments
The authors appreciate the technological assistance provided by Simon O'Donnelly and Mahes Salgado in manuscript preparation. CDA Goonasekera was a fellow funded by the Commonwealth Scholarship Commission, London.
Footnotes
Source of Support: Nil
Conflict of Interest: None declared.
References
- 1.Kelly AM. Review article: Can venous blood gas analysis replace arterial in emergency medical care. Emerg Med Australas. 2010;22:493–8. doi: 10.1111/j.1742-6723.2010.01344.x. [DOI] [PubMed] [Google Scholar]
- 2.McArthur CD. AARC. AARC clinical practice guideline. Capnography/capnometry during mechanical ventilation - 2003 revision and update. Respir Care. 2003;48:534–9. [PubMed] [Google Scholar]
- 3.Sorenson HM, Shelledy DC. AARC. AARC clinical practice guideline. Intermittent positive pressure breathing - 2003 revision and update. Respir Care. 2003;48:540–6. [PubMed] [Google Scholar]
- 4.Walsh BK, Crotwell DN, Restrepo RD. Capnography/capnometry during mechanical ventilation: 2011. Respir Care. 2011;56:503–9. doi: 10.4187/respcare.01175. [DOI] [PubMed] [Google Scholar]
- 5.Eipe N, Doherty DR. A review of pediatric capnography. J Clin Monit Comput. 2010;24:261–8. doi: 10.1007/s10877-010-9243-3. [DOI] [PubMed] [Google Scholar]
- 6.Tingay DG, Stewart MJ, Morley CJ. Monitoring of end tidal carbon dioxide and transcutaneous carbon dioxide during neonatal transport. Arch Dis Child Fetal Neonatal Ed. 2005;90:F523–6. doi: 10.1136/adc.2004.064717. [DOI] [PMC free article] [PubMed] [Google Scholar]
- 7.Williams AJ. ABC of oxygen: Assessing and interpreting arterial blood gases and acid-base balance. BMJ. 1998;317:1213–6. doi: 10.1136/bmj.317.7167.1213. [DOI] [PMC free article] [PubMed] [Google Scholar]
- 8.Bland JM, Altman DG. Statistical methods for assessing agreement between two methods of clinical measurement. Lancet. 1986;1:307–10. [PubMed] [Google Scholar]
- 9.Trillò G, von Planta M, Kette F. ETCO2 monitoring during low flow states: Clinical aims and limits. Resuscitation. 1994;27:1–8. doi: 10.1016/0300-9572(94)90014-0. [DOI] [PubMed] [Google Scholar]
- 10.Sharma SK, McGuire GP, Cruise CJ. Stability of the arterial to end-tidal carbon dioxide difference during anaesthesia for prolonged neurosurgical procedures. Can J Anaesth. 1995;42:498–503. doi: 10.1007/BF03011688. [DOI] [PubMed] [Google Scholar]
- 11.Khan FA, Khan M, Abbasi S. Arterial to end-tidal carbon dioxide difference in neurosurgical patients undergoing craniotomy: A review of practice. J Pak Med Assoc. 2007;57:446–8. [PubMed] [Google Scholar]
- 12.Nunn JF, Hill DW. Respiratory dead space and arterial to end-tidal carbon dioxide tension difference in anesthetized man. J Appl Physiol. 1960;15:383–9. doi: 10.1152/jappl.1960.15.3.383. [DOI] [PubMed] [Google Scholar]
- 13.Takki S, Aromaa U, Kauste A. The validity and usefulness of the end-tidal pCO 2 during anaesthesia. Ann Clin Res. 1972;4:278–84. [PubMed] [Google Scholar]
- 14.Weinger MB, Brimm JE. End-tidal carbon dioxide as a measure of arterial carbon dioxide during intermittent mandatory ventilation. J Clin Monit. 1987;3:73–9. doi: 10.1007/BF00858353. [DOI] [PubMed] [Google Scholar]
- 15.Chhibber AK, Kolano JW, Roberts WA. Relationship between end-tidal and arterial carbon dioxide with laryngeal mask airways and endotracheal tubes in children. Anesth Analg. 1996;82:247–50. doi: 10.1097/00000539-199602000-00005. [DOI] [PubMed] [Google Scholar]
- 16.Yamanaka MK, Sue DY. Comparison of arterial-end-tidal PCO2 difference and dead space/tidal volume ratio in respiratory failure. Chest. 1987;92:832–5. doi: 10.1378/chest.92.5.832. [DOI] [PubMed] [Google Scholar]
- 17.Carlo WA, Ambalavanan N. Conventional mechanical ventilation: Traditional and new strategies. Pediatr Rev. 1999;20:e117–26. [PubMed] [Google Scholar]
- 18.McSwain SD, Hamel DS, Smith PB, Gentile MA, Srinivasan S, Meliones JN, et al. End-tidal and arterial carbon dioxide measurements correlate across all levels of physiologic dead space. Respir Care. 2010;55:288–93. [PMC free article] [PubMed] [Google Scholar]
- 19.Fletcher R, Jonson B. Deadspace and the single breath test for carbon dioxide during anaesthesia and artificial ventilation. Effects of tidal volume and frequency of respiration. Br J Anaesth. 1984;56:109–19. doi: 10.1093/bja/56.2.109. [DOI] [PubMed] [Google Scholar]
- 20.Shankar KB, Moseley H, Kumar Y, Vemula V. Arterial to end tidal carbon dioxide tension difference during caesarean section anaesthesia. Anaesthesia. 1986;41:698–702. doi: 10.1111/j.1365-2044.1986.tb12834.x. [DOI] [PubMed] [Google Scholar]
- 21.Shankar KB, Moseley H, Vemula V, Kumar Y. Physiological dead space during general anaesthesia for caesarean section. Can J Anaesth. 1987;34:373–6. doi: 10.1007/BF03010136. [DOI] [PubMed] [Google Scholar]
- 22.Shankar KB, Moseley H, Vemula V, Ramasamy M, Kumar Y. Arterial to end-tidal carbon dioxide tension difference during anaesthesia in early pregnancy. Can J Anaesth. 1989;36:124–7. doi: 10.1007/BF03011432. [DOI] [PubMed] [Google Scholar]
- 23.Shankar KB, Moseley H, Kumar Y. Negative arterial to end-tidal gradients. Can J Anaesth. 1991;38:260–1. doi: 10.1007/BF03008164. [DOI] [PubMed] [Google Scholar]
- 24.Rich GF, Sconzo JM. Continuous end-tidal CO2 sampling within the proximal endotracheal tube estimates arterial CO2 tension in infants. Can J Anaesth. 1991;38:201–3. doi: 10.1007/BF03008145. [DOI] [PubMed] [Google Scholar]
- 25.Russell GB, Graybeal JM, Strout JC. Stability of arterial to end-tidal carbon dioxide gradients during postoperative cardiorespiratory support. Can J Anaesth. 1990;37:560–6. doi: 10.1007/BF03006326. [DOI] [PubMed] [Google Scholar]
- 26.Jones NL, Robertson DG, Kane JW. Difference between end-tidal and arterial PCO2 in exercise. J Appl Physiol Respir Environ Exerc Physiol. 1979;47:954–60. doi: 10.1152/jappl.1979.47.5.954. [DOI] [PubMed] [Google Scholar]


