Abstract
Cancer cells create a unique microenvironment in vivo that enables migration to distant organs. To better understand the tumor micro-environment, special tools and devices are required to monitor the interactions between different cell types and the effects of particular chemical gradients. Our study presents the design and optimization of a versatile chemotaxis device, the nano-intravital device (NANIVID), which consists of etched and bonded glass substrates that create a soluble factor reservoir. The device contains a customized hydrogel blend that is loaded with epidermal growth factor (EGF), which diffuses from the outlet to create a chemotactic gradient that can be sustained for many hours in order to attract specific cells to the device. A microelectrode array is under development for quantification of cell collection and will be incorporated into future device generations. Additionally, the NANIVID can be modified to generate gradients of other soluble factors in order to initiate controlled changes to the microenvironment including the induction of hypoxia, manipulation of extracellular matrix stiffness, etc. The focus of the article is to present the design and optimization of the device towards wide ranging applications of cancer cell dynamics in vitro and, ultimately, implantation for in vivo investigations.
Keywords: cancer cell migration, microfabrication, impedance spectroscopy, 3-D culture, hypoxia
1 Introduction
Cell migration is critical for the survival, development and maintenance of multicellular organisms.1–3 External stimuli are required for guiding normal cellular migration,4–7 but tumor cells can respond to these signals in unintended ways, leading to tumor progression8 and dissemination.7 A tumor is a dynamic system that can evolve and adapt its microenvironment to facilitate angiogenesis and metastasis.9–11 As a tumor grows, some regions lose access to sufficient oxygen tension, producing a hypoxic environment.12 Studies have shown that hypoxia plays an important role in tumor progression, affecting the metastatic spread of cancer and the selection for cells with a more aggressive phenotype.13,14 Deeper understanding of the processes involved in tumor progression, such as chemotaxis and hypoxia, requires robust technologies that are capable of changing the cellular microenvironment both in vitro and in vivo.
A variety of cellular chemotaxis assays have been developed to understand cellular migration and the underlying mechanisms.15–17 Chemoattractant gradients have been formed through microfluidic devices 18,19 and by using spatial patterning techniques.20 Additionally, 3-D assays 21–23 have been developed to mimic the in vivo microenvironment; however, most of these assays are created for in vitro characterization studies, and there are significant difficulties in transitioning them to in vivo applications. The only known chemotaxis assay that can be easily used both in vitro and in vivo is a needle-based assay.24 In this assay, a stainless steel needle (100 μm inner diameter) is loaded with matrigel and growth factors and used to create a physiologically relevant gradient to attract cells. This assay was able to collect invasive tumor cells, whose gene expression profile was determined.25 However, this assay does have some limitations, including that the gradient is sustained for only a few hours and in vivo imaging of the tumor during the assay is not possible.
We have developed a novel research tool, called the nanointravital device (NANIVID),26 to replace the existing needle assay. The NANIVID is made of biocompatible, optically transparent materials and contains a customized hydrogel for the sustained release of encapsulated materials over several days. The devices can be loaded with a chemoattractant, such as EGF, or agents to induce changes in the tumor microenvironment, such as cobalt chloride (CoCl2), which can artificially induce hypoxia.27,28 When hydrated, the hydrogel expands and passively releases the loaded factor into the environment through the single outlet of the device. When loaded with EGF, the device attracts cells through the active migration of the cells towards the chemoattractant gradient released from the device. To monitor the real-time cell migration into the device, a scaled down electrode system is designed to detect the presence of cells based on a change in impedance. The NANIVID can also be used as a disseminator of chemical agents to manipulate the microenvironment as desired. The fabrication process and materials were selected so that it can be used easily in both existing tissue culture techniques (2-D, 3-D) and in animals.
2 Materials and Methods
2.1 Device Fabrication and Loading
The fabrication of the devices has been described previously.26 For the reservoir chamber, a gold and chrome film was deposited on both sides of Pyrex® glass substrates using electron beam evaporation. Photoresist was spun on both sides followed by photolithography. Both metals were etched on one side using Chromium etchant 1020 (Transene) and Gold Etchant TFA (Transene) followed by an isotropic etch of the Pyrex® substrate using hydrofluoric acid to form the chamber. The remaining photoresist and metals were removed from both sides, leaving the transparent glass substrates. The finished substrates were diced and cleaned in acetone, isopropanol, and ethanol. Poly(dimethylsiloxane) (PDMS, Sylgard) was spun on an acetate sheet, and the top covers of the device were placed on the PDMS, which was then cured overnight at 60°C. Both the bottom reservoir and the PDMS-coated top cover were exposed to oxygen plasma for 15 s. The hydrogel consisted of 20% polyethylene glycol diacrylate (PEGDA, Glycosan) blended with 10% methoxy polyethylene glycol-550 monoacrylate (PEGMA, Sartomer) and Irgacure 2959 (BASF). The hydrogel was mixed with EGF (Invitrogen Corporation) and was cured under UV light for 2 min. For the hypoxia experiment, devices were loaded with 20 mM CoCl2 (Sigma-Aldrich). The two pieces were then sealed together to form the finished device.
2.2 Device Design
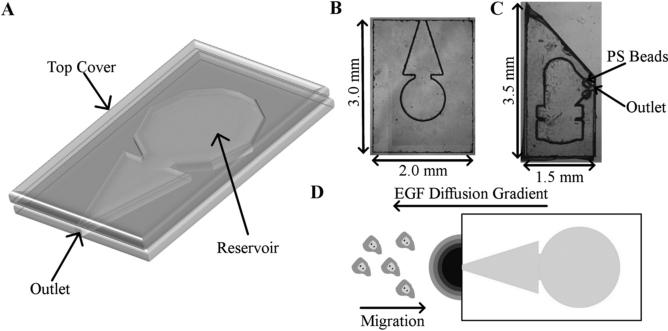
Two different device designs were utilized in this work. In the 2-D experiments, a rectangular device design was used, as shown in Figs. 1(a) and 1(b). The hydrogel was loaded and cured in the central round region of the device. A triangular chamber allowed room for the diffusion of EGF and led to a single outlet in the device. A point gradient was thus produced from this outlet and the nearby cells were attracted towards the device. For the 3-D experiments, a narrower, pointed device was designed to allow for easier insertion into a tumor, as shown in Fig. 1(c). This design also incorporated fluorescent polystyrene beads (FluoSpheres®, Invitrogen) in the top cover to indicate the device opening. Due to the use of optically transparent materials, finding the device opening while inside a tumor would be difficult without these fluorescent markers. The pits in the top cover for the fluorescent beads were made using the same process as the reservoir, and the beads were loaded before placing the top covers on the PDMS sheet.
Fig. 1.
(a) A 3-D representation of the in vitro NANIVID. (b) Optical image of in vitro device. (c) Optical image of the device used in the 3-D chemotaxis experiments. (d) Experimental set up of the 2-D chemotaxis assay. The direction of the EGF diffusion and the cell migration are shown.
2.3 Device Release Dynamics
Devices were loaded with Rhodamine-EGF (R-EGF, Invitrogen Corporation) mixed into the hydrogel blend and bonded as described above. In the bulk release experiments, multiple devices were placed in each well of a 12-well plate. The devices were hydrated in starvation media consisting of L15 media (Sigma-Aldrich) and 0.8% bovine serum albumin (BSA, Sigma-Aldrich), degassed briefly by low vacuum treatment, and inspected using an optical microscope. Samples were then collected from each well at various time intervals and stored at −20°C until measurements. The collected samples were transferred into 96-well plates along with standard solutions and analyzed using the Infinite M200 Plate Reader (Tecan). The fluorescence intensity was then converted into a concentration using a standard curve. To quantify the chemical gradient released from the device, R-EGF loaded devices were hydrated in a Petri dish with starvation media and then transferred to a MatTek® glass-bottom dish. A thin layer of mineral oil (Sigma-Aldrich) was cast on the top of the media to reduce evaporation and the device was imaged using a fluorescence microscope. Time lapse experiments were performed and the images were analyzed using ImageJ software (NIH). The fluorescence intensity was measured from the outlet of the device and converted into an R-EGF concentration using the standard curve.
2.4 Cell Culture in 2-D and 3-D
For the 2-D experiments, MTLn3 MenaInv and MTLn3 rat mammary adenocarcinoma cells were cultured in polysty-rene dishes using alpha-MEM media (Invitrogen Corporation). The media was supplemented with 5% fetal bovine serum (FBS, Gemini Bio-Products), 0.2% Sodium Bicarbonate (Sigma-Aldrich), and penicillin/streptomycin (Gibco/ Invitrogen Corporation). The cells were kept at 37°C under humid conditions with 5% carbon dioxide. For the 3-D experiments, MDA-MB-231 human mammary carcinoma cells expressing green fluorescent protein (GFP) were suspended as a single cell population and mixed in matrigel (BD Science) at a concentration of 106 cells/mL. Approximately 200 μL of matrigel containing MDA-MB-231 cells was crosslinked at 37°C in a glass-bottom dish. The cells were cultured in DMEM (Invitrogen Corporation) containing 10% FBS (Atlanta Biologicals, Inc.) and penicillin/ streptomycin.
2.5 Cell Migration Assay (2-D)
MTLn3 MenaInv cells were starved in L15 media including 0.8% BSA for 2.5 h before the migration assay. Devices loaded with various concentrations of EGF (0, 4.5, 5, 6, 7, and 7.5 μM) were hydrated in starvation media and then transferred to the dishes that contained the starved cells. Figure 1(d) shows the direction of the EGF diffusion and cell migration in this experimental setup. Images were collected every 2 min under a phase contrast microscope for a total of four hours. The collected images were analyzed using ImageJ software (NIH). The centroid of each cell was tracked using the ROI Tracker plugin. The cell tracking data was analyzed to generate vector plots and calculate the turning frequency, directionality, chemotaxis index, and effective chemotaxis index of the cells. For each concentration used, 10 to 25 cells were tracked in three separate experiments.
2.6 Cell Invasion in 3-D
MDA-MB-231 cells expressing GFP were starved overnight in L15 media supplemented with 0.8% BSA and 0.5% FBS. Devices loaded with hydrogel containing 2 μM EGF were hydrated in matrigel and degassed by low vacuum treatment. The degassed devices were examined under a microscope to assure that no air bubbles were trapped in the device chamber. Devices were then inserted into the matrigel matrix containing the starved MDA-MB-231 cells. The region near the device opening was imaged at different time intervals using a Leica SP5 confocal microscope. Z-stacks of this region were analyzed using ImageJ software.
2.7 Electrode Fabrication and Encapsulation
As mentioned above, the development and testing of these encapsulated electrodes are directed at scaling available designs down to be integrated into the NANIVID. Impedance spectroscopy has been used previously to measure cell proliferation on electrodes.29,30 Interdigitated indium tin-oxide (ITO) electrodes and gold line electrodes were fabricated using photolithography.31 The substrates were diced, cleaned, and covered with a PDMS top cover. The PDMS top cover was cast using an SU-8 mold. To fabricate the mold, a 100-mm silicon wafer was Piranha cleaned using a 3:1 mixture of H2SO4 (Transene Company): H2O2 (Puritan Products). SU-8 2100 (Microchem) was spun on the wafer at 2000 rpm for 30 s. The wafer was baked at 65°C for 10 min and 95°C for 45 min followed by exposure in an EVG 640 Contact Aligner. Post exposure bakes were performed at 65°C for 5 min and 95°C for 30 min, followed by development in SU-8 developer (Microchem). The SU-8 mold surface was treated with SigmaCote (Sigma-Aldrich), and the PDMS solution was cast on the treated mold. The PDMS solution was prepared by mixing the polymer and curing agent at a 10:1 ratio. The PDMS was cured on the mold overnight at 60°C. The cured PDMS was removed from the mold and cut according to the device dimensions. The microelectrode substrate and the PDMS cover were treated with oxygen plasma to activate their surfaces and then bonded together.
2.8 Impedance Measurements
The bonded electrodes were sterilized overnight under UV light. After rinsing with phosphate buffered saline, the device was exposed to an oxygen plasma for 5 min to improve cell adhesion. Alpha-MEM was added and baseline impedance measurements were taken using the PARSTAT 2265 Potentiostat (Princeton Applied Research). The cells were suspended in media and added to the Petri dish containing the device. The cells adhered to the electrodes and the impedance was measured in triplicate at various cellular confluences. Impedance measurements were taken in the frequency range from 1 Hz to 1 MHz at 10 mV rms with seven points per decade. The cells were imaged at each measurement over a period of three to four days, and the cell coverage was determined by analyzing images using ImageJ. The cell impedance data was normalized to the baseline (i.e. media only) impedance in order to determine the percent change at each frequency so that the ideal frequency range for these measurements could be identified. The impedance values at the optimal frequency were plotted against the corresponding coverage of cells on the electrodes. When the electrodes are incorporated into the NANIVID, these plots will serve as calibration curves to determine cell coverage from the impedance value at the optimal measurement frequency.
2.9 Mimicking Hypoxia and HIF1-α Immunofluorescence
CoCl2 was selected as a hypoxia mimicking agent for use with MTLn3 cells. The cells were cultured on UV sterilized glass coverslips for 24 h, after which a CoCl2-loaded device and fresh culture media were added. The cells were then incubated with the device for 6 h. Reference marks were made on the coverslip at the end of experiment to note the position of the device. The cells were fixed in a 4% paraformaldehyde (Sigma-Aldrich) solution for one hour, then permeabilized in 0.2% Triton-X 100 (Sigma-Aldrich) for 15 min and blocked using 5% FBS (Atlanta Biologicals, Inc.). A 1:50 dilution (40 μg/mL) of mouse monoclonal antibody to HIF1-α (Abcam Inc.) was added to the cells overnight at 4°C. A 1:100 dilution (14 μg/mL) of DyLight™ 649-conjugated donkey anti-mouse antibody (Ex/Em: 649/670 nm, Jackson ImmunoResearch Lab Inc.) was then incubated at 37°C for one hour. Finally, a 1:200 dilution (5 μg/mL) of DAPI nucleic acid stain (Ex/Em: 358/461 nm, Invitrogen Corporation) was incubated at 37°C for 15 min. Fluorescence imaging was performed on a Leica scanning confocal microscope and Leica software was used for image analysis. The image was divided into 50 × 775 μm2 regions and analyzed with the Leica software to calculate the DyLight™ 649 and DAPI intensities. Three CoCl2 loaded and three empty devices were compared.
3 Results and Discussion
3.1 EGF Gradient Formation
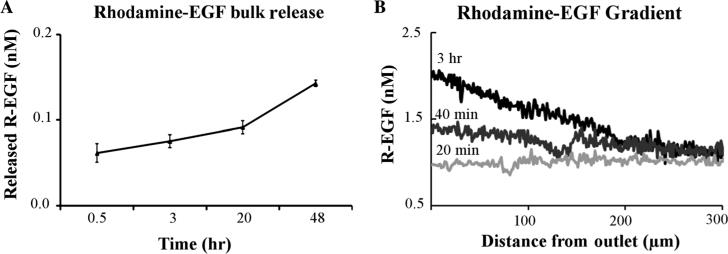
Polyethylene glycol based (PEG-based) hydrogel systems have been shown to release biologically active growth factors into the surrounding environment in a controlled fashion.32 A custom blend of PEGDA (20% w/v) and PEGMA (10% w/v) hydrogel was used to create a highly porous matrix from which loaded chemical agents could passively diffuse and establish a concentration gradient. R-EGF was used in a device release study to characterize the chemical gradient released from the device. Figure 2(a) shows the bulk release profile of R-EGF from the device over time. In these experiments, a slow and sustained release of the growth factor was observed. An average of more than 20% of the total growth factor in the hydrogel was released from the device over a period of 48 h. The chemical diffusion gradient from the devices was measured over the same duration as the cellular migration studies. Figure 2(b) shows the R-EGF gradient from the device outlet. The hydrogel system used in the device was self sufficient in releasing the entrapped molecules into the environment in that it required no external input. The gradient profile was flat in the first 20 min of the experiment and started to rise after 30 min, reaching a maximum value after three hours, as shown in Fig. 2(b). At 40 min, the gradient (the percent difference between the front and back of the cell) across a 10 μm cell within 250 μm of the device was about 0.7%. This value rose to 2.2% at three hours.
Fig. 2.
Rhodamine-EGF release from the device. (a) The bulk release of R-EGF into the dish from the device. (b) R-EGF gradient profile along the device axis over time.
3.2 Cell Migration Studies
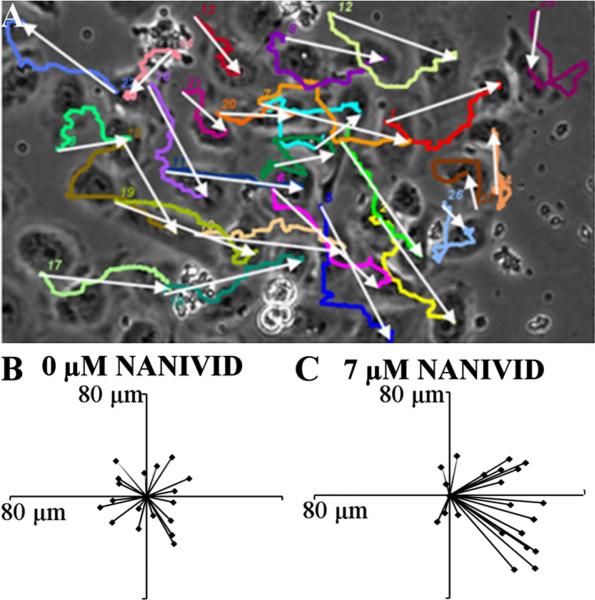
Chemotaxis is the directed movement of cells up a chemical concentration gradient. These devices were able to create a suitable shallow growth factor gradient to induce cancer cells (MTLn3 MenaInv) to migrate toward the device. The devices were loaded with a hydrogel blend containing various concentrations of EGF and tested in vitro. The migration of the cells can be depicted by a vector plot, which shows the overall movement of each cell. Vector plots are an ideal way to determine the phenotypical behavior of these cells in the presence of chemoattractant gradients. Figure 3(a) is a representative image of cells tracked in the last frame of an experiment with the device located on the right-hand side. Each white arrow shows the overall displacement (or vector) of the cell in that particular experiment, while the colored lines (online version) depict the actual path of the cells. In the vector plots, all of the cell vectors were superimposed on one common origin to display the overall trend. Figure 3(b) shows the control experiment (0 μM EGF) in which the cells moved, as expected, in random directions. In the control experiment, the magnitude of each vector was small, indicating that these cells did not move far from their initial location due to the randomness of their movement. When the EGF loaded devices were used, the growth factor gradient generated from the device outlet caused a change in cell movement. The cells detected the gradient in their microenvironment and migrated toward the device. As the EGF loading was increased, the cell response became more pronounced with a maximum response observed at 7 μM loading, as shown in Fig. 3(c). The devices loaded with EGF concentrations below and above 7 μM caused the cells to start losing directionality due to a weak EGF gradient and a higher degree of receptor saturation, respectively.
Fig. 3.
Vector plots of MTLn3 MenaInv cells responding to the EGF gradient from the device. (a) A representative image of final frame of the tracked cells in EGF gradient, with the device on the right side (not shown). White arrows represent the displacement of the cells and color lines (see online version) are the paths traveled by these cells. (b) and (c) Vector plots of the cells from the control and 7 μM device experiment, in which all the vectors were superimposed at the common origin.
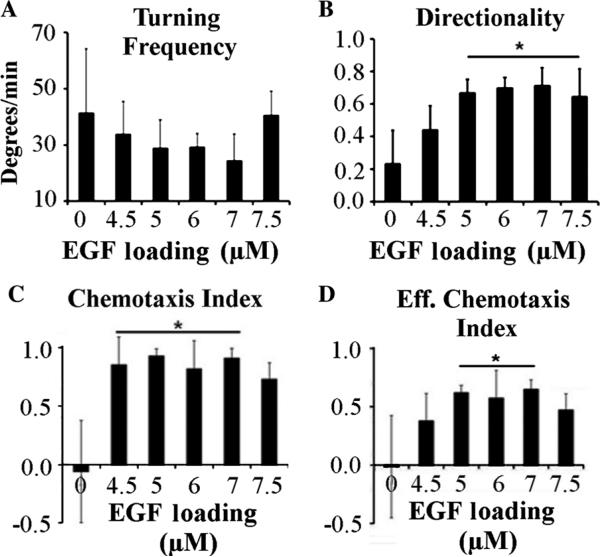
The turning frequencies of the cells, as shown in Fig. 4(a), indicate that, as the loading of EGF in the device was increased up to 7 μM, the turning frequency of the cells decreased. The rate of turning was higher in the control experiments with no EGF in the device, with an average recorded value of 41.4 deg/min. The minimum turning frequency observed was at 7 μM, with an average value of 24:4 deg/min. The cells with a higher turning frequency were less directional and moved randomly for the duration of the experiment, with the majority of the cells ending up near the starting position. Directionality is the ratio between the displacement and the total path traveled by the cell. Figure 4(b) shows the directionality of MTLn3 MenaInv in the concentration gradient of the chemoattractant, which shows the opposite trend as compared to the turning frequency. The lowest directionality was observed in the negative control (0 μM) device, while the highest directionality was recorded with the 7 μM loaded devices, with an average value of 0.71, approximately three times greater than the control. The average value of the directionality was reduced in devices with an EGF concentration greater than 7 μM, likely due to EGF receptor saturation. The average values of directionality were more than 0.6 for all the devices with an EGF concentration of 5 μM or more. This implies that the effect on cells will be maintained for long periods of time in agreement with the EGF release results of Fig. 2(b). Essentially, the concentration of the EGF released from the device will decrease after reaching a maximum, at a time beyond the gradient measurements shown in Fig. 2(b). Even at these lower concentrations, the device will still form a gradient that can attract cells, extending to useful life of a single device.
Fig. 4.
Quantification of cellular motility. (a) Turning frequency of MTLn3 MenaInv cells in the presence of EGF-loaded device (b) Directionality of the same cells. (c) The chemotaxis index and (d) the effective chemotactic index (directionality * chemotaxis index) of the cells in the EGF gradient generated by the NANIVID. [Error bars represent ± standard deviation from three experiments, 10 to 25 cells in each experiment. Statistical significance from the control is indicated by the line with star on the top (p < 0.05)].
The degree of chemotaxis can be calculated as the chemotaxis index, i.e., the cosine of the angle between the vector plot and the device axis. This is plotted in Fig. 4(c), showing that MTLn3 MenaInv cells respond to the growth factor gradient. EGF-loaded devices showed an average chemotaxis index greater than 0.8 due to the production of a long-lived EGF gradient, while the control devices had a chemotaxis index of nearly zero. While the directionality demonstrated the mobility of the cells, it did not correlate the chemical gradients with the direction of migration. On the other hand, the chemotaxis index provided information about the cellular response to a chemoattractant gradient, but did not show the distance travelled. Combining the two yielded the effective chemotaxis index, which helped determine the optimum chemoattractant concentration range.17 Figure 4(d) shows the effective chemotaxis index of MTLn3 MenaInv cells, which gives an optimum concentration range for this device from 5 μM to 7 μM. A maximum of 0.649 effective chemotaxis index was measured in the device loaded with 7 μM EGF, while the effective chemotaxis index was close to zero in the control experiments. It should be noted that MTLn3 MenaInv cells exhibit contact inhibition and change directions after contacting other cells. In the migration studies, the cells were tracked for the entirety of the experiment, including after multiple collisions with the neighboring cells, which may give rise to the relatively large error bars.
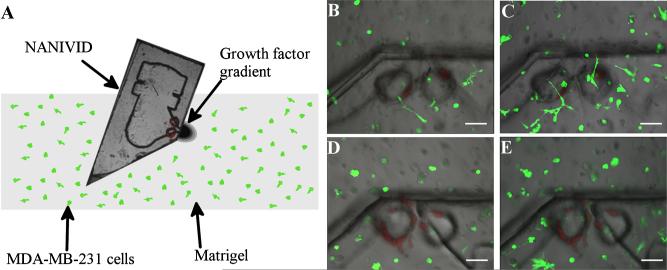
This device was able to attract the cells in a 2-D environment by establishing a growth factor gradient. In preparation for in vivo studies, the design was modified and tested in vitro in 3-D culture. In this new design, the front of the device was diced at a 45° angle, resulting in a sharp edge for easy insertion. In addition, the outlet was moved to the side of the device to eliminate the possibility of clogging the device opening during insertion and marked with fluorescent polystyrene beads embedded in the top cover. Figure 5(a) shows a schematic of the 3-D cell invasion assay, in which MDA-MD-231 cells expressing GFP were cultured in a matrigel-based 3-D matrix. The device was inserted into the matrix, generating a 3-D gradient from the outlet. Figure 5 (b) shows the cells in the matrigel near the device on the first day of the experiment. After 24 h, the number of cells increased [Fig. 5(c)]. The corresponding images for the control, a NANIVID with no EGF loaded, are shown in Figs. 5(d) and 5(e). The devices were inserted into a matrigel matrix containing similar distributions and concentration of starved cells. After 24 h, the MDA-MB-231 cells were polarized toward the EGF device, as seen in Fig. 5(c). These initial experiments demonstrated that the growth factor gradient from the NANIVID not only polarized cells toward the device opening in a 3-D matrix, but also increased the population of cells near the outlet by active migration of cells in 3-D environment in 24 h. Further experiments are in progress to evaluate the device in vivo and will be reported in future publications.
Fig. 5.
MDA-MB-231 cells 3-D invasion assay. (a) Schematic of the assay. A side channel NANIVID is inserted into matrigel containing MDA-MB-231 GFP expressing cells. EGF (2 μM) device at (b) 0 and (c) 24 h, showing a top view of the device, with green fluorescent cells and red fluorescent polystyrene beads (see online version). The control device at (d) 0 and (e) 24 h. Scale bars are 100 μm.
3.3 Impedance Spectroscopy Measurements
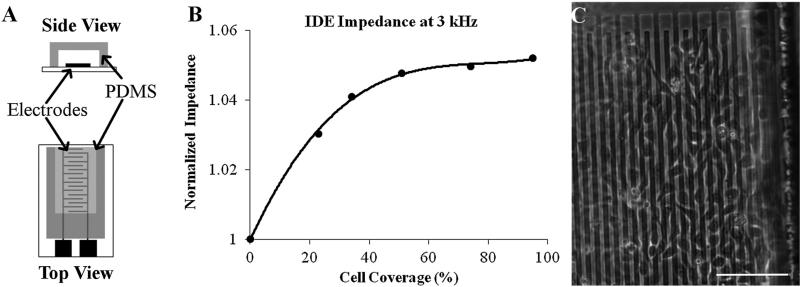
The NANIVID is under optimization to collect cells both in vitro and in vivo. In order to measure the real-time status of the device, a non-invasive, cell counting electrode system is being developed in parallel and will be integrated into the device in the future. MTLn3 MenaInv cells were grown on top of various electrode designs both on open dies and inside bonded devices. The characterization of open electrodes with different materials and designs is presented elsewhere.31 Here, the focus is on measuring cellular survival and proliferation on the patterned electrodes inside the bonded devices. A low density of cells (104/mL) was seeded and allowed to proliferate for three days on the covered ITO interdigitated electrodes. Each of the 64 fingers on the interdigitated electrodes were 10 μm wide, 375 μm long, and separated by 5 μm. The devices were kept sterile and the measurement methods were compatible with standard cell culture protocols. MTLn3 MenaInv cells adhered to the electrodes after four hours and grew normally as on a glass substrate for multiple days. The impedance spectra collected at the various times were normalized to the media only baseline measurements to identify the most sensitive frequencies. Figure 6(b) shows the response of the ITO interdigitated at 3 kHz, which was found to be the optimal frequency. It is observed that with low cell coverage there is a rapid change in impedance, while at higher densities the change begins to plateau. At 100% confluence, there is a 5% increase in impedance over the baseline measurement.
Fig. 6.
(a) Side and top views of the encapsulated electrodes used in this experiment. (b) The normalized real impedance of MTLn3 MenaInv cells on ITO interdigitated electrodes. The plot shows the relationship between the impedance change and the percent cell coverage area. (c) An optical image showing the cell attachment on the electrodes. The scale bar is 100 μm.
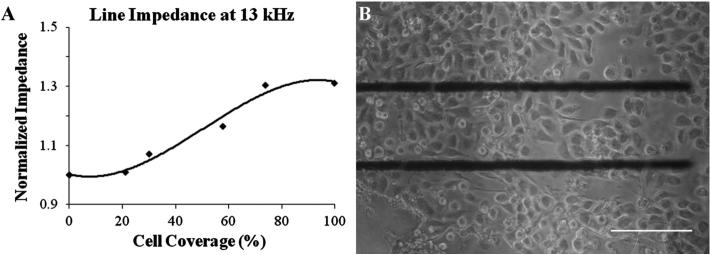
Initially, the electrodes were made of indium-tin oxide (ITO) because the devices needed to be transparent, but due to reduction in the size of the device, the available area of the electrode was limited. Fortunately, it was found that an electrode system containing just two parallel lines showed a significantly higher response than the inter-digitated system.31 Also, the high resistivity of ITO caused a high background impedance, which obscured the effects of the cells on the total impedance of the system. Therefore, the next generation of electrodes was made with gold. Figure 7(a) shows the response of the gold line electrodes, which were 550 μm long, 10 μm wide, and separated by 100 μm, for which the optimum frequency was determined to be 13 kHz. At 100% confluence, the impedance was 30% greater than the baseline, a significant improvement over the ITO devices. These line electrodes are not transparent; however, due to the small feature size, they can be easily incorporated into future generations of the NANIVID without significantly interfering with the imaging, as shown in Fig. 7(b).
Fig. 7.
(a) The normalized real impedance of MTLn3 MenaInv cells on gold line electrodes. The plot shows the change in impedance versus the percent cell coverage area. (b) An optical image showing the cell attachment on the gold electrodes. The scale bar is 100 μm.
3.4 Mimicking Hypoxia
A second application for the device is to act as a dispersant of specific chemical agents in the tumor microenvironment in order to manipulate that environment in ways of interest. A hypoxia mimicking agent was selected due to the link between hypoxia and tumor progression and metastasis.12 Hypoxia-inducible factors (HIFs) are transcription factors involved in the cellular adaptive response to hypoxia. HIF1-α, a subunit of HIF-1, is regulated by oxygen levels and growth factors.33 Under normal oxygen conditions, HIF1-α is readily degraded by the ubiquitin-proteasome pathway.34 However, under hypoxia, the HIF1-α protein is stabilized and will accumulate in the cell. Cobalt has been shown to bind to HIF1-α and stabilize the protein, preventing degradation and mimicking the effects of hypoxia.35
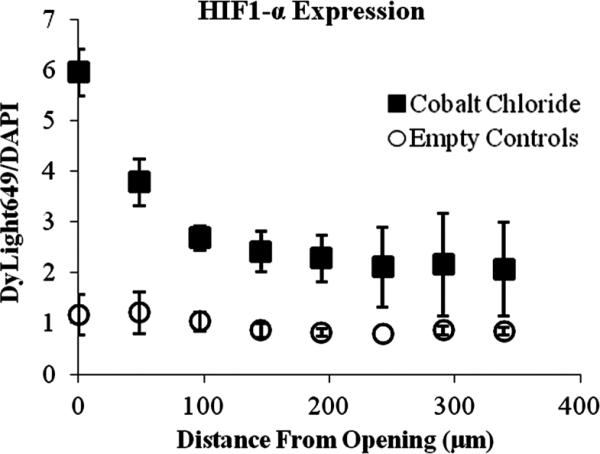
To investigate the response of MTLn3 cells to an artificially induced hypoxic environment, devices were fabricated and loaded with 20 mM CoCl2. The devices were incubated with the cells for 6 h, followed by immunostaining for the presence of HIF1-α. The ratio of the intensity of the DyLight™649 secondary antibody to the intensity of the DAPI nuclear stain provided the levels of expression of HIF1-α while compensating for slight differences in cell density in regions of interest. As seen in Fig. 8, for the three CoCl2 loaded devices, the DyLight™ 649/DAPI intensity ratio was highest near the device opening and then decreases with distance demonstrating the establishment of a CoCl2 gradient. Three control devices, with no CoCl2, also plotted in Fig. 8, showed no noticeable changes in HIF1-α expression. A few hundred microns away from the device opening, the level of HIF1-α expression of the cells incubated with the CoCl2 loaded devices was near the level in the control experiments. These results show that the NANIVID can be used as a delivery vehicle of chemicals to manipulate the tumor microenvironment in ways of interest, such as using CoCl2 to chemically mimic hypoxia. Other induction targets including hypoglycemia and extracellular matrix stiffness will be investigated in the future.
Fig. 8.
The ratio of DyLight 649 to DAPI showing an increase in HIF1-α expression near the inlet of the CoCl2 loaded NANIVIDs (■) compared to the control (○) (n = 3).
4 Conclusions
A micro-electro-mechanical based device, the NANIVID, was fabricated using optically transparent, biocompatible materials and customized hydrogel systems. The hydrogel-based reservoir created a growth factor gradient and was able to stimulate and attract cells even in a shallow gradient. The cell counting component was fabricated from both indium tin oxide and gold, and the initial characterization of different electrode designs was accomplished. The NANIVID was also used as dispersant to mimic a hypoxic environment in vitro. New designs of device are under development and are being optimized for use as an in vivo cell collecting device with a customized hydrogel system.
Acknowledgments
The authors would like to acknowledge Dr. Yubing Xie at the College of Nanoscale Science and Engineering for valuable discussions and access to her lab. This project is funded by NIH grant #U 54-CA126511-01 and NSF grant #DBI0922830.
Biography
 Waseem Khan Raja is a postdoctoral associate in the Department of Biomedical Engineering at Tufts University, Medford, Massachusetts. Currently he is focusing on tissue regeneration using biomaterials, stem cells, and electrotherapeutics strategies. In addition, he is developing a biomaterials-based drug delivery system. In 2010, he received his PhD in nanoscale science and engineering from University at Albany, New York, where he worked on the design and fab rication of an implantable device for studying tumor cell dynamics. His current research interests include BioMEMS, biomaterials for tissue regeneration, drug delivery and disease models.
 Michael R. Padgen is currently pursuing a PhD in nanoengineering at the College of Nanoscale Science and Engineering. He graduated from Saint Louis University in 2007 with a BS in mechanical engineering. He then moved to the University at Albany to study nanoengineering. He received an MS in 2009 for the design and testing of a BioMEMS sensor for hydration monitoring and the development of a platform for a high throughput immunological assay. After completion of his master's, he began work on the characterization and optimization of electrodes for use as a cell counter in the NANIVID. He has also recently begun investigations on the role of chemical and mechanical stimuli on the mechanical properties of cancer cells by utilizing a combined confocal scanning laser microscope and atomic force microscope.
 James K. Williams is a third year graduate student at CNSE pursuing a PhD in nano-engineering. He graduated from the University at Albany in 2005 with a BS in biology. After completing his undergraduate degree, he worked in the semiconductor industry for three years as an Etch Technician, gaining knowledge and experience in cleanroom processing and equipment. The group that he worked in designed and fabricated thin-film photodiode arrays for digital mam mography detectors. He began his graduate work in 2008, fabricating and testing piezoresistive silicon strain gauges for an aerospace application. Recently, he has worked on the development of the NANIVID, a device for in vivo studies of breast cancer metastasis. His research interests include utilizing nanotechnology in the development of medical devices and in the study of biological systems.
 Frank B. Gertler received his BA in zoology from the University of Wisconsin, Madison, in 1985, where he also received his PhD in oncology in 1992. He is currently a full professor at the Koch Institute for Integrative Cancer Research and Department of Biology at the Massachusetts Institute of Technology. His research is aimed at understanding how signaling pathways converge with cytoskeletal remodeling proteins to cause changes in cell movement and shape. Specifically, he is interested in how regulation of cytoskeleton controls various aspects of cell motility and morphology during development and in pathophysiological conditions such as metastatic cancer. He has authored nearly 100 peer-reviewed articles.
 Jeffrey B. Wyckoff was the Director of Intra-vital Imaging in the GLBPC at Einstein. His expertise lies in intravital imaging, cancer biology, and mouse models. He, along with collaborators Condeelis and Entenberg, developed the multiphoton-based intravital imaging of living tumors in mice. He has also collaborated with Condeelis and Castra-cane in the development of the collection and induction NANIVIDs. This work led to the discovery of the paracrine loop between tumor cells and macrophages, leading to enhanced invasion and metastasis. As Director of Intravital Imaging at Einstein, he has trained numerous graduate students, post-docs, and collaborators to use intravital imaging. He has recently moved to a position at the Friedrich Miescher Institute in Basel, Switzerland.
 John S. Condeelis is The Judith and Burton P. Resnick chair in translational research, professor and co-chairman of the Department of Anatomy and Structural Biology at the Albert Einstein College of Medicine (AECOM). He is the director of the Cancer Center program “Tumor microenvironment and Metastasis” and co-director, with Robert Singer, of the Gruss Lipper Biophotonics Center of AECOM, a center dedicated to the development and application of optical imaging tech nologies. His training is in nuclear physics, optical physics and cell biology.Hiscurrentresearchinterestisintumorcellmotility,chemotaxis and invasion during metastasis. He has pioneered the use of combined multiphoton imaging with expression analysis to derive gene expression signatures that define the pathways used by tumor cells in mam-mary tumors to move and invade blood vessels. He has authored more than 230 scientific papers on variousaspectsof cell and cancer biology, and optical imaging.
 James Castracane received the BS degree in physics from Canisius College, Buffalo, New York, in 1976 and his Ph D in physics from The Johns Hopkins University, Baltimore, Maryland, in 1982. He is professor (founding faculty) and head of the Nano-bioscience Constellation in the College of Nanoscale Science and Engineering (CNSE) at the University at Albany-SUNY. His research interests encompass fundamental materials science, optoelectronics and MEMS. His current research focus is on nanobioscience. Prior to joining CNSE in 1998, his private sector experience involved positions at high technology R & D companies including chief operating officer at InterScience, Inc. from 1994 to 1998. As director of the New York State Center for Advanced Technology in Nanomaterials and Nanoelectronics from 2004 to 2009, he continued to assist in the development of the business potential of numerous companies through technical interactions and management counseling. His publication record spans over 100 articles, numerous invited/keynote presentations and fourteen patents issued/pending.
Contributor Information
Waseem Khan Raja, Tufts University Department of Biomedical Engineering 4 Colby Street Medford, Massachusetts 02155.
Michael R. Padgen, University at Albany College of Nanoscale Science and Engineering 257 Fuller Road Albany, New York 12203 MPadgen@albany.edu
James K. Williams, University at Albany College of Nanoscale Science and Engineering 257 Fuller Road Albany, New York 12203 MPadgen@albany.edu
Frank B. Gertler, Massachusetts Institute of Technology Koch Institute for Integrative Cancer Research 77 Massachusetts Ave Building E18-215 Cambridge, Massachusetts 02139-4307
Jeffrey B. Wyckoff, Yeshiva University Albert Einstein College of Medicine Gruss Lipper Biophotonics Center 1300 Morris Park Ave Bronx, New York 10461
John S. Condeelis, Yeshiva University Albert Einstein College of Medicine Gruss Lipper Biophotonics Center 1300 Morris Park Ave Bronx, New York 10461
James Castracane, University at Albany College of Nanoscale Science and Engineering 257 Fuller Road Albany, New York 12203.
References
- 1.Locascio A, Nieto MA. Cell movements during vertebrate development: integrated tissue behaviour versus individual cell migration. Curr. Opin. Genet. Dev. 2001;11(4):464–469. doi: 10.1016/s0959-437x(00)00218-5. [DOI] [PubMed] [Google Scholar]
- 2.Nick JA, et al. Recombinant human activated protein C reduces human endotoxin-induced pulmonary inflammation via inhibition of neutrophil chemotaxis. Blood. 2004;104(13):3878–3885. doi: 10.1182/blood-2004-06-2140. [DOI] [PubMed] [Google Scholar]
- 3.Schultz G, Rotatori DS, Clark W. EGF and TGF-alpha in wound healing and repair. J. Cell. Biochem. 1991;45(4):346–352. doi: 10.1002/jcb.240450407. [DOI] [PubMed] [Google Scholar]
- 4.Condeelis JS, et al. Lamellipodia in invasion. Semin. Cancer Biol. 2001;11(2):119–128. doi: 10.1006/scbi.2000.0363. [DOI] [PubMed] [Google Scholar]
- 5.Isenberg BC, et al. Vascular smooth muscle cell durotaxis depends on substrate stiffness gradient strength. Biophys. J. 2009;97(5):1313–1322. doi: 10.1016/j.bpj.2009.06.021. [DOI] [PMC free article] [PubMed] [Google Scholar]
- 6.Lamers E, et al. The influence of nanoscale topographical cues on initial osteoblast morphology and migration. Eur. Cell. Mater. 2010;20:329–343. doi: 10.22203/ecm.v020a27. [DOI] [PubMed] [Google Scholar]
- 7.Roussos ET, et al. Mena deficiency delays tumor progression and decreases metastasis in polyoma middle-T transgenic mouse mammary tumors. Breast Cancer Res. 2010;12(6):R101. doi: 10.1186/bcr2784. [DOI] [PMC free article] [PubMed] [Google Scholar]
- 8.Goswami S, et al. Breast cancer cells isolated by chemotaxis from primary tumors show increased survival and resistance to chemotherapy. Cancer Res. 2004;64(21):7664–7667. doi: 10.1158/0008-5472.CAN-04-2027. [DOI] [PubMed] [Google Scholar]
- 9.de Mejia EG, Dia VP. The role of nutraceutical proteins and peptides in apoptosis, angiogenesis, and metastasis of cancer cells. Cancer Metastasis Rev. 2010;29(3):511–528. doi: 10.1007/s10555-010-9241-4. [DOI] [PubMed] [Google Scholar]
- 10.Perentes JY, et al. In vivo imaging of extracellular matrix remodeling by tumor-associated fibroblasts. Nat. Methods. 2009;6(2):143–145. doi: 10.1038/nmeth.1295. [DOI] [PMC free article] [PubMed] [Google Scholar]
- 11.Sherman-Baust CA, et al. Remodeling of the extracellular matrix through overexpression of collagen VI contributes to cisplatin resistance in ovarian cancer cells. Cancer Cell. 2003;3(4):377–386. doi: 10.1016/s1535-6108(03)00058-8. [DOI] [PubMed] [Google Scholar]
- 12.Vaupel P, Mayer A. Hypoxia in cancer: significance and impact on clinical outcome. Cancer and Metastasis Rev. 2007;26(2):225–239. doi: 10.1007/s10555-007-9055-1. [DOI] [PubMed] [Google Scholar]
- 13.Finger EC, Giaccia AJ. Hypoxia, inflammation, and the tumor microenvironment in metastatic disease. Cancer Metastasis Rev. 2010;29(2):285–293. doi: 10.1007/s10555-010-9224-5. [DOI] [PMC free article] [PubMed] [Google Scholar]
- 14.Sullivan R, Graham CH. Hypoxia-driven selection of the meta-static phenotype. Cancer Metastasis Rev. 2007;26(2):319–331. doi: 10.1007/s10555-007-9062-2. [DOI] [PubMed] [Google Scholar]
- 15.Boyden S. The chemotactic effect of mixtures of antibody and antigen on polymorphonuclear leucocytes. J. Exp. Med. 1962;115:453–466. doi: 10.1084/jem.115.3.453. [DOI] [PMC free article] [PubMed] [Google Scholar]
- 16.Zicha D, Dunn GA, Brown AF. A new direct-viewing chemotaxis chamber. J. Cell. Sci. 1991;99(Pt 4):769–775. doi: 10.1242/jcs.99.4.769. [DOI] [PubMed] [Google Scholar]
- 17.Lin F, et al. Effective neutrophil chemotaxis is strongly influenced by mean IL-8 concentration. Biochem. Biophys. Res. Commun. 2004;319(2):576–581. doi: 10.1016/j.bbrc.2004.05.029. [DOI] [PubMed] [Google Scholar]
- 18.Ainla A, et al. A microfluidic pipette for single-cell pharmacology. Anal. Chem. 2010;82(11):4529–4536. doi: 10.1021/ac100480f. [DOI] [PubMed] [Google Scholar]
- 19.Cheng S-Y, et al. A hydrogel-based microfluidic device for the studies of directed cell migration. Lab Chip. 2007;7(6):763. doi: 10.1039/b618463d. [DOI] [PubMed] [Google Scholar]
- 20.Arnold M, et al. Induction of cell polarization and migration by a gradient of nanoscale variations in adhesive ligand spacing. Nano Lett. 2008;8(7):2063–2069. doi: 10.1021/nl801483w. [DOI] [PMC free article] [PubMed] [Google Scholar]
- 21.Abhyankar VV, et al. A platform for assessing chemotactic migration within a spatiotemporally defined 3D microenvironment. Lab Chip. 2008;8(9):1507–1515. doi: 10.1039/b803533d. [DOI] [PMC free article] [PubMed] [Google Scholar]
- 22.Goswami S, et al. Macrophages promote the invasion of breast carcinoma cells via a colony-stimulating factor-1/epidermal growth factor paracrine loop. Cancer Research. 2005;65(12):5278–5283. doi: 10.1158/0008-5472.CAN-04-1853. [DOI] [PubMed] [Google Scholar]
- 23.Mousseau Y, et al. Improved agarose gel assay for quantification of growth factor-induced cell motility. Biotechniques. 2007;43(4):509–516. doi: 10.2144/000112557. [DOI] [PubMed] [Google Scholar]
- 24.Wyckoff JB, Segall JE, Condeelis JS. The collection of the motile population of cells from a living tumor. Cancer Research. 2000;60(19):5401–5404. [PubMed] [Google Scholar]
- 25.Wang W, et al. Identification and testing of a gene expression signature of invasive carcinoma cells within primary mammary tumors. Cancer Research. 2004;64(23):8585–8594. doi: 10.1158/0008-5472.CAN-04-1136. [DOI] [PubMed] [Google Scholar]
- 26.Raja WK, et al. A new chemotaxis device for cell migration studies. Integr. Biol. 2010;2(11–12):696–706. doi: 10.1039/c0ib00044b. [DOI] [PMC free article] [PubMed] [Google Scholar]
- 27.Tan XL, et al. CoCl2-induced expression of p300 promotes neuronal-like PC12 cell damage. Neurosci. Lett. 2008;441(3):272–276. doi: 10.1016/j.neulet.2008.06.050. [DOI] [PubMed] [Google Scholar]
- 28.Vengellur A, LaPres JJ. The role of hypoxia inducible factor 1α in cobalt chloride induced cell death in mouse embryonic fibroblasts. Toxicol. Sci. 2004;82(2):638–646. doi: 10.1093/toxsci/kfh278. [DOI] [PubMed] [Google Scholar]
- 29.Guo M, et al. Monitoring of cell growth and assessment of cytotoxi-city using electrochemical impedance spectroscopy. Biochimica et Biophysica Acta (BBA)—General Subjects. 2006;1760(3):432–439. doi: 10.1016/j.bbagen.2005.11.011. [DOI] [PubMed] [Google Scholar]
- 30.Wiertz RWF, Rutten WLC, Marani E. Impedance sensing for monitoring neuronal coverage and comparison with microscopy. IEEE Trans. Biomed. Eng. 2010;57(10):2379–2385. doi: 10.1109/TBME.2010.2055052. [DOI] [PubMed] [Google Scholar]
- 31.Padgen MR, et al. Complementary approaches to investigating cancer cell dynamics in the tumor microenvironment. Proc. SPIE. 2011;7929:792905. [Google Scholar]
- 32.Brandl F, et al. Hydrogel-based drug delivery systems: comparison of drug diffusivity and release kinetics. J. Control. Release. 2010;142(2):221–228. doi: 10.1016/j.jconrel.2009.10.030. [DOI] [PubMed] [Google Scholar]
- 33.Semenza GL. HIF-1 and tumor progression: pathophysiology and therapeutics. Trends Mol. Med. 2002;8:S62–S67. doi: 10.1016/s1471-4914(02)02317-1. [DOI] [PubMed] [Google Scholar]
- 34.Cockman ME, et al. Hypoxia inducible factor-α binding and ubiquitylation by the von Hippel-Lindau Tumor suppressor protein. J. Biol. Chem. 2000;275(3):25733–25741. doi: 10.1074/jbc.M002740200. [DOI] [PubMed] [Google Scholar]
- 35.Yuan Y, et al. Cobalt inhibits the interaction between hypoxiainducible factor-α and von Hippel-Lindau protein by direct binding to hypoxia-inducible factor-α. J. Biol. Chem. 2003;278(18):15911–15916. doi: 10.1074/jbc.M300463200. [DOI] [PubMed] [Google Scholar]


