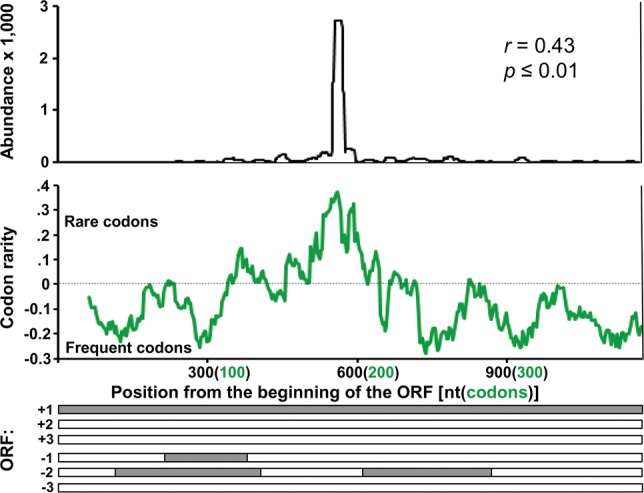
FIGURE 5.

Distribution of sRNA associated with S-PTGS in petunia. Abundance of sRNAs mapped to the petunia CHS-A sequence (De Paoli et al. 2009) (top panel) and the frequency of rare codons in the sequence (middle panel) showing that the peak of sRNA production is correlated with a high abundance of rare codons and is independent of predicted ORFs (bottom panel). (r) correlation coefficient.
