Abstract
Background and purpose: It is crucial to accurately differentiate high-grade gliomas (HGGs) from low-grade gliomas (LGGs) preoperatively, as treatment strategies vary. So we performed a meta-analysis to assess the sensitivity and specificity of fractional anisotropy (FA) value derived from diffusion tensor imaging (DTI) in differentiating HGGs from LGGs. Materials and methods: Between January 2005 and June 2014, relevant articles were searched from the Embase and Medline databases for analysis. Statistical analyses were performed using Meta-Disc 1.4. Results: A total of 221 patients included in the FA analysis: 127 with HGGs and 94 LGGs. The pooled sensitivity, specificity and diagnostic odds ratio (DOR) for differentiating HGGs from LGGs were 93% (95% CI 0.87-0.97), 85% (95% CI 0.76-0.92), and 55.41 (95% CI 16.77-183.07), respectively. And computation of heterogeneity metrics revealed an acceptable level of the between-study heterogeneity of DOR (I2=30.9%). Conclusions: The results of our meta-analysis present that the FA derived from DTI act as a useful diagnostic marker could be used in distinguishing the HGGs from LGGs in the preoperative and the clinical application values are to be confirmed by further larger case-control studies.
Keywords: Diffusion tensor imaging, fractional anisotropy, high grade gliomas, low grade gliomas
Introduction
Gliomas are the most frequent brain neoplasms of the central nervous system (CNS). The prognosis for patients with gliomas relies on the histopathologic grading, whereas the prognosis for those with high-grade gliomas (HGGs) remains very poor compares to the low-grade gliomas (LGGs) [1]. In patients with HGGs, surgical resection followed by adjuvant chemo-radiotherapy represents the standard of care [2]. As for those with LGGs, the optimal therapeutic measure likely includes offering extensive resection of the tumor, if possible, and postoperative delaying adjuvant radiotherapy until the time of glioma progression [3]. So, it is crucial to accurately differentiate HGGs from LGGs preoperatively. As an advanced magnetic resonance images (MRI) technique, diffusion tensor imaging (DTI) provides visibility into the motion of water molecules. Fractional anisotropy (FA) is the commonly used key metric of DTI, which represents a metric of the directionality of molecular movement [4]. Some studies have tried to distinguish HGGs from LGGs by analyzing the characteristics of FA, but with mixed results [5-12]. So, the purpose of this study was to assess the sensitivity and specificity of FA in discriminating HGGs from LGGs.
Materials and methods
We searched the Embase and Medline databases from January 2005 to June 2014, using the following strategy: (diffusion tensor imaging or fractional anisotropy or DTI or FA) and (brain tumor or glioma). Language restriction to English was performed.
And the relevant articles from the reference lists of all identified studies were searched.
Two independent observers (R.F.L. and X.W.) performed the literature search, evaluated all eligible studies, and did not include clearly irrelevant publications by reading the titles, abstracts, and keywords of them. Then, three independent observers (R.F.L., X.W. and M. L.) included those articles that satisfied the inclusion criteria of this study by evaluating the full text of the rest studies.
The inclusion criteria were: (1) before treatment with surgery or biopsy all patients underwent DTI; (2) the gliomas cases were confirmed by pathological examination.
The exclusion criteria were: (1) the studies could not provide enough data for sensitivity and specificity; (2) the patients were included in other studies; (3) the article type was a case report, letter, editorial or review. We resolved disagreements by consensus.
Two independent observers (R.F.L. and X.W.) evaluated the quality of each included study according to the QUADAS criteria [13], and disagreements were also resolved by discussion and consensus if any. The QUADAS tool, which contains 14 items and each item could be answered as “unclear”, “yes”, or “no”. We defined that all items were equal-weighted and scored 0.5 for “unclear”, 1 for “yes”, and 0 for “no”.
The same independent observers (R.F.L. and X.W.) extracted data from each included study and solved disagreement by consensus. Information extracted included the authors, patients, the nation of origin, the year of publication, study design, b values, MRI field strength, QUADAS score, and the numbers of true negative (TN), false negative (FN), true positive (TP), false positive (FP).
Statistical analysis
We calculated the sensitivity, specificity, positive likelihood ratio (PLR), negative likelihood ratio (NLR) of each included study, and their (DOR) were also counted. Heterogeneity was tested by using the I2, Cochran-Q tests and Chi-square tests. An I2 value ranges from 0% to 40% is considered as “heterogeneity might not be important”, value ranges from 30% to 60% is considered as “moderate heterogeneity”, value ranges from 50% to 90% is considered as “substantial heterogeneity”, [14] and value ranges from 75% to 100% is considered as “considerable heterogeneity”. We pooled sensitivities, specificities and DOR by the fix-effect model when the heterogeneity was not statistically significant. In addition, the random-effect model was performed if the heterogeneity was statistically significant. All of the above-mentioned statistical analyses were performed using Meta-Disc 1.4 [15].
Results
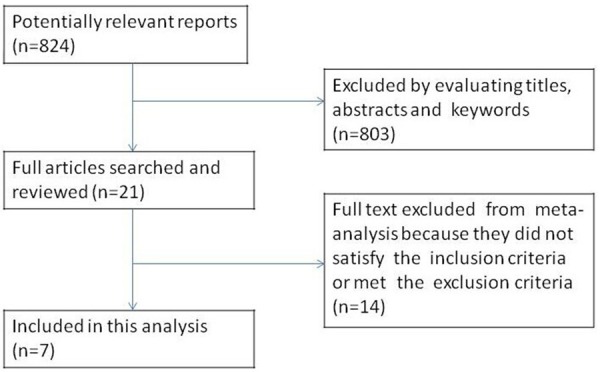
A total of 824 articles, [5-12,16-28] 21 full texts were assessed and reference lists were searched for additional includable papers. Finally, 7 studies [6-12] were included the analysis. The study selection flow diagram was listed in Figure 1. The key information of the studies included in this meta-analysis was listed in Tables 1 and 2.
Figure 1.

The selection process of eligible studies.
Table 1.
Characteristics of studies included in this meta-analysis
| Study | Year | Nation | No. of patients (n) | Study design | Field strength (T) | B value (s/mm2) | QUADAS-score |
|---|---|---|---|---|---|---|---|
| Inoue [6] | 2005 | Japan | 41 | C | 3.0 | 800 | 12 |
| Ferda [7] | 2010 | Czech | 24 | R | 1.5 | 700 | 12 |
| Jolapara [8] | 2011 | India | 38 | R | 1.5 | 1000 | 11.5 |
| Liu [9] | 2011 | USA | 28 | R | 1.5 or 3.0 | 1000 | 13 |
| White [10] | 2011 | USA | 34 | R | 3.0 | 1000 | 13 |
| Ma [11] | 2013 | China | 25 | R | 1.5 | 1000 | 11 |
| Roy [12] | 2013 | India | 56 | NR | 3.0 | 1000 | 11.5 |
P=Prospective; R=Retrospective; C=Consecutive; NR=Not report; QUADAS score= Quality assessment of diagnostic accuracy studies score.
Table 2.
The key data of the studies included in this meta-analysis
| Study | TP | FP | FN | TN | PLR | NLR | SEN% | SPE% | DOR |
|---|---|---|---|---|---|---|---|---|---|
| Inoue [6] | 24 | 0 | 0 | 17 | 35.28 | 0.02 | 1.00 | 1.00 | 1715.00 |
| Ferda [7] | 13 | 1 | 3 | 7 | 6.50 | 0.21 | 0.81 | 0.88 | 30.33 |
| Jolapara [8] | 15 | 0 | 0 | 23 | 46.50 | 0.03 | 1.00 | 1.00 | 1457.00 |
| Liu [9] | 14 | 4 | 1 | 9 | 3.03 | 0.10 | 0.93 | 0.69 | 31.50 |
| White [10] | 23 | 2 | 2 | 7 | 4.14 | 0.10 | 0.92 | 0.78 | 40.25 |
| Ma [11] | 6 | 2 | 9 | 8 | 2.00 | 0.75 | 0.40 | 0.80 | 2.67 |
| Roy [12] | 29 | 7 | 3 | 17 | 3.11 | 0.13 | 0.91 | 0.71 | 23.48 |
PLR=Positive likelihood ratio; NLR=Negative likelihood ratio; TP=True positive; FP=False positive; FN=False negative; TN=True negative, SEN=Sensitivity; SPE=Specificity; DOR=Diagnostic odds ratio.
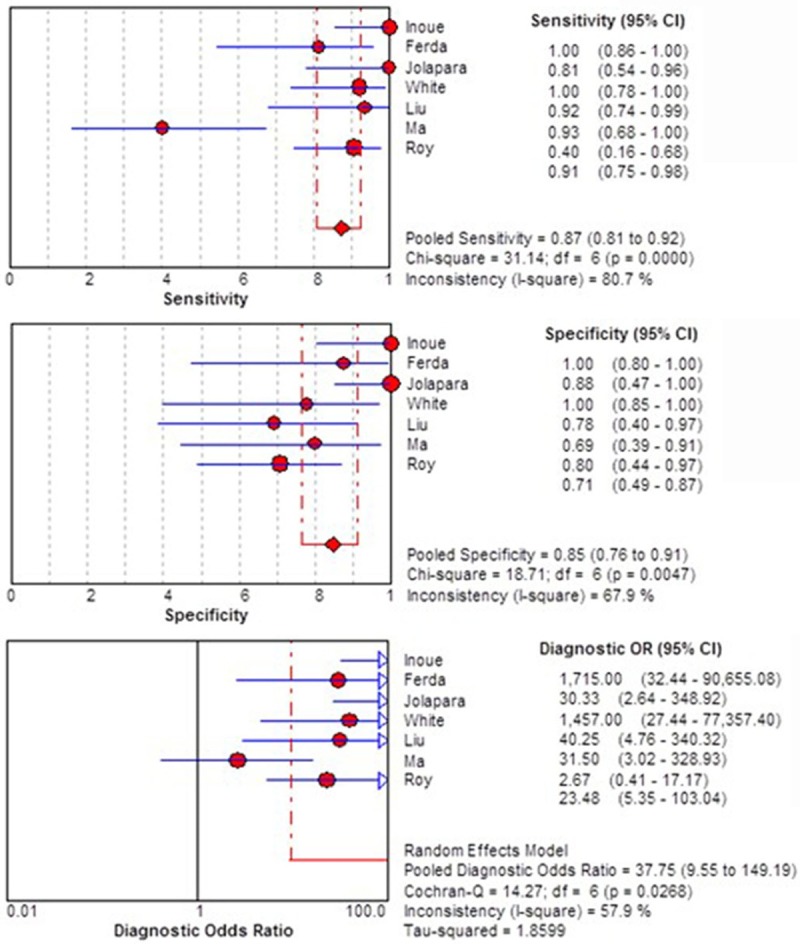
The initial meta-analysis included FA measure in a population of 246 subjects (n=142 HGGs, n=104 LGGs). We found that the FA value owned a high differential diagnostic value for differentiation HGGs from LGGs. The pooled sensitivity, specificity and DOR for differentiating HGGs from LGGs were 87% (95% CI 0.81-0.92), 85% (95% CI 0.76-0.91), and 37.75 (95% CI 9.55-149.19), respectively (Figure 2). However, we found a moderate level of the between-study heterogeneity of DOR (I2=57.9%).
Figure 2.

Forest plot of the sensitivity, specificity, and DOR of FA for discriminating HGGs from LGGs of initial meta-analysis.
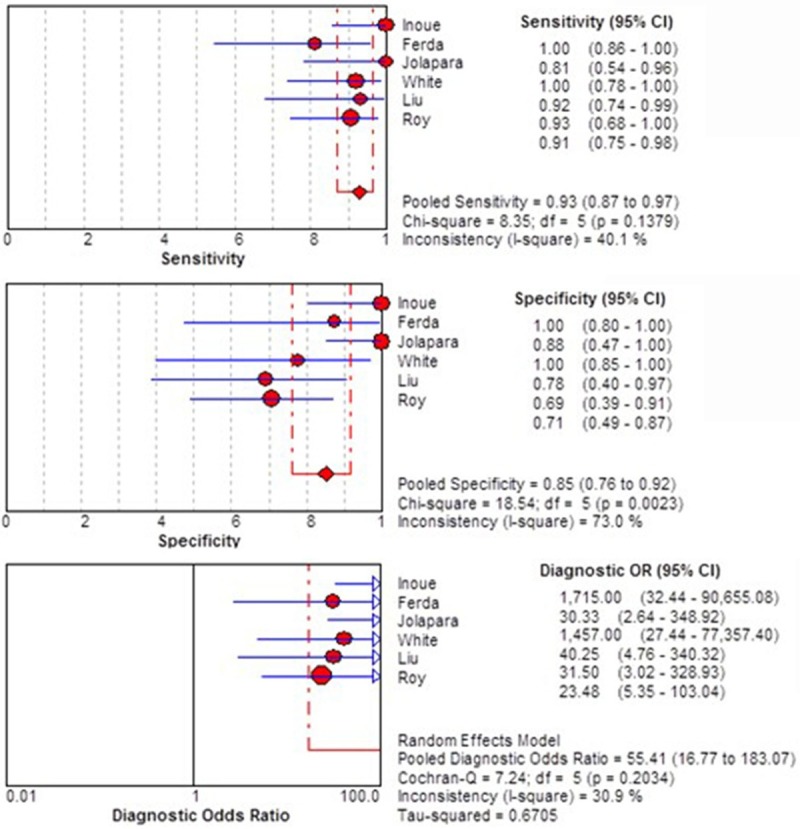
To assess for potential reasons of the observed moderate variability of study results, we repeated the analysis after exclusion of the study [11] that had the lowest QUADAS score among included studies. This reduced the between-study heterogeneity of DOR to an acceptable level (I2=30.9%) for the 6 finally included studies with 221 subjects (n=127 HGGs, n=94 LGGs). And the pooled sensitivity, specificity and DOR for differentiating HGGs from LGGs were 93% (95% CI 0.87-0.97), 85% (95% CI 0.76-0.92), and 55.41 (95% CI 16.77-183.07), respectively (Figure 3).
Figure 3.

Forest plot of the sensitivity, specificity, and DOR of FA for discriminating HGGs from LGGs of further meta-analysis.
Discussion
HGGs present heterogeneous contrast enhancement patterns, haemorrhage, cystic or ne-crotic areas, and infiltrative edema. However, the imaging feature of the two main glioma categories is not always grade specific, as in some cases HGGs may show similar morphological characteristics to LGGs and the latter may present relatively malignant imaging features [9]. Therefore, these imaging similarities may potentially result in inaccurate glioma staging merely based on conventional MRI [29].
Hence these lesions may be indistinguishable. Since the advent of DTI, the ability to distinguish HGGs from LGGs has been a source of interest. Studies of the relationship between DTI metrics and pathological grading of gliomas showed that FA values can differentiate HGGs from LGGs [6-12], thus be useful for deciding on the surgery tactics or the selected biopsy site of stereotactic biopsy [6].
In this meta-analysis, the FA derived from DTI, which had 93% (87-97%) sensitivity, 85% (76-92%) specificity and 55.41 (16.77-183.07) DOR, is confirmed to own a high diagnostic value for the grading of gliomas in the preoperative. It means that a significantly increased FA in the HGGs group when compared with the metric in the LGGs group [9].
The potential limitations in our meta-analysis should be acknowledged. Firstly, we solely focused on published articles which tend to present significant and/or positive findings; whereas, some journals are much more prone to rejecting those studies with insignificant and/or negative consequences. Therefore, the diagnostic accuracy and value of FA value may be overestimated and less applicable to current clinical practice. Secondly, this study was restricted to articles published in English that may have introduced bias into this meta-analysis. Thirdly, although the tumor cases were confirmed by pathological examination in included studies, the results may be variable, on some level, due to the different reference standard of hisopathologic diagnosis in various institutions. And this also may have introduced bias into this study. Fourthly, some included studies provided multiple different sensitivity and specificity based on different criteria, such as the classification of the region of interest, the threshold value and the index used to describe the FA (minimum, maximum, range or mean). We only extracted the relatively lower values and did not perform subgroup analyses, because of the limited number of studies, so the diagnostic value of FA value may be underestimated. Furthermore, due to the limited number of studies in this study, the publication bias was not evaluated, and the summary receiver operating characteristic (SROC) curve and the funnel plots was not draw.
Conclusion
In conclusion, the results of our meta-analysis present that the FA derived from DTI act as a useful diagnostic marker could be used in distinguishing the HGGs from LGGs in the preoperative and the clinical application values are to be confirmed by further larger case-control studies.
Disclosure of conflict of interest
None.
References
- 1.Hadziahmetovic M, Shirai K, Chakravarti A. Recent advancements in multimodality treatment of gliomas. Future Oncol. 2011;7:1169–1183. doi: 10.2217/fon.11.102. [DOI] [PMC free article] [PubMed] [Google Scholar]
- 2.Stupp R, Tonn JC, Brada M, Pentheroudakis G. High-grade malignant glioma: ESMO Clinical Practice Guidelines for diagnosis, treatment and follow-up. Ann Oncol. 2010;21:v190–193. doi: 10.1093/annonc/mdq187. [DOI] [PubMed] [Google Scholar]
- 3.Pouratian N, Schiff D. Management of low-grade glioma. Curr Neurol Neurosci Rep. 2010;10:224–231. doi: 10.1007/s11910-010-0105-7. [DOI] [PMC free article] [PubMed] [Google Scholar]
- 4.Lee EJ, Ahn KJ, Lee EK, Lee YS, Kim DB. Potential role of advanced MRI techniques for the peritumoural region in differentiating glioblastoma multiforme and solitary metastatic lesions. Clin Radiol. 2013;68:e689–697. doi: 10.1016/j.crad.2013.06.021. [DOI] [PubMed] [Google Scholar]
- 5.Server A, Graff BA, Josefsen R, Orheim TE, Schellhorn T, Nordhøy W, Nakstad PH. Analysis of diffusion tensor imaging metrics for gliomas grading at 3T. Eur J Radiol. 2014;83:e156–165. doi: 10.1016/j.ejrad.2013.12.023. [DOI] [PubMed] [Google Scholar]
- 6.Inoue T, Ogasawara K, Beppu T, Kabasawa H. Diffusion tensor imaging for preoperative evaluation of tumor grade in gliomas. Clin Neurol Neurosurg. 2005;107:174–180. doi: 10.1016/j.clineuro.2004.06.011. [DOI] [PubMed] [Google Scholar]
- 7.Ferda J, Kastner J, Mukenšnabl P, Choc M, Horemužová J, Ferdová E, Kreuzberg B. Diffusion tensor magnetic resonance imaging of glial brain tumors. Eur J Radiol. 2010;74:428–436. doi: 10.1016/j.ejrad.2009.03.030. [DOI] [PubMed] [Google Scholar]
- 8.Jolapara M, Patro SN, Kesavadas C, Saini J, Thomas B, Gupta AK, Bodhey N, Radhakrishnan VV. Can diffusion tensor metrics help in preoperative grading of diffusely infiltrating astrocytomas? A retrospective study of 36 cases. Neuroradiology. 2011;53:63–68. doi: 10.1007/s00234-010-0761-y. [DOI] [PubMed] [Google Scholar]
- 9.Liu X, Tian W, Kolar B, Yeaney GA, Qiu X, Johnson MD, Ekholm S. MR diffusion tensor and perfusion-weighted imaging in preoperative grading of supratentorial nonenhancing gliomas. Neuro Oncol. 2011;13:447–455. doi: 10.1093/neuonc/noq197. [DOI] [PMC free article] [PubMed] [Google Scholar]
- 10.White ML, Zhang Y, Yu F, Kazmi SJ. Diffusion tensor MR imaging of cerebral gliomas: evaluating fractional anisotropy characteristics. AJNR Am J Neuroradiol. 2011;32:374–381. doi: 10.3174/ajnr.A2267. [DOI] [PMC free article] [PubMed] [Google Scholar]
- 11.Ma L, Song ZJ. Differentiation between low-grade and high-grade glioma using combined diffusion tensor imaging metrics. Clin Neurol Neurosurg. 2013;115:2489–2495. doi: 10.1016/j.clineuro.2013.10.003. [DOI] [PubMed] [Google Scholar]
- 12.Roy B, Gupta RK, Maudsley AA, Awasthi R, Sheriff S, Gu M, Husain N, Mohakud S, Behari S, Pandey CM, Rathore RK, Spielman DM, Alger JR. Utility of multiparametric 3-T MRI for glioma characterization. Neuroradiology. 2013;55:603–613. doi: 10.1007/s00234-013-1145-x. [DOI] [PMC free article] [PubMed] [Google Scholar]
- 13.Whiting P, Rutjes AW, Reitsma JB, Bossuyt PM, Kleijnen J. The development of QUADAS: a tool for the quality assessment of studies of diagnostic accuracy included in systematic reviews. BMC Med Res Methodol. 2003;3:25. doi: 10.1186/1471-2288-3-25. [DOI] [PMC free article] [PubMed] [Google Scholar]
- 14.Higgins JP, Green S, editors. Cochrane Handbook for Systematic Reviews of Interventions Version 5.1.0. Available from: www.cochrane-handbook.org. [Google Scholar]
- 15.Zamora J, Abraira V, Muriel A, Khan K, Coomarasamy A. Meta-DiSc: a software for meta-analysis of test accuracy data. BMC Med Res Methodol. 2006;6:31. doi: 10.1186/1471-2288-6-31. [DOI] [PMC free article] [PubMed] [Google Scholar]
- 16.Winfeld M, Jensen J, Adisetiyo V, Fieremans E, Helpern J, Karajannis M, Allen J, Gardner S, Milla S. Differentiating high and low grade pediatric brain tumors using diffusional kurtosis imaging. J Pediatr Neuroradiol. 2013;2:301–305. [Google Scholar]
- 17.Chawalparit O, Sangruchi T, Witthiwej T, Sathornsumetee S, Tritrakarn S, Piyapittayanan S, Chaicharoen P, Direksunthorn T, Charnchaowanish P. Diagnostic performance of advanced MRI in differentiating high-grade from low-grade gliomas in a setting of routine service. J Med Assoc Thai. 2013;96:1365–1373. [PubMed] [Google Scholar]
- 18.Piyapittayanan S, Chawalparit O, Tritakarn SO, Witthiwej T, Sangruchi T, Nunta-Aree S, Sathornsumetee S, Itthimethin P, Komoltri C. Value of diffusion tensor imaging in differentiating high-grade from low-grade gliomas. J Med Assoc Thai. 2013;96:716–21. [PubMed] [Google Scholar]
- 19.Smitha KA, Gupta AK, Jayasree RS. Total magnitude of diffusion tensor imaging as an effective tool for the differentiation of glioma. Eur J Radiol. 2013;82:857–861. doi: 10.1016/j.ejrad.2012.12.027. [DOI] [PubMed] [Google Scholar]
- 20.Zou QG, Xu HB, Liu F, Guo W, Kong XC, Wu Y. In the assessment of supratentorial glioma grade: the combined role of multivoxel proton MR spectroscopy and diffusion tensor imaging. Clin Radiol. 2011;66:953–960. doi: 10.1016/j.crad.2011.05.001. [DOI] [PubMed] [Google Scholar]
- 21.Jakab A, Molnár P, Emri M, Berényi E. Glioma grade assessment by using histogram analysis of diffusion tensor imaging-derived maps. Neuroradiology. 2011;53:483–491. doi: 10.1007/s00234-010-0769-3. [DOI] [PubMed] [Google Scholar]
- 22.Chen Y, Shi Y, Song Z. Differences in the architecture of low-grade and high-grade gliomas evaluated using fiber density index and fractional anisotropy. J Clin Neurosci. 2010;17:824–829. doi: 10.1016/j.jocn.2009.11.022. [DOI] [PubMed] [Google Scholar]
- 23.Lee HY, Na DG, Song IC, Lee DH, Seo HS, Kim JH, Chang KH. Diffusion-tensor imaging for glioma grading at 3-T magnetic resonance imaging: analysis of fractional anisotropy and mean diffusivity. J Comput Assist Tomogr. 2008;32:298–303. doi: 10.1097/RCT.0b013e318076b44d. [DOI] [PubMed] [Google Scholar]
- 24.van Westen D, Lätt J, Englund E, Brockstedt S, Larsson EM. Tumor extension in high-grade gliomas assessed with diffusion magnetic resonance imaging: values and lesion-to-brain ratios of apparent diffusion coefficient and fractional anisotropy. Acta Radiol. 2006;47:311–319. doi: 10.1080/02841850500539058. [DOI] [PubMed] [Google Scholar]
- 25.Stadlbauer A, Ganslandt O, Buslei R, Hammen T, Gruber S, Moser E, Buchfelder M, Salomonowitz E, Nimsky C. Gliomas: histopathologic evaluation of changes in directionality and magnitude of water diffusion at diffusion-tensor MR imaging. Radiology. 2006;240:803–810. doi: 10.1148/radiol.2403050937. [DOI] [PubMed] [Google Scholar]
- 26.Svolos P, Tsolaki E, Kapsalaki E, Theodorou K, Fountas K, Fezoulidis I, Tsougos I. Investigating brain tumor differentiation with diffusion and perfusion metrics at 3T MRI using pattern recognition techniques. Magn Reson Imaging. 2013;31:1567–1577. doi: 10.1016/j.mri.2013.06.010. [DOI] [PubMed] [Google Scholar]
- 27.Cortez-Conradis D, Favila R, Isaac-Olive K, Martinez-Lopez M, Rios C, Roldan-Valadez E. Diagnostic performance of regional DTI-derived tensor metrics in glioblastoma multiforme: simultaneous evaluation of p, q, L, Cl, Cp, Cs, RA, RD, AD, mean diffusivity and fractional anisotropy. Eur Radiol. 2013;23:1112–1121. doi: 10.1007/s00330-012-2688-7. [DOI] [PubMed] [Google Scholar]
- 28.Van Cauter S, Veraart J, Sijbers J, Peeters RR, Himmelreich U, De Keyzer F, Van Gool SW, Van Calenbergh F, De Vleeschouwer S, Van Hecke W, Sunaert S. Gliomas: diffusion kurtosis MR imaging in grading. Radiology. 2012;263:492–501. doi: 10.1148/radiol.12110927. [DOI] [PubMed] [Google Scholar]
- 29.Svolos P, Kousi E, Kapsalaki E, Theodorou K, Fezoulidis I, Kappas C, Tsougos I. The role of diffusion and perfusion weighted imaging in the differential diagnosis of cerebral tumors: a review and future perspectives. Cancer Imaging. 2014;14:20. doi: 10.1186/1470-7330-14-20. [DOI] [PMC free article] [PubMed] [Google Scholar]


