

Abstract
Objective: The purpose of this study was to evaluate the relationship between body mass index (BMI) and a physical fitness index (PFI) in Chinese college freshmen based on 50-meter run. Design and methods: Cross-sectional survey from 2007 to 2009. The records of 3825 men (age 18-31) and 4062 women (age 18-30) studying in Anhui medical university were examined. Height and weight were measured by trained teachers, and 50-meter run test was performed as PFI. Result: More men than women were overweight or obese (5.8% vs 2.1%), but more women than men were underweight (21.1% vs 16.9%). In all five BMI groups, men performed significantly better than women (p < 0.05). In both genders, decreasing performance was observed from normal weight or underweight to overweight and thinness (p for trend < 0.05). The relationship between BMI and PFI of men is nonlinear and varies with age, and the curvature of this parabola increases continuously. The relationship between BMI and PFI of women is not clear. Conclusion: The relationship between PFI and BMI of adult men conforms to the quadratic model, and the influence of PFI by BMI is more serious in middle-age male than youth male.
Keywords: BMI, physical fitness, adult
Introduction
The public health is more and more important social hot issue all over the world [1,2], especially, the health condition of college students is the most important of all. Previous studies had found that obesity is increasing quickly in both the developed and the developing countries [3,4], and other studies reported that overweight and obesity decreased the physical exercise capability and then reduced health-related physical fitness, such as cardiorespiratory fitness and speed of movement [5,6]. Nevertheless, the relationship between physical fitness test and BMI in adolescence is confused [7]. So, investigation in the full-grown adult has the advantage that the result will emerge more stabilized.
50-meter run test is the normal way to test the speed and explosive of students as one of the physical fitness test items, and most studies had used it as a formal test [8]. In this study, in order to reduce the interference factors, we supposed the result of 50-meter test as the physical test result, and aims to examine the relations of health-related physical fitness with BMI and weight status (thinness, underweight, normal weight, overweight/obese) among Chinese adult students.
Material and methods
Sample, protocol and ethical approval
A cross-section study was conducted in Anhui medical university freshmen from the year during 2007 to 2009 in Anhui province, China. The university is divided into 18 academies, which in total have more than 18000 students mostly come from Anhui province. In this study, after excluding the students younger than 18, we finally obtained three thousand eight hundred and twenty-five men (age 18-31) and four thousand and sixty-two women (age 18-30) from the department of physical education. Written consent was obtained from these students. Anthropometric parameters and 50-meter run test were assessed in these students. For this is a final test and the result will be the score of physical education at the end of the semester, none of the students missed this test. Besides, for all the students participating in this study were freshmen, the age distribution is concentrated. So, in order to make the sample distribution more homogeneous, we put the students divided into several groups as follow: 18, 19, 20, 21-22, 23-24, ≥ 25.
This study was conducted according to the guidelines laid down in the Declaration of Helsinki and all procedures were approved by the Institutional Ethical Committee of Anhui medical university.
Measurements
Heights of students were measured barefoot, and weights were measured in light clothing, which was following the National Health and Nutrition Examination Survey protocol. The equipment used for measure height is a calibrated Seca stadiometer (Model 844), and the equipment of measure weight is Seca electronic scale (Model 214). Each of these measurements was carried out by at least two trained teachers: one took the measurements, while a second recorded the readings. Body mass index (BMI) was computed [weight (kg)/height squared (m2)] to classify students into five categories based on the criteria of WHO (World Health Organization): thinness, BMI < 17 kg·m-2; underweight, BMI ≥ 17 but < 18.5 kg·m-2; normal, BMI ≥ 18.5 but < 25 kg·m-2; overweight, BMI ≥ 25 but < 30 kg·m-2; and obesity, BMI ≥ 30 kg·m-2.
50-meter run was carried out during physical education lessons at the end of the semester. Z-scores were calculated using sex- and age-specific means and standard deviations for five categories, and the z-score for the fitness test of 50-meter sprint was used as a PFI. Differences in PFI between BMI categories within each sex-specific age group were compared with ANOVA with Bonferroni adjustments. Sex-specific regressions of PFI on BMI, using a curve estimation model, were done in six broader age groups.
Data analysis
All statistical analyses were performed using SPSS 20.0 (SPSS Inc.). Statistical significance was set at P < 0.05. Differences in PFI between BMI categories within each sex-specific age group were compared with ANOVA with Bonferroni adjustments for subsequent pairwise comparisons. Scatter diagrams were fabrication to show the trends in means for men and women in different age groups. Sex-specific regressions of PFI on BMI were done in the six broader age groups. On the basis of an examination of the plots of PFI by BMI category within age groups, a nonlinear quadratic model was used. PFI was the dependent variable, and BMI category and BMI category squared were the independent variables. Thus, PFI = a (BMI category)2 + b (BMI category) + c, where a, b, and c are constants.
Results
Final sample consists of 3825 men aged 18-31 years and 4062 women aged 18-30 (amounting to 91.7% of those participating), with similar age distribution. Table 1 shows that men had higher mean height, weight and BMI than women. Men were more likely to be overweight/obese than women (5.8% vs 2.1%), while women were more likely to be underweight than men (21% vs 16.9%). 77.3% of the men were normal weight according to the World Health Organization, while 76.8% of the women were normal weight according to the definition. The Z-score and standard deviations of the men with normal weight is -0.052 (0.968) and the women is 0.022 (0.985). Besides, in all the six age groups, men performed significantly (p < 0.05) better in 50m test than women just as common sense.
Table 1.
Age distribution, weight status and healthrelated physical fitness by sex
| Men (N = 3825) | Women (N = 4062) | P* | |
|---|---|---|---|
| Physical test (mean and SD) | |||
| Height | 173.21 (5.7) | 161.08 (5.15) | |
| Weight | 62.14 (8.68) | 52.07 (5.89) | |
| BMI | 20.69 (2.53) | 20.06 (1.98) | |
| Age (n and %) | |||
| 18 | 877 (22.9) | 1061 (26.2) | |
| 19 | 1305 (34.1) | 1298 (32.1) | |
| 20 | 482 (12.6) | 442 (10.9) | |
| 21-22 | 510 (13.3) | 524 (12.9) | |
| 23-24 | 381 (10) | 402 (9.9) | |
| 25 or above | 270 (7.1) | 325 (8) | |
| Total | 3825 | 4062 | |
| Weight status (n and %) | |||
| Thinness | 92 (2.4) | 119 (2.9) | |
| Underweight | 554 (14.5) | 738 (18.1) | |
| Normal weight | 2966 (77.3) | 3120 (76.8) | |
| Overweight | 201 (5.2) | 81 (2) | |
| Obese | 22 (0.6) | 4 (0.1) | |
| Physical fitness tests (mean and SD) | |||
| Thinness | -0.782 (0.404) | 0.755 (0.503) | 7.96E-62 |
| Underweight | -0.912 (0.367) | 0.812 (0.544) | 0 |
| Normal | -0.932 (0.393) | 0.869 (0.51) | 0 |
| Overweight | -0.715 (0.413) | 0.974 (0.549) | 5.18E-49 |
| Obese | -0.364 (1.27) | 1.283 (0.439) | 0.018 |
Means and standard deviations for PFI by BMI category for each age group are summarized in Tables 2 and 3 for men and women, respectively. Differences in the index are statistically significant between men and women by the same age and BMI group (not shown); only significant pairwise comparisons by age group are shown in the tables. Persons with high BMI have, on average, the poorest PFI values in almost all age groups in both sexes, though the significance of difference varies. For the sample size of person with obese or thinness BMI usually is small, we couldn’t detect the difference of this categories in some age groups with others. In addition, we found some underweight categories performed the 50-meter test is even better than the normal categories in both sexes.
Table 2.
Descriptive statistics for the physical fitness index (sum of Z-scores) by BMI category and age group in men, and results of Bonferroni-adjusted pairwise comparisons
| Age (yr) | Thinness | Underweight | Normal | Overweight | Obese | Significant post hoc Pairwise Comparisons | |||||
|---|---|---|---|---|---|---|---|---|---|---|---|
|
| |||||||||||
| N | Mean (SD) | N | Mean (SD) | N | Mean (SD) | N | Mean (SD) | N | Mean (SD) | P < 0.05 | |
| 18 | 27 | -0.928 (0.29) | 156 | -0.968 (0.32) | 643 | -0.939 (0.36) | 45 | -0.8368 (0.28) | 6 | 0.348 (2.32) | 2 vs 4 |
| 19 | 27 | -0.834 (0.42) | 174 | -0.9221 (0.38) | 1021 | -0.938 (0.41) | 78 | -0.692 (0.46) | 5 | -0.592 (0.19) | 2 vs 4, 3 vs 4 |
| 20 | 16 | -0.703 (0.39) | 62 | -0.914 (0.36) | 380 | -0.927 (0.39) | 23 | -0.6029 (0.4) | 1 | -0.677 (0) | 1 vs 2, 1 vs 3, 2 vs 4, 3 vs 4 |
| 21-22 | 13 | -0.669 (0.49) | 59 | -0.797 (0.41) | 408 | -0.936 (0.44) | 24 | -0.822 (0.37) | 6 | -0.553 (0.65) | 2 vs 3, 3 vs 5 |
| 23-24 | 6 | -0.641 (0.4) | 54 | -0.84 (0.39) | 304 | -0.925 (0.38) | 15 | -0.783 (0.26) | 2 | -1.048 (0.07) | -- |
| ≥ 25 | 3 | -0.182 (0.24) | 39 | -0.908 (0.39) | 210 | -0.898 (0.38) | 16 | -0.418 (0.54) | 2 | -0.518 (0.22) | 1 vs 2, 1 vs 3, 2 vs 4, 3 vs 4 |
BMI categories: (1) thinness, BMI < 17 kg·m-2; (2) underweight, BMI ≥ 17 but < 18.5 kg·m-2; (3) normal, BMI ≥ 18.5 but < 25 kg·m-2; (4) overweight, BMI ≥ 25 but < 30 kg·m-2; (5) obesity, BMI ≥ 30 kg·m-2.
Table 3.
Descriptive statistics for the physical fitness index (sum of Z-scores) by BMI category and age group in women, and results of Bonferroni-adjusted pairwise comparisons
| Age (yr) | Thinness | Underweight | Normal | Overweight | Obese | Significant post hoc Pairwise Comparisons | |||||
|---|---|---|---|---|---|---|---|---|---|---|---|
|
| |||||||||||
| N | Mean (SD) | N | Mean (SD) | N | Mean (SD) | N | Mean (SD) | N | Mean (SD) | P < 0.05 | |
| 18 | 32 | 0.569 (0.37) | 184 | 0.705 (0.45) | 816 | 0.838 (0.45) | 27 | 0.85 (0.38) | 2 | 0.913 (0) | 1 vs 3, 1 vs 4, 2 vs 3, |
| 19 | 32 | 0.615 (0.38) | 251 | 0.811 (0.48) | 992 | 0.862 (0.5) | 23 | 1.074 (0.71) | 0 | -- | 1 vs 2, 1 vs 3, 1 vs 4, 2 vs 4, 3 vs 4 |
| 20 | 16 | 0.9 (0.51) | 73 | 0.811 (0.85) | 345 | 0.862 (0.52) | 8 | 0.887 (0.37) | 0 | -- | -- |
| 21-22 | 17 | 0.926 (0.61) | 105 | 0.877 (0.56) | 400 | 0.807 (0.52) | 11 | 0.682 (0.39) | 1 | 1.761 (0) | -- |
| 23-24 | 10 | 0.924 (0.5) | 66 | 0.77 (0.41) | 319 | 0.955 (0.56) | 6 | 1.5 (0.51) | 1 | 1.55 (0) | 1 vs 4, 2 vs 3, 2 vs 4 |
| ≥ 25 | 12 | 1.046 (0.68) | 59 | 1.082 (0.6) | 248 | 0.998 (0.6) | 6 | 1.266 (0.57) | 0 | -- | -- |
BMI categories: (1) thinness, BMI < 17 kg·m-2; (2) underweight, BMI ≥ 17 but < 18.5 kg·m-2; (3) normal, BMI ≥ 18.5 but < 25 kg·m-2; (4) overweight, BMI ≥ 25 but < 30 kg·m-2; (5) obesity, BMI ≥ 30 kg·m-2.
Trends in PFI are generally similar among men 18-20 and 21-30 yr old (Figure 1A, 1B). Men with normal or low BMI have a significantly higher PFI than those high, very high or very low BMI. Especially, men with normal BMI have, on average, the best PFI values in 19-24 yr groups (exclude only two samples in the 23-24 yr group with very high BMI), and with low BMI have the best PFI in 18 and ≥ 25 yr groups. On the other hand, the relationship between BMI and PFI in women is chaos.
Figure 1.
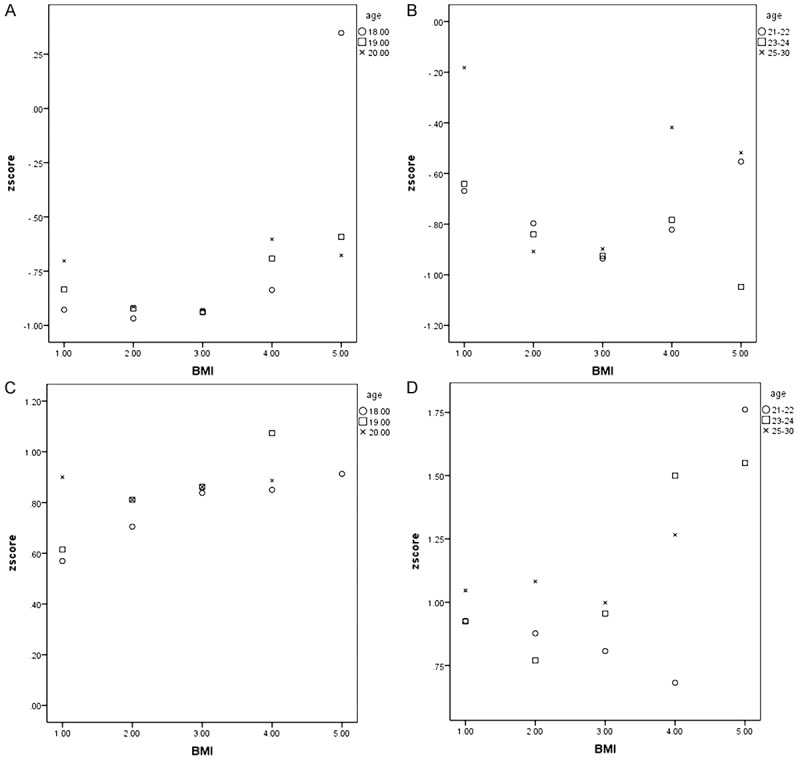
Mean PFI by BMI category in men and women by age groups. BMI categories: (1) thinness; (2) underweight; (3) normal; (4) overweight; (5) obese. A: 18-20 yr of men; B: 21-30 yr of men; C: 18-20 yr of women; D: 21-30 yr of women.
We excluded categories with lower than 10 samples in all age groups of men and women, and Figure 2 shows the relationship between PFI and BMI categories in men and women, the result of men (Figure 2A, 2B) is markedly parabolic. However, the relationship between PFI and BMI categories in women (Figure 2C, 2D) is confusion.
Figure 2.
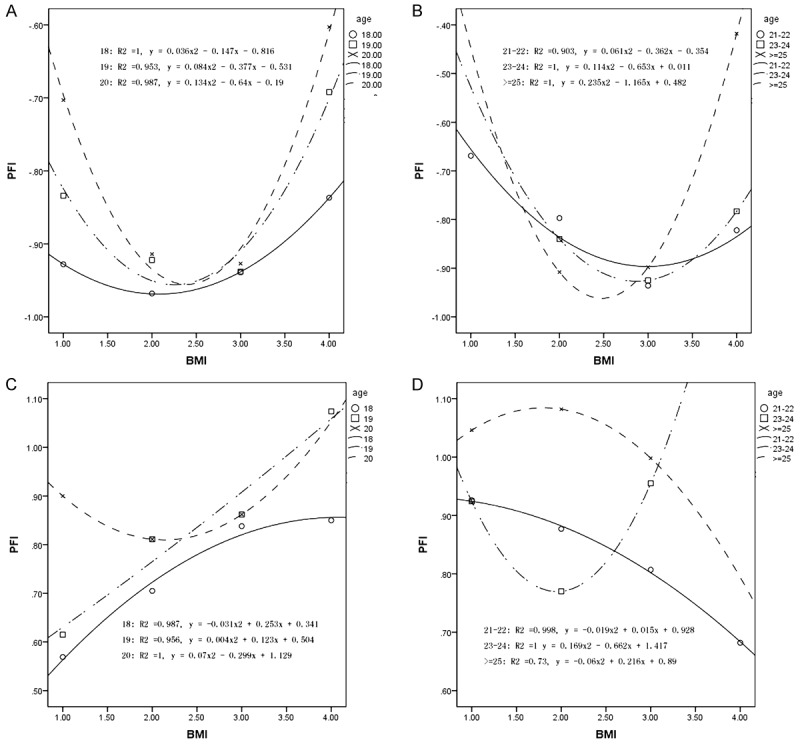
Relationship between PFI and BMI in six age groups of men and women. A: 18-20 yr of men; B: 21-30 yr of men; C: 18-20 yr of women; D: 21-30 yr of women.
Discussion
Our result revealed that the overweight, thinness and obese men performed worse in 50-meter test compared with the normal or underweight men. In age groups 18 and ≥ 25, the underweight categories performed better than the other BMI categories, and in age group 19, 20, 21-22 and 23-24, the normal categories is better. It seems that the best BMI men should have to accomplished 50-meter test is changed from low to normal and low again between age 18 to middle-age which no previous studies have been reported before. In addition, we found all six age groups have a common equation which is very stable about the relationship between BMI categories and PFI. And this result had also been reported in Taiwan about boys aged from 9 to 18 [9]. Besides, combined with the result come from Huang etc. [9], we found except one transient decrease between age groups 20 and 21-22 (may cause by the age group definition or sample size), the curvature of this parabola is continuous increasing from youth to middle age. This means the BMI have little influence with PFI during childhood, which may answer why previous study had reported the relationship between PFI and BMI in adolescent is confusion [7], but meanwhile, the power of BMI influence is growing day by day, and finally will decide the value of PFI of a middle-aged man.
The result of relationship between BMI and PFI in women comes from this study is confusion, for example, in the early age of adult (18-19 yr), the best PFI comes from the thinness categories (the sample size is not very small). In addition, when the age comes up to more than 19 years old, the result of relationship between BMI and PFI doesn鈥檛 make any sense. Besides, we also found much more underweight or thinness in female than male that is consistent with other studies [10]. This may caused by the common cultural factors, the influence of the modern film or TV entertainment etc. Most females desire to be slim by dieting [11], and this will cause the reduction of muscle mass and inappropriate proportion of muscle mass, fat mass and bone mineral content, which may partly explain our results. Furthermore, with the unhealthy way to decrease in BMI in females, we are concerned that the physical fitness of females will be constantly declining.
Acknowledgements
This work was founded by the Natural Science Foundation (Key Project) of Universities of Anhui Province (KJ2010A160). And we are grateful to Dr. Qiping Zheng for his editorial help in preparation of this manuscript. We are also grateful for the students and teachers for participating in this study.
Disclosure of conflict of interest
None.
References
- 1.McGuire S, Shields M, Carroll MD, Ogden CL. Adult obesity prevalence in Canada and the United States. NCHS data brief no. 56, Hyattsville, MD: National Center for Health Statistics, 2011. Adv Nutr. 2011;2:368–369. doi: 10.3945/an.111.000497. [DOI] [PMC free article] [PubMed] [Google Scholar]
- 2.Chauhan LS, Dikid T, Narain JP. Public health, evidence-based policy-making and the role of epidemiology. Natl Med J India. 2013;26:191–193. [PubMed] [Google Scholar]
- 3.Li Y, Schouten EG, Hu X, Cui Z, Luan D, Ma G. Obesity prevalence and time trend among youngsters in China, 1982-2002. Asia Pac J Clin Nutr. 2008;17:131–137. [PubMed] [Google Scholar]
- 4.Lobstein T, Baur L, Uauy R. Obesity in children and young people: a crisis in public health. Obes Rev. 2004;5(Suppl 1):4–104. doi: 10.1111/j.1467-789X.2004.00133.x. [DOI] [PubMed] [Google Scholar]
- 5.Kovacs VA, Fajcsak Z, Gabor A, Martos E. School-based exercise program improves fitness, body composition and cardiovascular risk profile in overweight/obese children. Acta Physiol Hung. 2009;96:337–347. doi: 10.1556/APhysiol.96.2009.3.7. [DOI] [PubMed] [Google Scholar]
- 6.Ding JJ, Xu J. Injury of obesity in aerobic capacity in Children. Chinese Journal of Pediatrics. 1990;28:341–343. [Google Scholar]
- 7.Bovet P, Auguste R, Burdette H. Strong inverse association between physical fitness and overweight in adolescents: a large school-based survey. Int J Behav Nutr Phys Act. 2007;4:24. doi: 10.1186/1479-5868-4-24. [DOI] [PMC free article] [PubMed] [Google Scholar]
- 8.Shang X, Liu A, Li Y, Hu X, Du L, Ma J, Xu G, Guo H, Ma G. The Association of Weight Status with Physical Fitness among Chinese Children. Int J Pediatr. 2010;2010:515414. doi: 10.1155/2010/515414. [DOI] [PMC free article] [PubMed] [Google Scholar]
- 9.Huang YC, Malina RM. BMI and health-related physical fitness in Taiwanese youth 9-18 years. Med Sci Sports Exerc. 2007;39:701–708. doi: 10.1249/mss.0b013e31802f0512. [DOI] [PubMed] [Google Scholar]
- 10.Mak KK, Ho SY, Lo WS, Thomas GN, McManus AM, Day JR, Lam TH. Health-related physical fitness and weight status in Hong Kong adolescents. BMC Public Health. 2010;10:88. doi: 10.1186/1471-2458-10-88. [DOI] [PMC free article] [PubMed] [Google Scholar]
- 11.Kiriike N, Nagata T, Sirata K, Yamamoto N. Are young women in Japan at high risk for eating disorders?: Decreased BMI in young females from 1960 to 1995. Psychiatry Clin Neurosci. 1998;52:279–281. doi: 10.1046/j.1440-1819.1998.00387.x. [DOI] [PubMed] [Google Scholar]