

Abstract
Purpose
Magnetic resonance imaging (MRI)-based techniques for assessing liver iron concentration (LIC) have been limited by single scanner calibration against biopsy. Here, the calibration of spin-density projection-assisted (SDPA) R2-MRI (FerriScan®) in iron-overloaded β-thalassemia patients treated with the iron chelator, deferasirox, for 12 months is validated.
Methods
SDPA R2-MRI measurements and percutaneous needle liver biopsy samples were obtained from a subgroup of patients (n = 233) from the ESCALATOR trial. Five different makes and models of scanner were used in the study.
Results
LIC, derived from mean of MRI- and biopsy-derived values, ranged from 0.7 to 50.1 mg Fe/g dry weight. Mean fractional differences between SDPA R2-MRI- and biopsy-measured LIC were not significantly different from zero. They were also not significantly different from zero when categorized for each of the Ishak stages of fibrosis and grades of necroinflammation, for subjects aged 3 to <8 versus ≥8 years, or for each scanner model. Upper and lower 95% limits of agreement between SDPA R2-MRI and biopsy LIC measurements were 74 and −71%.
Conclusion
The calibration curve appears independent of scanner type, patient age, stage of liver fibrosis, grade of necroinflammation, and use of deferasirox chelation therapy, confirming the clinical usefulness of SDPA R2-MRI for monitoring iron overload. Magn Reson Med 71:2215–2223, 2014. © 2013 Wiley Periodicals, Inc.
Keywords: deferasirox, iron overload, β-thalassemia, ESCALATOR, biopsy
Iron overload is a consequence of several clinical disorders, such as thalassemia, sickle cell disease, hereditary hemochromatosis (HH), aplastic anemia, and myelodysplasia. Some of the major determinants of clinical outcome in iron-overloaded patients include the total amounts and concentration of iron in different tissues, irrespective of whether the iron overload results from transfusion therapy, increased dietary iron absorption, or both.
Chelation therapy or phlebotomy is necessary in order to avoid the serious clinical consequences of uncontrolled iron overload, which include liver cirrhosis and cardiac and endocrine dysfunction (1). Accurate assessment of body iron burden is therefore an important element of management for patients at risk of iron overload. For patients receiving iron chelation therapy, regular monitoring of body iron burden is essential to prevent iron toxicity, while avoiding potential adverse effects of excess chelator administration. Accurate determination of body iron stores can also be used in patients with HH to identify patients at risk of iron-induced organ damage who would benefit from phlebotomy therapy (2).
The reference standard for evaluating the magnitude of body iron overload in systemic iron overload is measurement of the liver iron concentration (LIC) (3,4). Until recently, the conventional clinical method for measuring LIC was through chemical analysis of biopsy specimens and this has been considered the “gold standard” of LIC measurement (5). However, the invasive nature and risks associated with multiple liver biopsies preclude serial observations. Measurement of LIC and detection of fibrosis or cirrhosis in biopsy specimens are also subject to sampling variability, primarily as a result of the natural spatial variation of LIC and fibrosis throughout the liver relative to the small size of the biopsy (6–8). Furthermore, the variation in LIC throughout the liver increases as iron loading increases and with the development of cirrhosis (6).
To counter the shortcomings of liver biopsy, several noninvasive techniques have been applied to estimate LIC, including biomagnetic susceptometry based on superconducting quantum interference device (SQUID) technology and magnetic resonance imaging (MRI) techniques. However, biomagnetic susceptometry is currently only accessible at a limited number of centers (2,9–12).
Since the 1990s, several MRI-based techniques for assessing LIC have been proposed (13). These techniques are based either on the measurement of the ratios of signal intensities from the liver and from a non-iron-loaded reference tissue (14) or the measurement and imaging of proton transverse relaxation rates (R2 or R2*) within the liver (15–17). Radiofrequency pulse recalled echo imaging produces images for calculating T2 and R2 MRI parameters, and gradient echo imaging produces images for calculating T2* and R2* MRI parameters (18). However, one of the major limitations of these techniques is that they have typically been calibrated against LIC measurement by biopsy or other reference standard using a single scanner only (14,17,19). Furthermore, methods of image data acquisition and analysis are often not standardized. With regard to liver T2* measurement, evidence indicates that calibrations are not transferable from one method to another. For example, a liver T2* of 2.5 ms measured on a 1.5-T scanner gives vastly different LIC results depending on the calibration used, as follows: 5.4 mg Fe/g dry weight (dw) (20), 10.4 mg Fe/g dw (17), 10.7 mg Fe/g dw (21), 12.7 mg Fe/g dw (22), and 26.4 mg Fe/g dw (23). These wide-ranging LIC values for the same value of liver T2* cover the range from low-risk (<7 mg Fe/g dw) through moderate-risk (7–15 mg Fe/g dw) to high-risk (>15 mg Fe/g dw) categories (24), making interpretation of the absolute value of the T2* measurement problematic unless the specific method and scanner have been calibrated. Although monitoring the relative values of uncalibrated liver, T2* in serial measurements may be useful in clinical practice to facilitate dose titrations of iron chelators in response to ongoing iron burden, the high cost of using MRI scanner time for such qualitative monitoring needs to be assessed in relation to the benefits gained above and beyond those obtained from serial serum ferritin measurements.
Other factors that can potentially confound calibrations of MRI methods of liver iron measurement are the presence of liver fibrosis and inflammation because of the associated change in water diffusion within the tissue (13).
We previously reported on calibration of the spin-density projection-assisted (SDPA) R2-MRI (FerriScan®) technique, using data from five different scanners on 105 patients with a range of iron-loading disorders (16). None of the subjects contributing to the calibration curve had been chelated with deferasirox (EXJADE®; Novartis Pharma AG, Basel, Switzerland), an oral iron chelator that has been approved for clinical use by the Food and Drug Administration since the original calibration study. We now report on the validity of the SDPA R2-MRI calibration using five more different scanners by comparing biopsy iron assays from a larger group of regularly transfused, heavily iron-overloaded patients with β-thalassemia treated with the iron chelator, deferasirox with the SDPA R2-MRI LIC measurements, allowing any impact of this chelation therapy, scanner type, age of patient, stage of liver fibrosis, and grade of necroinflammation on the calibration to be determined. Specifically, the study is aimed at determining (i) whether there is any significant bias between the SDPA R2-MRI and biopsy methods of measuring LIC and (ii) what are the limits of agreement between the two methods in order to determine whether SDPA R2-MRI can be used in place of biopsy for the purpose of measuring LIC in patients with thalassemia being treated with deferasirox.
METHODS
Patients
The ESCALATOR (Efficacy and Safety of long-term treatment with ICL670 in β-thALAssemia patients with Transfusional hemOsideRosis) study was a 1-year prospective, open-label trial conducted in the Middle East that evaluated the efficacy and safety of treatment with deferasirox (ICL670) in 252 heavily iron-overloaded pediatric and adult patients with β-thalassemia (25). The 1-year core study was followed by an extension study over a median period of 1.7 years (26).
Detailed patient inclusion and exclusion criteria have been published elsewhere (25). Male or female patients aged ≥2 years with β-thalassemia and transfusional iron overload were eligible for inclusion if they had been treated with prior mono- or combination iron chelation therapy with deferoxamine and/or deferiprone, but had unacceptable toxicity, poor response, noncompliance, or any contraindication to deferoxamine. Patients were also required to have an LIC ≥ 2 mg Fe/g dw and a serum ferritin level of ≥500 ng/mL.
A subgroup of patients was enrolled in an optional MRI substudy during the 1-year core study in order to explore the potential role of SDPA R2-MRI as a noninvasive method for evaluating LIC. Patients who underwent the SDPA R2-MRI measurements of LIC were recruited from centers with local access to 1.5T scanners that were capable of performing the measurement protocol described below (see section MRI) and that passed the validation requirements described below (see section MRI Instrument Validation). All patients (or parents/guardians) gave written informed consent to participate in the study.
Assessment of LIC
Liver biopsy was the reference technique for standardized determination of LIC during the 1-year core ESCALATOR trial. For the extension study, SDPA R2-MRI became the technique for standardized determination of LIC.
The validation study presented here uses biopsy data from end-of-core-study assessments and MRI data from end-of-core study (for patients enrolled in the MRI substudy) or extension baseline (for the remainder). End-of-core study MRI assessments constituted baseline assessments for the extension phase.
SDPA R2-MRI measurements and percutaneous needle liver biopsy samples (>0.5 mg dw) were obtained from the patients at five clinical centers after 12 months of enrollment in the ESCALATOR core trial. MRI scanning was scheduled as close as possible to the liver biopsy procedure.
Determination of Liver Biopsy Iron Concentration
Biopsy samples were fixed in buffered neutral formalin and were then embedded in paraffin. Histological examination of the biopsies and quantitative measurement of LIC by atomic absorption spectrometry (AAS) (27,28) were carried out in a single laboratory (Rennes University Hospital, Rennes, France). Results were reported for samples with dw greater than 0.5 mg. Liver fibrosis staging and necroinflammatory grading were performed according to the Ishak scales (29).
MRI
Noninvasive measurements of LIC were made using the SDPA R2-MRI technique (FerriScan®) on five MRI scanners that were of different makes/models from the original five scanners used in the calibration study (16). The instruments used in the current study comprised a Philips NT Intera, a Philips Gyroscan, a Siemens Sonata, a Siemens Symphony, and a GE Signa Excite. MRI scanners were required to have a static field strength of 1.5 T and be capable of acquiring single spin-echo (SSE) images with a minimum echo time (TE) of 6 ms.
Details of the MRI methodology are described elsewhere (15,16). In summary, axial images were acquired with a multislice SSE pulse sequence, with a pulse repetition time of 2500 ms, spin TEs of 6, 9, 12, 15, and 18 ms, and slice thickness of 5 mm. Bandwidths were set to the minimum value possible while still enabling a spin echo of 6 ms to be achieved. A frequency encoding matrix size of 256 was used, with typical fields of view between 350 and 400 mm (exact dimensions depending on patient size). The phase-encoding direction was set to anterior–posterior; technicians were given freedom to adjust the phase field of view and hence the size of the phase encoding matrix to accommodate the shape of the patient. The most commonly used phase field of view was 75%, giving the phase encoding matrix a size of 192. A 1000mL bag of normal saline solution was imaged with each patient to provide an external long T2 reference for the correction of instrumental gain drift and signal intensity variations due to any bandwidth changes. Each patient was positioned so that the liver was located central to the phased array torso coil. Slices (n = 11) were collected for each patient, with a gap between slices of 5 mm and the first slice positioned near the top of the liver such that slices were spread across the majority of the liver. Patients were required to refrain from movements of their torso during data acquisition. Breath-hold methods were not employed. Typical data acquisition times were 22 min.
MRI Instrument Validation
As a part of the quality assurance process each scanner was validated by assessing the precision and accuracy of the measurement of R2 for a series of 15 MnCl2 solutions with different concentrations, using the same pulse sequence as used for the patients. The range of concentrations of MnCl2 (0–3.2 mM) provided R2 values spanning the range encountered in healthy and iron-loaded human liver. Phantoms were prepared in a central laboratory and delivered to each MRI unit as a single box.
MRI Data Analysis
All MRI data were analyzed by trained analysts at a single laboratory (Resonance Health Analysis Services Pty Ltd., Australia) working under ISO9001 quality-controlled conditions. MRI data analysts were blinded to the biopsy AAS results. Data analysis followed the general principles outlined by St. Pierre et al (15). This method involves the correction of gain drift between images measured at different TEs, the measurement of image background noise, the subtraction of the image background noise from the magnetic resonance signal in quadrature, and the modeling of signal decay in each voxel with a monoexponential (phantoms) or biexponential (patients) function and an estimate of the MRI signal intensity at zero TE using the technique of spin-density projection (15).
R2 distributions and the mean R2 for the maximal cross-sectional liver slice were calculated. LICs were calculated from the mean R2 using the previously reported calibration curve (16). Image analysts made no attempt to colocalize the region of R2 measurement with the biopsy location.
Statistical Analyses
Upper and lower 95% limits of agreement between the LIC values determined from the SDPA R2-MRI and those obtained from biopsy were calculated using the methods of Bland and Altman (30). Ninety-five percent limits of agreement provide information about an interval within which 95% of differences between measurements by the two methods are expected to lie. One sample t-tests were used to determine whether mean fractional differences between SDPA R2-MRI- and biopsy-measured LIC values were significantly different from zero at the α = 0.05 level. Bartlett’s test was used to determine whether variances of the percentage differences between SDPA R2-MRI- and biopsy-recorded LIC values for patients measured on different scanners were significantly different from each other at the α = 0.05 level. All differences between the LIC measurements made by the two techniques were analyzed in terms of fractional (or percentage) differences since in both the original calibration study (16) and the current study, the variance of absolute differences between the two techniques was found to increase with LIC while the variance of fractional differences remained approximately constant across the LIC range.
RESULTS
Patients
Two hundred forty-seven patients were enrolled in the ESCALATOR extension study, of which 233 from five different sites were included in the SDPA R2-MRI validation study. Fourteen patients were excluded for the following reasons: biopsy mass < 0.5 mg (n = 4); unresolvable data mismatch (n = 1); biopsy mass < 0.5 mg and unresolvable data mismatch (n = 1); discrepancy between biochemical iron assay and histopathology result (n = 2); MRI scan not obtained (n = 2); and biopsy sample not obtained (n = 4).
Patients were aged from 3 to 43 years and all patients were receiving regular transfusions and treatment with deferasirox (Table 1). Mean deferasirox treatment duration was 52.4 ± 4.1 weeks (median 52.3 [range 6.4–61.3] weeks). Noninvasive measurements of LIC were made using the SDPA R2-MRI technique (FerriScan®) on five different MRI scanners (Philips NT Intera [82 subjects]; Philips Gyroscan [102 subjects]; Siemens Sonata [18 subjects]; Siemens Symphony [11 subjects]; and GE Signa Excite [20 subjects]). The mean timing of the MRI scan after the date of biopsy procedure was 15 ± 38 days.
Table 1.
Patient Characteristics
| Characteristic | Patients (n = 233) |
|---|---|
| Mean age at date of scan ± SD, years (range) | 14.3 ± 7.1 (3–43) |
| Age group, n (%) | |
| ≥3 to <8 years | 39 (16.7) |
| ≥8 years | 194 (83.3) |
| Female:male, n | 113:120 |
| Race (Caucasian:Oriental:other), n | 68:124:41 |
| History of hepatitis B only, n (%)a | 4 (1.7) |
| History of hepatitis C only, n (%)a | 71 (30.5) |
| History of hepatitis B and C, n (%)a | 4 (1.7) |
| Splenectomy, n (%) | 94 (40.3) |
| Previous chelation therapy, n (%) | |
| DFO monotherapy | 190 (81.5) |
| Deferiprone monotherapy | 4 (1.7) |
| DFO + deferiproneb | 39 (16.7) |
| Median duration of previous chelation therapy, yearsc (range) | 6.7 (0.1–21.0) |
| Mean duration of previous transfusions ± SD, years | 12.0 ± 6.5 |
| Mean number of transfusion sessions in the year prior to study entry ± SD | 15.6 ± 4.9 |
| Mean volume of packed red cells transfused in the year prior to study entry ± SD, mL/kg | 174.3 ± 68.3 |
DFO, deferoxamine; SD, standard deviation.
Investigator-reported patient history.
Patients had received prior chelation with DFO and deferiprone, although these may not have been given in combination.
n = 161.
Limits of Agreement Between SDPA R2-MRI and Biopsy Measurement of LIC
Figure 1 shows the LIC measurements by SDPA R2-MRI plotted against those made by biopsy with the solid line representing the line of equivalence.
Figure 1.

a: LIC measurements by SDPA R2-MRI vs. LIC measurements by biopsy (n = 233). The solid line is the line of equivalence; b: Bland–Altman plot showing the fractional differences between the two measurements of LIC for each subject. The solid line shows the mean fractional difference and the dotted lines show the 95% limits of agreement between the two measurements. Symbol shape indicates scanner used: • Philips NT Intera; ▪ Philips Gyroscan; ♦ Siemens Sonata; ▴ GE Signa Excite; ▾ Siemens Symphony.
LIC values (calculated as the mean of SDPA R2-MRI- and biopsy-measured values for each patient) ranged from a minimum of 0.7 to a maximum of 50.1 mg Fe/g dw for all patients included in the study (corresponding to R2 values from 29 to 306 s−1 or T2 values from 34.5 to 3.3 ms). The upper and lower 95% limits of agreement between the SDPA R2-MRI and biopsy measurements of LIC were 74 and −71%, respectively, with the mean percentage difference being 1.9 ± standard error 2.4% (Fig. 1b), which is not significantly different from zero, thus validating the previously reported calibration curve (16) in this cohort of subjects.
Staging of Fibrosis and Grading of Necroinflammation
The stage of fibrosis most frequently encountered was Ishak stage 2, while the most frequently encountered necroinflammation grade was 0 (Fig. 2). The Ishak fibrosis staging for the 233 patients was as follows: 0 (n = 15, 6.4%), 1 (n = 43, 18.5%), 2 (n = 68, 29.2%), 3 (n = 33, 14.2%), 4 (n = 20, 8.6%), 5 (n = 26, 11.2%), and 6 (n = 25, 10.7%); and for the necroinflammation grades was as follows: 0 (n = 68, 29.2%), 1 (n = 60, 25.8%), 2 (n = 39, 16.7%), 3 (n = 23, 9.9%), 4 (n = 20, 8.6%), 5 (n = 8, 3.4%), 6 (n = 10, 4.3%), 7 (n = 1, 0.4%), 8 (n = 0, 0.0%), and 9 (n = 1, 0.4%); fibrosis stages and necroinflammatory grades were unavailable for three patients (Fig. 2).
Figure 2.
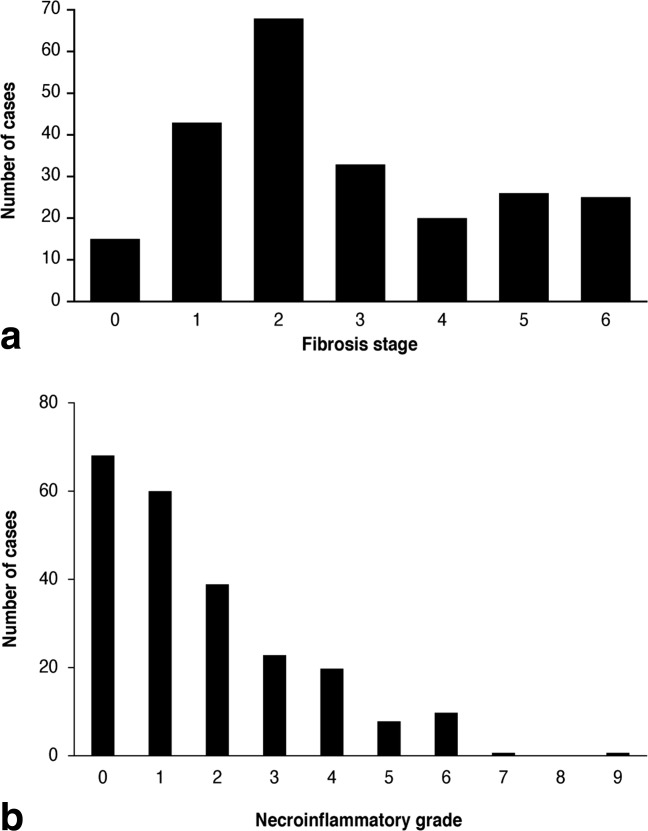
Distribution of (a) Ishak fibrosis stages and (b) Ishak necroinflammatory grades for patients in the study. Three patients unknown.
Effect of Fibrosis Stage on Agreement Between SDPA R2-MRI and Biopsy Measurements of LIC
The standard deviation of the percentage differences between SDPA R2-MRI- and biopsy-measured LICs increased with worsening liver fibrosis stage (Fig. 3) from 30% at Ishak stage 0 to 39% at Ishak stage 5–6. However, the increase was not statistically significant with 95% confidence.
Figure 3.

Effect of fibrosis stage on agreement between SDPA R2-MRI and biopsy measurements of LIC.
Equivalence Across Liver Fibrosis Stages and Necroinflammatory Grades
The mean fractional differences between SDPA R2-MRI- and biopsy-measured LIC for each stage of fibrosis were not significantly different from zero, indicating that the calibration curve is applicable across all stages of liver fibrosis (Fig. 4a).
Figure 4.
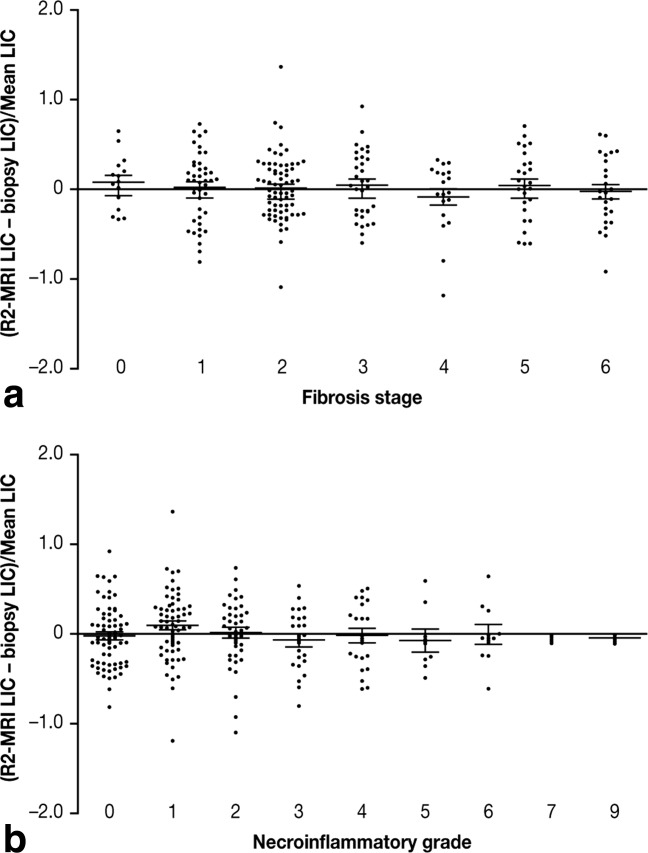
Fractional differences between LIC measurements by SDPA R2-MRI and biopsy for patients with different (a) liver fibrosis stages and (b) necroinflammatory grades. Means and standard errors of the means are shown. Fibrosis stages and necroinflammatory grades were unavailable for three of the 233 patients.
The mean fractional differences between SDPA R2-MRI and biopsy-measured LIC for each necroinflammatory grade were not significantly different from zero, indicating that the necroinflammation did not have a significant effect on the calibration curve in these patients (Fig. 4b).
Reproducibility Between Scanner Makes and Models
The mean fractional difference between the SDPA R2-MRI and biopsy LIC measurements for each MRI scanner was not significantly different from zero (Fig. 5), indicating that the original calibration curve was applicable to this new patient group across different MRI scanners. Furthermore, variances of the percentage differences between the biopsy- and SDPA R2-MRI-derived LIC measurements for the five scanners were not significantly different (Bartlett’s test for equal variances), indicating that the precision of LIC measurement was not significantly different between scanners (Fig. 5).
Figure 5.
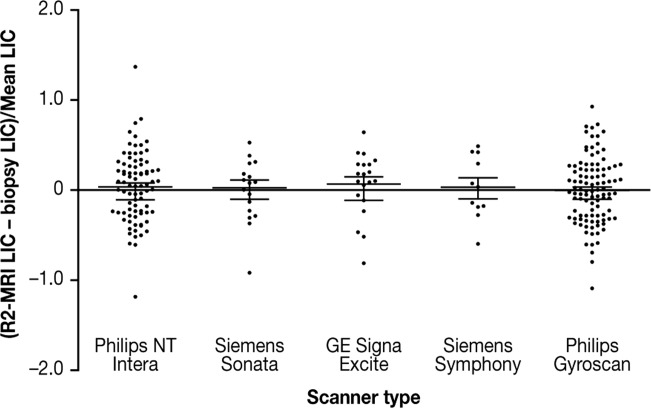
Fractional differences between LIC measurements by SDPA R2-MRI and biopsy for 233 patients on five different MRI scanners. Means and standard errors of the means are shown. The median (range) of mean LIC measured on each scanner were: Philips NT Intera, 16.2 (4.7–50.1) mg Fe/g dw; Philips Gyroscan, 9.5 (0.7–42.6) mg Fe/g dw; Siemens Sonata, 27.4 (12.5–38.6) mg Fe/g dw; GE Signa Excite, 9.3 (1.4–39.8) mg Fe/g dw; and Siemens Symphony, 21.4 (6.4–40.2) mg Fe/g dw.
Validation in Children
A total of 39 patients were less than 8 years of age, with the youngest being 3 years old [8 years was the minimum age of patients involved in the original calibration (16)]. In this population, the mean fractional difference in LIC between SDPA R2-MRI- and biopsy-measurement was not significantly different from zero, indicating that the same calibration can be used in children (Fig. 6).
Figure 6.
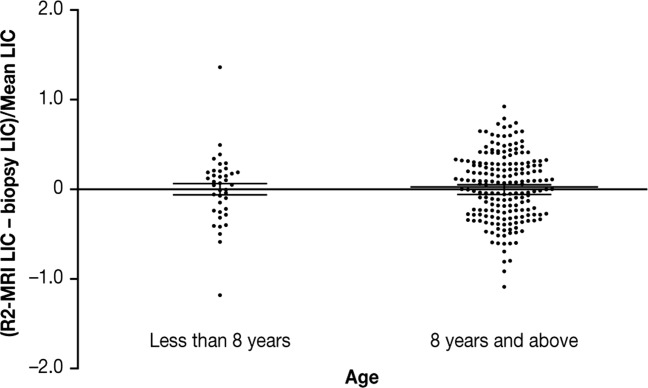
Fractional differences between LIC measurements by SDPA R2-MRI and biopsy for 39 subjects aged less than 8 years, and 194 patients aged 8 years and above. Means and standard errors of the means are shown. The medians (ranges) of the mean LIC measurements for the subjects less than 8 years old were 13.7 (5.1–38.0) mg Fe/g dw and for the subjects 8 years old and above were 13.4 (0.7–50.1) mg Fe/g dw.
DISCUSSION
Our previous calibration study showed that the SDPA R2-MRI technique had negligible instrument-dependent systematic errors, a universal calibration curve applicable to patients with a range of iron-loading disorders and iron concentration imaging capabilities (16). In this study, we now expand these findings and show that the calibration curve for the SDPA R2-MRI technique appears to be unaffected by differences in stage of liver fibrosis, grade of liver necroinflammation, patient age, use of deferasirox iron chelation and type of scanner; with no statistically significant deviations in a group of 233 regularly transfused patients with β-thalassemia treated with deferasirox.
There is a need for a quantitative means of measuring body iron storage that is noninvasive, safe, accurate, and readily available to improve the diagnosis and management of patients with iron overload. LIC is used as a surrogate for total body iron stores (27). Precise and accurate assessment of LIC aids physicians in determining if and when chelation or phlebotomy therapy should begin, for monitoring response to chelation therapy and adjusting regimens accordingly, and for providing accurate feedback to patients to address potential compliance issues.
Conventionally, LIC has been measured by chemical assay of biopsy tissue. An advantage of biopsy measurement of LIC is that histopathology can yield further information about the status of the liver such as fibrosis stage, necroinflammation grade, and distribution of iron between hepatocytes and Kupffer cells. However, liver biopsy is invasive and is subject to sampling variations, particularly with increasing iron loading and the development of fibrosis and cirrhosis (6). Furthermore, many patients, particularly those with transfusional iron overload related to hematological malignancies, have contraindications to biopsy, such as thrombocytopenia or other bleeding diatheses.
In this study, the upper and lower 95% limits of agreement between the SDPA R2-MRI and biopsy measurements of LIC were 74 and −71%, respectively. These limits were greater than those observed in the original calibration study (50 and −56%) (16) and may reflect the generally higher stages of fibrosis and hence higher degrees of biopsy sampling error observed in the current population of regularly transfused patients (75% with Ishak fibrosis stage 2 and above) compared with those in the original calibration study (45% with Ishak fibrosis stage 2 and above) (16). By taking a subsample of the subjects in this study (n = 55) with a distribution of fibrosis stages to match those in the original calibration study, the 95% limits of agreement become 55 and −61%, which are more similar to those in the calibration study.
Emond et al. (6) showed that single biopsy LIC measurements are less precise in livers with moderately elevated LIC and that the precision worsens as the overall iron load of the liver increases (6). Their findings, alongside others, showed coefficient of variation values for multiple needle biopsy measurements of LICs from individual livers range from an average of 19% for disease-free liver to an average of more than 40% for end-stage liver disease for biopsy sample dry tissue mass of less than 4 mg (6,8). The underlying reason for the increased sampling error of biopsy-based LIC measurement with higher stages of fibrosis is related to the lack of iron deposition found in the fibrous septa and the spatial inhomogeneity of fibrosis within the liver (31). These coefficients of variation of measurement of LIC by biopsy (19–40%) correspond to repeatability coefficients (the equivalent of 95% limits of agreement but for repeat measurements rather than comparison of measurements) of ±53% to over ±111%. Thus, the biopsy sampling error is likely to be a major contributor to the span of limits of agreement of 74 to −71% observed in this study. From repeatability studies of the SDPA R2-MRI technique (16,32), the standard error on a single LIC measurement can be estimated to be approximately 15% on average (slightly higher at extreme high and low LIC values and slightly lower in the middle of the range). Thus, the repeatability coefficient for LIC measurement by SDPA R2-MRI is approximately ±42%, somewhat lower than that for biopsy. The variance of the agreement between SDPA R2-MRI and biopsy measurement was greater as the liver fibrosis stage worsened. Although the increasing trend of the variance with fibrosis stage is consistent with observations showing that biopsy sampling error increases with worsening fibrosis stage (6), it was not statistically significant.
Another factor that could contribute to the magnitude of the variance of the differences between R2-MRI LIC and biopsy LIC is a postulated variation in relationship between liver R2 and LIC between individuals. Such a variation is impossible to measure directly. However, assuming such a variation exists, the results of this study suggest that it is a variation that does not systematically vary with degree of fibrosis, grade of necroinflammation, age of patient, or type of chelation. The presence of liver fat is known to have an effect of liver T2*/R2* measurements because of the chemical shift between water and fat protons. While T2/R2 measurements are not prone to the same effect, a limitation of this study is that liver fat was not quantified in the biopsy histology. As such, the role of the presence of fat as a contributor to the variance in differences between biopsy and SDPA R2-MRI remains to be determined.
The relative contributions to the overall limits of agreement between the R2-MRI and biopsy measurements of LIC can be estimated as follows. The variance of the R2-MRI measurements of LIC based on studies of repeatability (32) can be estimated to be approximately 0.0225 (i.e., approximately 15% coefficient of variation). The variance of measurements of LIC by biopsy ranges from an average of 0.0361 (i.e., 19% coefficient of variation) for fibrosis stage 0 to 0.1600 (i.e., 40% coefficient of variation) and above for fibrosis stage 6 (6–8). By assuming a linear variation of the variance of biopsy LIC measurements with fibrosis stage from 0.0361 at stage 0 to 0.1600 at stage 6, the weighted average variance for the biopsy LIC measurements in this study can be calculated to be 0.0934 (i.e., a 31% coefficient of variation). The variance of the differences between the R2-MRI LIC measurements and biopsy LIC measurements would be expected to be the sum of (i) the variances associated with R2-MR repeatability, (ii) the variance associated with the biopsy LIC measurements, and (iii) the variance associated with any other factors such as variations in the R2-LIC calibrations between individuals or any other factor that has not been considered. Since the overall variance between the R2-MRI and biopsy LIC measurements is 0.1368 (given by the square of the [upper and lower 95% limits of agreement interval divided by 1.96]), the variance associated with the third contribution can be estimated to be 0.0209. If we conservatively attribute all of the variance associated with the third contribution to R2-MRI measurements (e.g., calibration differences between individuals), then the overall variance contributed to the limits of agreement by the R2-MRI LIC measurements is 0.0434 (equivalent to a coefficient of variation of 21%) compared with 0.0934 (equivalent to a coefficient of variation of 31%) for the biopsy LIC measurements. Interestingly, using this analysis, the standard deviation of differences between R2-MRI and biopsy measurements of LIC for subjects with fibrosis stage zero is predicted to be 28 ± 7% (cf. observed standard deviation [SD] of 30%, Fig. 3), while that for subjects with fibrosis stages 5 and 6 is predicted to be 44 ± 6% (cf. observed SD of 39%, Fig. 3).
The magnitude of biopsy sampling errors and their relationship to stage of liver fibrosis indicate that it is necessary to take into account the distribution of fibrosis stages within a patient cohort when assessing the 95% limits of agreement between MRI measures of LIC and biopsy measures of LIC.
The increased sampling error of biopsies with increasing iron load may also partly explain the reduced sensitivity and specificity of the SDPA R2-MRI technique for prediction of biopsy LIC at higher LICs observed in the original calibration curve study (16). However, high levels of sensitivity and specificity were observed in that study at the clinically important LIC thresholds of 1.8, 3.2, 7.0, and 15.0 mg Fe/g dw (16).
As with the calibration study (16), the assessments reported in the current study were made across five different scanners. The scanners were different from the original scanners used in the calibration study. No statistically significant differences in accuracy or precision of LIC measurements between the five scanners were observed. This observation suggests that the SDPA R2-MRI technique (which includes a scanner validation protocol using the aqueous MnCl2 phantom validation standards) can be used with confidence across a range of commercially available MRI scanners. Furthermore, no detectable changes in the calibration curve were caused by deferasirox therapy, the presence of liver fibrosis or necroinflammation, or use in children. The observation that the use of deferasirox (used on all subjects in this study for approximately 12 months and used on no subjects in the original calibration study) does not alter the calibration curve is important because recent studies in an animal model suggested that use of chelators could potentially change R2-LIC calibration curves (33). Validation of the calibration curve in patients receiving deferasirox means that the SDPA R2-MRI technique may provide an effective tool to monitor chelation therapy and modify treatment accordingly. Results from the ESCALATOR study have shown the importance of timely dose adjustments in order to achieve clinical goals, thus underscoring the importance of a reliable method to assess iron overload (25).
One advantage of the SDPA R2-MRI technique used in this study is that breath-holds are not required, thus enabling easier measurement of patients with the inability to comply, such as children. However, data acquisition for the SDPA R2-MRI technique is generally longer than the single breath-hold T2*/R2* techniques; recent advances have reduced data acquisition time for the SDPA R2-MRI method to approximately 9–22 min (32). While the 9-min data acquisition protocol has been compared with the 22-min data acquisition protocol at two sites (32), widespread implementation of the new protocol would require a multicenter study to test for bias and precision differences from the 22-min data acquisition protocol.
In conclusion, our findings confirm the clinical usefulness of SDPA R2-MRI as a safe and noninvasive monitoring tool for iron overload. To date, this is the only MRI technique that has been calibrated and validated across multiple scanners in patients of different ages, with different stages of liver fibrosis and grades of liver necroinflammation, and in the presence of deferasirox chelation therapy. SDPA R2-MRI measurement of R2 provides a reliable and an accurate method for estimation of LIC that is suitable for diagnosis and management of patients with iron overload. This technique should facilitate iron chelation therapy by providing accurate liver iron measurements for determining optimal chelation dosing.
Acknowledgments
The ESCALATOR study was sponsored by Novartis Pharma AG and designed by the sponsor in close collaboration with the Study Steering Committee composed of renowned hematologists and experts in the field of thalassemia. Financial support for medical editorial assistance was provided by Novartis Pharmaceuticals. Data were analyzed independently from Novartis and all authors had control of the data. The authors thank Michelle Utton-Mishra of Mudskipper Business Ltd. for medical editorial assistance with this manuscript.
REFERENCES
- 1.Hershko C, Link G, Cabantchik I. Pathophysiology of iron overload. Ann NY Acad Sci. 1998;850:191–201. doi: 10.1111/j.1749-6632.1998.tb10475.x. [DOI] [PubMed] [Google Scholar]
- 2.Brittenham GM, Farrell DE, Harris JW, Feldman ES, Danish EH, Muir WA, Tripp JH, Bellon EM. Magnetic-susceptibility measurement of human iron stores. N Engl J Med. 1982;307:1671–1675. doi: 10.1056/NEJM198212303072703. [DOI] [PubMed] [Google Scholar]
- 3.Brittenham GM, Griffith PM, Nienhuis AW, McLaren CE, Young NS, Tucker EE, Allen CJ, Farrell DE, Harris JW. Efficacy of deferoxamine in preventing complications of iron overload in patients with thalassemia major. N Engl J Med. 1994;331:567–573. doi: 10.1056/NEJM199409013310902. [DOI] [PubMed] [Google Scholar]
- 4.Brittenham GM, Sheth S, Allen CJ, Farrell DE. Noninvasive methods for quantitative assessment of transfusional iron overload in sickle cell disease. Semin Hematol. 2001;38:37–56. doi: 10.1016/s0037-1963(01)90059-9. [DOI] [PubMed] [Google Scholar]
- 5.Angelucci E, Baronciani D, Lucarelli G, Baldassarri M, Galimberti M, Giardini C, Martinelli F, Polchi P, Polizzi V, Ripalti M. Needle liver biopsy in thalassaemia: analyses of diagnostic accuracy and safety in 1184 consecutive biopsies. Br J Haematol. 1995;89:757–761. doi: 10.1111/j.1365-2141.1995.tb08412.x. [DOI] [PubMed] [Google Scholar]
- 6.Emond MJ, Bronner MP, Carlson TH, Lin M, Labbe RF, Kowdley KV. Quantitative study of the variability of hepatic iron concentrations. Clin Chem. 1999;45:340–346. [PubMed] [Google Scholar]
- 7.Villeneuve J-P, Bilodeau M, Lepage R, Côté J, Lefebvre M. Variability in hepatic iron concentration measurement from needle-biopsy specimens. J Hepatol. 1996;25:172–177. doi: 10.1016/s0168-8278(96)80070-5. [DOI] [PubMed] [Google Scholar]
- 8.Kreeftenberg HG, Koopman BJ, Huizenga JR, van Vilsteren T, Wolthers BG, Gips CH. Measurement of iron in liver biopsies—a comparison of three analytical methods. Clin Chim Acta. 1984;144:255–262. doi: 10.1016/0009-8981(84)90061-5. [DOI] [PubMed] [Google Scholar]
- 9.Nielsen P, Engelhardt R, Duerken M, Janka GE, Fischer R. Using SQUID biomagnetic liver susceptometry in the treatment of thalassemia and other iron loading diseases. Transfus Sci. 2000;23:257–258. doi: 10.1016/s0955-3886(00)00101-6. [DOI] [PubMed] [Google Scholar]
- 10.Fischer R, Longo F, Nielsen P, Engelhardt R, Hider RC, Piga A. Monitoring long-term efficacy of iron chelation therapy by deferiprone and desferrioxamine in patients with β-thalassaemia major: application of SQUID biomagnetic liver susceptometry. Br J Haematol. 2003;121:938–948. doi: 10.1046/j.1365-2141.2003.04297.x. [DOI] [PubMed] [Google Scholar]
- 11.Fischer R, Tiemann CD, Engelhardt R, Nielsen P, Durken M, Gabbe EE, Janka GE. Assessment of iron stores in children with transfusion siderosis by biomagnetic liver susceptometry. Am J Hematol. 1999;60:289–299. doi: 10.1002/(sici)1096-8652(199904)60:4<289::aid-ajh7>3.0.co;2-w. [DOI] [PubMed] [Google Scholar]
- 12.Nielsen P, Fischer R, Engelhardt R, Tondury P, Gabbe EE, Janka GE. Liver iron stores in patients with secondary haemosiderosis under iron chelation therapy with deferoxamine or deferiprone. Br J Haematol. 1995;91:827–833. doi: 10.1111/j.1365-2141.1995.tb05396.x. [DOI] [PubMed] [Google Scholar]
- 13.Sirlin CB, Reeder SB. Magnetic resonance imaging quantification of liver iron. Magn Reson Imaging Clin N Am. 2010;18:359–81, ix. doi: 10.1016/j.mric.2010.08.014. [DOI] [PMC free article] [PubMed] [Google Scholar]
- 14.Gandon Y, Olivie D, Guyader D, Aube C, Oberti F, Sebille V, Deugnier Y. Non-invasive assessment of hepatic iron stores by MRI. Lancet. 2004;363:357–362. doi: 10.1016/S0140-6736(04)15436-6. [DOI] [PubMed] [Google Scholar]
- 15.St Pierre TG, Clark PR, Chua-anusorn W. Single spin-echo proton transverse relaxometry of iron-loaded liver. NMR Biomed. 2004;17:446–458. doi: 10.1002/nbm.905. [DOI] [PubMed] [Google Scholar]
- 16.St Pierre TG, Clark PR, Chua-anusorn W, Fleming AJ, Jeffrey GP, Olynyk JK, Pootrakul P, Robins E, Lindeman R. Noninvasive measurement and imaging of liver iron concentrations using proton magnetic resonance. Blood. 2005;105:855–861. doi: 10.1182/blood-2004-01-0177. [DOI] [PubMed] [Google Scholar]
- 17.Wood JC, Enriquez C, Ghugre N, Tyzka JM, Carson S, Nelson MD, Coates TD. MRI R2 and R2* mapping accurately estimates hepatic iron concentration in transfusion-dependent thalassemia and sickle cell disease patients. Blood. 2005;106:1460–1465. doi: 10.1182/blood-2004-10-3982. [DOI] [PMC free article] [PubMed] [Google Scholar]
- 18.Wood JC, Ghugre N. Magnetic resonance imaging assessment of excess iron in thalassemia, sickle cell disease and other iron overload diseases. Hemoglobin. 2008;32:85–96. doi: 10.1080/03630260701699912. [DOI] [PMC free article] [PubMed] [Google Scholar]
- 19.Bonkovsky HL, Rubin RB, Cable EE, Davidoff A, Rijcken TH, Stark DD. Hepatic iron concentration: noninvasive estimation by means of MR imaging techniques. Radiology. 1999;212:227–234. doi: 10.1148/radiology.212.1.r99jl35227. [DOI] [PubMed] [Google Scholar]
- 20.Anderson LJ, Holden S, Davis B, et al. Cardiovascular T2-star (T2*) magnetic resonance for the early diagnosis of myocardial iron overload. Eur Heart J. 2001;22:2171–2179. doi: 10.1053/euhj.2001.2822. [DOI] [PubMed] [Google Scholar]
- 21.Hankins JS, McCarville MB, Loeffler RB, Smeltzer MP, Onciu M, Hoffer FA, Li CS, Wang WC, Ware RE, Hillenbrand CM. R2* magnetic resonance imaging of the liver in patients with iron overload. Blood. 2009;113:4853–4855. doi: 10.1182/blood-2008-12-191643. [DOI] [PMC free article] [PubMed] [Google Scholar]
- 22.Garbowski MW, Carpenter J-P, Smith G, Pennell DJ, Porter JB. Blood. 2009;114 abst 2004. [Google Scholar]
- 23.Christoforidis A, Perifanis V, Spanos G, Vlachaki E, Economou M, Tsatra I, Athanassiou-Metaxa M. MRI assessment of liver iron content in thalassamic patients with three different protocols: comparisons and correlations. Eur J Haematol. 2009;82:388–392. doi: 10.1111/j.1600-0609.2009.01223.x. [DOI] [PubMed] [Google Scholar]
- 24.Olivieri NF, Brittenham GM. Iron-chelating therapy and the treatment of thalassemia. Blood. 1997;89:739–761. [PubMed] [Google Scholar]
- 25.Taher A, El-Beshlawy A, Elalfy MS, Al ZK, Daar S, Habr D, Kriemler-Krahn U, Hmissi A, Al Jefri A. Efficacy and safety of deferasirox, an oral iron chelator, in heavily iron-overloaded patients with β-thalassaemia: the ESCALATOR study. Eur J Haematol. 2009;82:458–465. doi: 10.1111/j.1600-0609.2009.01228.x. [DOI] [PMC free article] [PubMed] [Google Scholar]
- 26.Taher A, Elalfy MS, Al ZK, Daar S, Al JA, Habr D, Kriemler-Krahn U, El-Ali A, Roubert B, El-Beshlawy A. Importance of optimal dosing ≥30 mg/kg/d during deferasirox treatment: 2.7-year follow-up from the ESCALATOR study in patients with beta-thalassaemia. Eur J Haematol. 2011;87:355–365. doi: 10.1111/j.1600-0609.2011.01662.x. [DOI] [PMC free article] [PubMed] [Google Scholar]
- 27.Angelucci E, Brittenham GM, McLaren CE, Ripalti M, Baronciani D, Giardini C, Galimberti M, Polchi P, Lucarelli G. Hepatic iron concentration and total body iron stores in thalassemia major. N Engl J Med. 2000;343:327–331. doi: 10.1056/NEJM200008033430503. [DOI] [PubMed] [Google Scholar]
- 28.Soriano-Cubells MJ, Aparisi-Querada L. Rapid determination of copper, iron and zinc in liver biopsies. Atomic Spectrosc. 1984;5:217–222. [Google Scholar]
- 29.Ishak K, Baptista A, Bianchi L, Callea F, De Groote J, Gudat F, Denk H, Desmet V, Korb G, MacSween RN. Histological grading and staging of chronic hepatitis. J Hepatol. 1995;22:696–699. doi: 10.1016/0168-8278(95)80226-6. [DOI] [PubMed] [Google Scholar]
- 30.Bland JM, Altman DG. Measuring agreement in method comparison studies. Stat Methods Med Res. 1999;8:135–160. doi: 10.1177/096228029900800204. [DOI] [PubMed] [Google Scholar]
- 31.Clark PR, Chua-anusorn W, St Pierre TG. Proton transverse relaxation rate (R2) images of liver tissue; mapping local tissue iron concentrations with MRI [corrected] Magn Reson Med. 2003;49:572–575. doi: 10.1002/mrm.10378. [DOI] [PubMed] [Google Scholar]
- 32.Pavitt HL, Aydinok Y, El-Beshlawy A, Bayraktaroglu S, Ibrahim AS, Hamdy MM, Pang W, Sharples C, St Pierre TG. The effect of reducing repetition time TR on the measurement of liver R2 for the purpose of measuring liver iron concentration. Magn Reson Med. 2011;65:1346–1351. doi: 10.1002/mrm.22712. [DOI] [PubMed] [Google Scholar]
- 33.Wood JC, Aguilar M, Otto-Duessel M, Nick H, Nelson MD, Moats R. Influence of iron chelation on R1 and R2 calibration curves in gerbil liver and heart. Magn Reson Med. 2008;60:82–89. doi: 10.1002/mrm.21660. [DOI] [PMC free article] [PubMed] [Google Scholar]