

Abstract
Properties of human brain tissue change across the lifespan. Here we model these changes in the living human brain by combining quantitative MRI measurements of R1 (1/T1) with diffusion MRI and tractography (N=102, ages 7–85). The amount of R1 change during development differs between white matter fascicles, but in each fascicle the rate of development and decline are mirror symmetric; the rate of R1 development as the brain approaches maturity predicts the rate of R1 degeneration in aging. Quantitative measurements of macromolecule tissue volume (MTV) confirm that R1 is an accurate index of the growth of new brain tissue. In contrast to R1, diffusion development follows an asymmetric time-course with rapid childhood changes but a slow rate of decline in old age. Together, the time-courses of R1 and diffusion changes demonstrate that multiple biological processes drive changes in white matter tissue properties over the lifespan.
Keywords: quantitative magnetic resonance imaging (qMRI), R1, T1, diffusion weighted imaging (DWI), mean diffusivity, white matter, fascicle, myelin, development, aging, multiple sclerosis (MS)
Introduction
Over the past decade, it has become clear that white matter plays a critical role in nearly every aspect of cognitive development, healthy cognitive function, and cognitive decline in aging. Moreover, many psychiatric disorders – from autism to schizophrenia – are associated with white matter abnormalities 1,2. White matter tissue properties change over the lifespan and models of the biological principles underlying these changes are critical for understanding the process of brain maturation and for diagnosing abnormalities in the living human brain.
Advances in quantitative magnetic resonance imaging (qMRI) now make it possible to measure and model the biological properties of tissue in the living human brain. Each qMRI parameter is sensitive to different properties of the tissue 3–11. By combining the information from different types of qMRI measurements and known biophysical properties of different tissue types, it is possible to reason about changes in the biological composition of the tissue over the lifespan.
To date, most qMRI investigations of lifespan changes in white matter tissue structure have focused on diffusion-weighted magnetic resonance imaging (dMRI). Due to improvements in dMRI acquisitions and software, spatially-resolved measurements of specific white matter fascicles or tracts are now routine and there is a substantial literature documenting changes in white matter diffusion properties over the lifespan 12–17. From these measurements, retrogenesis has emerged as a widely discussed principle of brain development and aging 18–21.
Retrogenesis postulates that late maturing tissue is particularly vulnerable during aging and that tissue degeneration in the aging brain follows the reverse sequence of tissue maturation in the developing brain. This theory conceptualizes brain development like building a pyramid where the base is stabilized before additional layers are added. The top of the pyramid is the most vulnerable to aging-related decline while the base remains sturdy. Retrogenesis has not been formalized in a manner that makes specific quantitative predictions, and several distinct hypotheses are discussed under the principle of retrogenesis 17,21–23.
White matter is composed of many different types of tissue (e.g., myelin, astrocytes, microglia, etc.), and each tissue type might change with its own unique time-course 14,24. For example, myelinated axons might change in a manner that is consistent with the retrogenesis hypothesis, while glial tissue might not. Diffusion measurements are open to many biological interpretations 9,25,26, and there may be multiple, independent, biological processes active across the lifespan that cannot be separated with diffusion measurements alone.
R1 (1/T1), a measure of the longitudinal relaxation rate hydrogen protons in a magnetic field, is sensitive to the macromolecular composition of tissue and provides complementary information to measures of diffusion properties. In white matter R1 is primarily driven by variation in myelin content (~90%) 27. The significance of R1 for biological measurements has been recognized for decades 6,28,29, but fast, accurate and reliable measurement methods have only recently become available 7,30,31. Here we employ a novel quantitative R1 mapping procedure 7 in combination with dMRI and tractography to model the processes underlying changes in white matter tissue composition that occur between childhood and old-age.
Combining multiple measurement modalities makes it possible to dissociate multiple biological processes that progress independently over the lifespan. Consistent with the retrogenesis hypothesis, in each fascicle the rate of R1 development as the brain approaches maturity closely matches the rate of R1 degeneration in aging. Measurements of macromolecule tissue volume (MTV) confirm that R1 is an accurate index of tissue creation and loss. Unlike R1, diffusivity changes follow an asymmetric time-course revealing a second lifespan process that does not follow the principle of retrogensis. Finally, we show that these quantitative lifespan models of white matter tissue changes can be used to detect and quantify degeneration of specific fascicles in individual patients with degenerative disorders of the white matter (multiple sclerosis). Models of the processes underlying healthy white matter maturation will offer new insight into the coupling between biological and cognitive development and allow white matter abnormalities to be rapidly diagnosed and monitored.
Results
White matter tissue properties change in relation to age
We modeled changes in R1 relaxation (1/T1, seconds), MTV, mean diffusivity (diffusivity) and fractional anisotropy (FA) for 24 fascicles (tracts) based on cross-sectional measurements of 102 participants between the ages of 7 and 85 years. Each MRI parameter is sensitive to different tissue properties, and we use these measurements to examine biological principles of development and aging.
We begin by focusing on R1 changes over this 80-year period of the lifespan and then compare the R1 measurements to the MTV, diffusivity and FA measurements. The R1 value is affected first by the amount of tissue (macromolecules and lipid membranes) in a voxel: A voxel that is filled primarily with water will have a much smaller R1 value (longer T1) than a voxel that includes tissue. Second, the R1 value is affected by the type of tissue 28,29,32,33. Myelin, for example, has a particularly strong impact on R1 values 27 for two reasons. First, it is a particularly dense tissue, in the sense that there are more macromolecules and fewer water molecules in a volume filled with myelinated axons compared to a volume filled with cellular tissue 34. Second, myelin membrane has a high cholesterol and galactocerebroside content 35. These molecules facilitate the longitudinal relaxation of water protons 32,36.
There were significant changes in R1, MTV, diffusivity and FA between childhood, adulthood, and old age for all fascicles. The time-course of the changes varied among fascicles and among MRI parameters. The diffusivity and FA measurements replicate previous observations 13, and the R1 and MTV measurements provide novel insight into the biological principles of white matter development and aging.
Fascicles vary substantially in terms of their amount of lifespan R1 change. Figure 1 shows each fascicle, color-coded based on the amount of R1 lifespan change that can be modeled as a function of age (measured cross-sectionally). Some fascicles, such as the inferior longitudinal fasciculus (ILF), show substantial age related change in tissue composition as indexed by R1, while other fascicles, such as the corticospinal tract (CST) show more stable R1 values over the lifespan.
Figure 1. Fascicles vary in the amount of lifespan R1 change.

Twenty-four fascicles identified with the Automated Fiber Quantification software (AFQ) are shown for a 37-year-old male. In the top panel, the lateral aspect of the left hemisphere has been removed to view the white matter within the brain volume. In the bottom panel, the white matter fascicles are shown without the cortical surface. Each fascicle is colored based on the amount of change in R1 (R1 at peak minus R1 at age 8) over the lifespan (cross sectional); blue corresponds to less change and red to more change. The same fascicle colors are used throughout the manuscript. The bottom panel shows the magnitude of R1 change for each voxel in the brain (computed by registering each participant’s R1 map to a custum R1 template). The sharp differences between the development rates of adjacent tracts are clearly aparent in the corpus callosum (anterior vs. posterior) and temporooccipito white matter (ILF/IFOF vs. optic radiations (OR)).
The uniqueness of each fascicle’s R1 time-course can be appreciated by examining voxel-wise estimates of R1 change. There are sharp changes in development rates at the border of fascicles. For example R1 in the optic radiation is stable over the lifespan (blue) while the immediately adjacent ILF and inferior frontooccipital fasciculus (IFOF) change substantially (red). Even directly adjacent fiber tracts with different cortical destinations show very different developmental patterns. For example, within the corpus callosum the motor fibers (blue) are stable while fibers destined for the prefrontal cortex change considerably (yellow-red).
R1 development and aging are symmetric for each fascicle
We find that each tract has a signature R1 value that is consistent along its length for a subject (Supplementary Figure 1). While the R1 value along a tract is nearly constant, the mean R1 value of a tract often differs substantially from the R1 values of neighboring tracts in the same hemisphere (>10 SEM, p < 0.0001).
From childhood (7 years of age) to adulthood (~40 years of age), R1 increases significantly within all tracts, and the magnitude of change varies significantly among tracts (Figure 2). R1 values for each tract reach their peak, mature level between 30 and 50 years of age. The values then decline, returning to their 8-year-old levels between age 70 and 80. For every tract we evaluated, the R1 growth curves are well fit by a symmetric curve such as a second order polynomial (parabola) over the measured 80-year period of the lifespan. This implies that the rate of growth and decline are symmetric during a period of the lifespan lasting from the beginning of elementary school through senescence. As R1 is sensitive to the creation of new tissue, particularly myelin 27, the R1 data are consistent with the idea that the rate of tissue loss during brain aging mirrors the rate of tissue creation between childhood and early adulthood.
Figure 2. R1 lifespan curves demonstrating each fascicle’s pattern of maturation and degeneration.

R1 lifespan curves are shown for each of the 24 fascicles, ordered based on the amount of change in R1 over the lifespan. The width of the line denotes the 95% confidence interval around the second order polynomial model fit. There is a highly significant developmental increase and aging decline in R1 values for all fascicles. The age of peak R1 (+/− 95% confidence interval) is shown by a bar at the bottom of each plot. The R1 values for each individual do not depend on the specific dMRI acquisition used to define the tracts: R1 values are highly consistent when an individual’s tracts are defined using a low b-value (1000 m/s2) or high b-value (2000 m/s2) acquision (R2 = 0.93);
Tracts differ substantially both in their mature R1 values as well as the magnitude of R1 changes over the lifespan. For example, the mature R1 values of the anterior thalamic radiations (ATR) and corticospinal tract (CST) are equivalent to the childhood/old-age R1 values of the cingulum, arcuate fasciculus, superior longitudinal fasciculus (SLF) and inferior longitudinal fasciculus (ILF). Moreover, the developmental increase and age-related decline in R1 for the cingulum and ILF are nearly double that of the CST and ATR. The uncinate fasciculus has a substantially lower R1 value than all other tracts yet also shows a particularly large increase in R1 during development and decline in R1 during aging.
Fascicles differ in the axon caliber distribution, myelination and packing density, and these properties influence information transmission and cortical computation 37,38. Variations in mature R1 levels between fascicles reflect differences in the tissue composition. Beyond the mean differences between these fascicles, there is variation in the amount of R1 change each fascicle undergoes over the lifespan.
Changes in macromolecule tissue volume predict changes in R1
To better understand the biological underpinnings of the R1 signal we model the relationship between developmental changes in R1 and changes in macromolecule volume within each fascicle. Maps of macromolecule tissue volume fraction (MTV) were computed for each subject using a revised version of the method described in Mezer et al., (2013)7. It has been suggested that in brain tissue, R1 is principally sensitive to the volume fraction of tissue (macromolecules and lipid membranes) versus water filling the voxel 6,7,33. Creation of new non-water tissue (i.e. MTV) within a voxel should cause a predictable increase in the voxel’s R1.
The amount of R1 development was calculated for each fascicle as the difference in R1 at 10 years of age versus adulthood (peak R1 between 40 and 50 years of age). To test the relationship between R1 changes and MTV changes we used a model 7,27,33 to predict the amount of MTV change for each fascicle based on the measurements of R1 change:
| (1) |
The measurements of MTV change closely matched the R1-based predictions of MTV change (R2 = 0.90), confirming that over development, new tissue is the principle mechanism underlying changes in R1 (Figure 3).
Figure 3. R1 changes are principally driven by the creation of new tisue during development.

MTV change can be predicted based on the R1 measurements (x-axis) and this prediction closely matches the MTV measurements (y-axis). Each point shows the magnitude of change (+/− 1 standard error) between age 10 and maturity (peak) for each fascicle (fascicle colors correspond to Figures 1 and 2).
Diffusivity changes more in development than in aging
Replicating previous reports, mean diffusivity declines rapidly between childhood and adulthood, but then shows a slow and steady increase beginning in the late 30s and 40s 13 (Supplementary Figure 2). The diffusivity data are not well fit by a symmetric model such as a second order polynomial because the rate of change in development is much more rapid than the change in aging. A Poisson curve captures this asymmetry 13. Unlike R1 values, diffusivity values at age 80 do not return to their 8-year-old level.
Diffusivity development rates also vary among tracts. For example, the superior longitudinal fasciculus (SLF) and cingulum show significantly more lifespan change than the CST. This observation is consistent with previous reports 13.
Within each tract the diffusivity and R1 lifespan curves differ substantially from each other (Figure 4a). Hence, these two parameters measure different biological processes in the white matter. There is only a weak relationship between the amount of change in R1 and diffusivity for a tract (r = 0.39, p = 0.06). For example, the R1 values in the ILF change considerably more (150%) than the R1 values in the SLF. Yet, there is no difference in their lifespan diffusivity changes. In a separate example, diffusivity in the left SLF changes much more (50%) than in the left CST. Yet there is no difference in their lifespan R1 changes.
Figure 4. Developmental processes driving R1 and diffusivity development are independent.

(a) Each point shows the magnitude of R1 and diffusivity change during development. The R1 changes are not well predicted by the diffusivity change. For example the inferior longitudinal fasciculus (ILF) shows significantly more R1 change than the superior longitudinal fasciculus (SLF) (p < 0.01) but they show the same amount of diffusivity change. (b) A tract’s mature R1 value is not well predicted by its mature diffusivity value. This observation highlights that each measure is sensitive to different properties of the tissue. Each point shows a tract’s mean (+/− 1 standard error) R1 and diffusivity value during adulthood. (c) R1 and diffusivity curves were standardized and plotted on the same normalized axis to show the similarities and differences between these measures over the lifespan (the diffusivity curve was also inverted to make comparison easier). Diffusivity grows more rapidly and declines more slowly than R1. The diffusivity lifespan curve is asymmetric for every fascicle and for each fascicle the shape of the diffusivity lifespan curve differs systematically from the R1 lifespan curve.
Furthermore a tract’s mature diffusivity level is not well predicted by its mature R1 level. For example, at maturity the CST has the lowest diffusivity value of all the tracts yet its mature R1 level is not comparatively high or low (Figure 4b). Hence the two measurements capture different properties of the axons and glia that compose a fascicle.
Multiple processes govern white matter development and aging
Two observations support the assertion that there are multiple, independent, biological processes governing age related changes in white matter tissue properties and that quantitative MRI is sensitive to these processes. First, the amount of change in R1 is independent of the amount of change in diffusivity. A large change in R1-sensitive tissue is not linked to a large change in diffusivity-sensitive tissue (Figure 4a). Second, the two measures follow different lifespan functions (Parabola vs. Poisson) (Figure 4c).
To understand the extent of the relationship between R1 and diffusivity, we used a polynomial model to predict R1 from diffusivity for each tract. On average, diffusivity predicts 25% of the variance in R1 values (95% confidence interval (CI) = 19% – 30%). Consider the residual errors in this model (i.e., the variance in R1 that is not predicted by diffusivity or ΔR1). If lifespan changes in R1 and diffusivity arise from the same biological processes, there should be no relationship between ΔR1 and age. But in fact, age predicts a significant amount (on average 10%) of the ΔR1 variation (p < 0.01, 95% CI = 8% – 12% variance explained). This highlights (1) that each parameter is weighted to be sensitive to different properties of the tissue, and (2) different tissue properties evolve independently over the lifespan. There are similarities between the measures, but knowing the amount and timing of change in diffusivity for a tract only weakly predicts the change in R1 (Figure 4a).
The similarities and differences between R1 and diffusivity can be appreciated by plotting the mean lifespan curve for each parameter on the same graph (Figure 4c). The measurements for all 24 fascicles are summarized with a local regression model. The local regression model can assume any smooth shape and is an non-parametric way to compare the shape of lifespan curves for different parameters. Interestingly both curves develop until they peak at an age of 33 years, remain stable for ~10 years, and then reverse their direction with aging. However the rate of diffusivity growth is steeper than the rate of R1 growth while the rate of diffusivity decline is shallower. While R1 shows a symmetric shape, with an equivalent value in childhood and senescence, diffusivity values do not return to their childhood levels. The difference in the preferred models for the different qMRI measures supports the hypothesis that multiple active biological processes drive changes in the white matter.
Less lifespan change in FA compared to R1 or diffusivity
The R1 and diffusivity values changed substantially and systematically over the lifespan: 25–45% of the variation in the measurements for a tract is predicted as a function of age. Over the lifespan mean tract FA changes are smaller, and on average only 10% of the variation in FA values across subjects are accounted for by age (for any model in either the b=2000 or the b=1000 data sets).
FA values are determined in significant measure by the distribution of axon orientations within a voxel (coherence) 25,26,39, and this feature of the white matter may be stable across the ages we measured. There is a lot of variability of the FA along each tract, and this variation is far larger than the age related FA changes (Supplementary Figure 1). The observed FA variation along each tract was equivalent for the low b-value and high b-value data sets. Hence, tracts do not have a signature FA value that is consistent along the tract length 39. Analyses of FA development should model the biological processes driving FA change at specific locations along the tract.
Evaluation of Retrogenesis
The principle of retrogenesis is widely discussed in the literature 18–21 but it has not been formalized into a mathematical model and evaluated with respect to lifespan measurements. Hence there are multiple, dissociable, hypotheses that are consistent with the principle of retrogenesis. The “gain-predicts-loss” hypothesis proposes that the rate of change is mirror-symmetric in development and aging: The more that is gained before the peak, the more that will be lost after the peak. The “last-in-first-out” hypothesis states that the last regions to develop are the first to decline. This hypothesis predicts that the age at which development ends is negatively correlated with the age at which degeneration begins: Early development predicts a long period of stability and a late decline. These two ideas are related, however the gain-loss prediction is about the symmetry of the curve on either side of maturity, and the last-in-first-out prediction concerns the relative timing of a region reaching its mature state and the region beginning to degenerate.
To quantitatively evaluate the fit of these lifespan hypotheses to white matter changes between the ages of 7 and 85, we fit the measurements from each tract to four different models (see Methods and Supplementary Figure 3). One model is a simple parabola (second order polynomial) that captures the idea of gain-predicts-loss. The second model comprises multiple linear segments joined at hinges (piecewise linear); this model tests the hypothesis that the timing of development and decline are correlated (last-in-first-out). The third model is a Poisson curve that, in contrast to the parabola, has an asymmetric rise and decline. Finally, a local regression model makes no assumptions about the lifespan data and serves to capture any systematic deviations of the data from the model predictions.
We evaluate the accuracy of each model using leave-one-out cross validation. Cross-validated estimates of model accuracy (R2) will decrease when an unnecessary parameter is included in a model (over fitting). Hence, the cross-validated estimates of R2 can compare the accuracy of these different models.
Consistency of R1 with the gain-predicts-loss hypothesis
We tested the gain-predicts-loss hypothesis by fitting a second order polynomial (parabola) to the lifespan measurements (Figure 5a). The parabola fit the R1 data for each tract as well or better than the more complex models (median R2 = 24%). Each tract matures at the same rate that it declines and a tract’s R1 values are identical when measured at symmetric ages around the peak of the curve (Figure 5bc).
Figure 5. R1 maturation and degeneration have symmetric slopes.
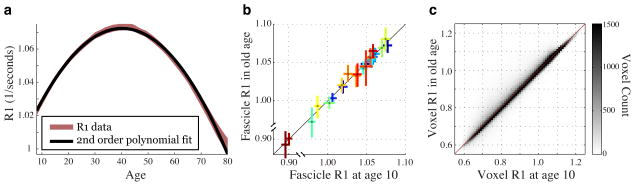
(a) Mean lifespan R1 curve (red) combining the data from all tracts is superiposed on the prediction of the second order polynomial model (black). The mean curve was calculated by fitting a local regression model to the data for all the tracts; the width of the colored line corresponds to the standard error of the model. For R1, there is no systematic difference between the data and the prediction of the symmetric parabola. For every age the model prediction is within 1 standard error of the measurement (diffusivity shown in Supplementary Figure 4). (b) The symmetry of change in R1 over the lifespan can be apreciated by plotting the R1 value in childhood and senescence for each individual tract. The age of peak R1 was calculated and values are plotted at age 10 and at a symmetric number of years past the peak (senescence). In senescence R1 values return to the same level they were in childhood. For diffusivity the values do not return to their childhood level (Supplementary Figure 4b). (c) R1 changes over the lifespan are symmetric for most voxels in the brain. Each particpant’s R1 map was aligned to a custom, R1 template and the voxel R1 value was calculated at age 10 and a symmetric number of years past that voxels peak. The childhood and old-age R1 values are closely matched for each white matter voxel (R2 = 0.70)
The additional flexibility in the piecewise linear model (median R2 = 23%) and local regression (median R2=23%) model are not useful for describing R1 over the measured 80 years of the lifespan because the rate of rise and decline in R1 are equal. The additional flexibility in those models fits the noise (over-fits) and increases the cross-validated error. The R1 curves are consistent with the “gain-predicts-loss” principal of white matter development and aging. Tracts with large R1 gains during childhood show large R1 declines during aging and tracts with minimal R1 gains do not show substantial aging related degeneration. Measured by R1, the aging process (ages 50–85) resembles the development process in reverse (ages 7–50).
Diffusivity reveals differences between development and aging
Measured by diffusivity, the aging process is not just the reverse of development. The R1 data adheres to the prediction of the gain-predicts-loss model, but the diffusivity data does not. The slope of diffusivity development is significantly steeper than the slope of aging (p < 0.001, tested with the piecewise linear model) and a parabola is unable to capture the asymmetry of diffusivity change on either side of the peak (Supplementary Figure 4).
A Poisson curve captures the asymmetric change 13 and fits the diffusivity measurements better than all other models (p<0.001, median R2 = 42%). For diffusivity the local regression and piecewise linear models also fit the measurements better than the parabola (p< 0.001), but not as well as the Poisson curve (p < 0.001). Unlike R1, the rate of change of diffusivity differs between development and aging.
Last-in-first-out hypothesis doesn’t predict R1 or diffusion
The data do not support the last-in-first-out hypothesis: The age at which a tract reaches maturity does not predict the age at which it begins to decline. Figure 6 shows a scatter plot of the two transition point parameters of the three segment, piecewise linear model. The last-in-first-out hypothesis predicts a negative correlation between these two parameters such that earlier maturation predicts later aging. For R1 there was a weak positive correlation (r = 0.43, p =0.04), which is contrary to the prediction of the last-in-first-out hypothesis. There is no significant correlation for diffusivity (r = −0.18, p = 0.38) or FA (r = −0.13, p = 0.52). If there is a link between the time a tract reaches maturity and the time it begins to decline, the effect is small.
Figure 6. The last in first out hypothesis does not match the R1 or diffusivity measurements.

The last-in-first-out hypothesis predicts that fascicles which reach maturity later begin declining earlier. A piecewise linear model independently fits the slope and timing of maturation and aging and can test this hypothesis. (a) The left panel shows a series of hypothetical piecewise linear models that are consistent with the last-in-first-out hypothesis. In each hypothetical tract lifespan curve, the age that the MRI parameter reaches its mature value is negatively correlated with the age it begins to decline. (b,c) The right two panels show the age of maturity (x-axis) plotted against age of decline (y-axis) as determined from the piecewise linear model of (b) R1 and (c) diffusivity measuremetns. The data are not consistent with the last-in-first-out hypothesis: There is no systematic relationship between the age at which a tract matures and the age it begins to decline.
From quantitative models to individual diagnosis
R1 is a quantitative measure of tissue at a given field strength (e.g., 3T) meaning that R1 values are independent of the specific scanner hardware 7,31,40. Hence, a model of R1 growth and decline can be used as norms for clinical and scientific comparisons across institutions.
To confirm that our R1 measurements are truly quantitative and do not depend on the specific hardware that is used to measure the brain, we performed three control experiments. First, we compare fascicle R1 values for the same individual measured in separate sessions with two different head coils (a custom made Nova 32-channel coil versus a stock GE 8-channel coil) and find that the R1 values are highly stable (Figure 7a, R2 = 0.95). Second, we compare R1 measurements acquired at 1mm3 resolution on a GE 3T scanner at Stanford University versus R1 measurements for the same individual measured at 2mm3 on a Siemens 3T scanner at Jerusalem University. The Siemens measurements are noisier because the sequence was optimized for the GE scanner: this can be improved. But importantly, even with the differences in pulse sequences, there was no systematic difference between the two measurements (i.e., bias) (Figure 7b, R2 = 0.79). Finally we quantify the robustness of the measurements to head motion by measuring the same individual twice on the same scanner, first with minimal head motion, and second with moderate head motion. The moderate head motion caused characteristic artifacts in the raw images (e.g., ripples) but did not induce any systematic bias to the R1 measurements (Figure 7c, R2 = 0.98).
Figure 7. R1 measurements are reliable across differences in scanner hardware and body movemets.
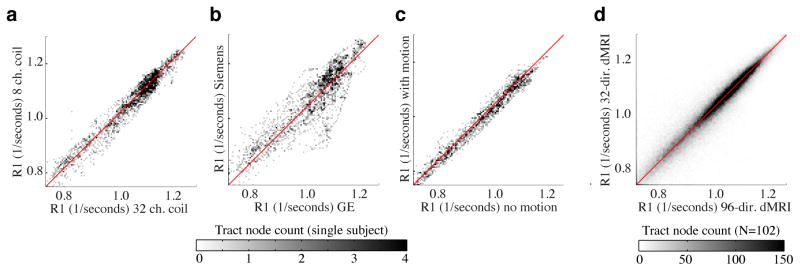
(a) R1 values sampled along the length of the 24 fiber tracts within an individual scanned using two different head coils, (b) two scanner vendors (GE vs. Siemens) and (c) mimimal versus moderate head motion. (d) R1 values sampled along fiber tracts estimated from a 96-direction, b=2000 dMRI acquisition and a 30-direction, b=1000 dMRI acquisition (N=102). AFQ reliably estimates the same fibers in both acquisitions, and the fascicle R1 values are consistent.
The stability of the R1 measurements across different hardware, pulse sequence, image resolution and subject motion, mean that the normative model of healthy R1 development can be used to detect and quantify tissue loss in individual patients with degenerative diseases of the white matter including multiple sclerosis (MS) (Figure 8). Each individual with MS (N=10) has regions of the white matter that are substantially different from the model prediction (> 3 standard deviations). These highly abnormal regions correspond to MS lesions. To test the specificity of this approach, a group of healthy, age-matched participants was held out of the model construction and compared to the normative model. The healthy participants did not have regions of highly abnormal R1 values (Figure 8c, black curve). The median R1 value across all white matter voxels for each individual with MS is also below the mean for his or her age (Figure 8c, blue tick marks); this effect is significant for the group (p < 0.001).
Figure 8. Automated diagnosis and quantification of white matter lesions based on R1 lifespan curves.
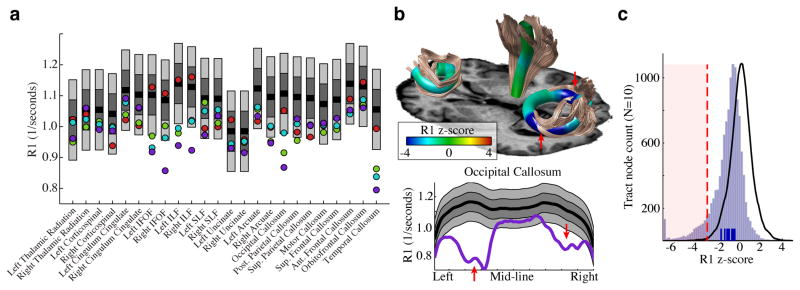
(a) Four patients with multiple sclerosis (43–45 years of age) are compared to age-matched norms based on the model of R1 development (See Figure 2). The gray bands show 1 and 2 standard deviation intervals around the mean for 44-year olds on each tract. The mean R1 values for tracts with demyelinating MS lesions are substantially below the healthy R1 values (> 3 standard deviations) but even the normal appearing white matter has slighly lower R1 values than average. (b) Comparing individual patient data with a group localizes lesions and quantifies tissue loss. The tracts are from one patient (purple) who has large lesions in occipital callosal fibers in both hemispheres. (c) A simple threshold identifies locations with substantial tissue loss. Ten age-matched, control subjects were left out of the curve-fitting procedure and for each location on the tracts we compared the R1 value to the norm for the relevant position (black line). For the healthy controls, very few locations on any tract exceed a 3-standard deviation threshold, highlighting the specificity of the R1 comparison. The same analysis was applied to the MS patients (N=10, light blue histogram). These patients have many locations where R1 values are more than 3 standard deviations below the age-matched norms. Each patient’s median R1 white-matter value (blue tick marks) is also below the norms.
Discussion
We combined quantitative MRI measurements of R1 with dMRI and tractography to model white matter development and aging over an 80-year period of the lifespan. Developmental processes create new tissue that displaces water, leading to higher R1, MTV and FA and lower diffusivity within the white matter. The R1 decline with aging is mirror-symmetric with the R1 increase during development. We confirm that for each fascicle, R1 changes are tightly coupled to changes in macromolecular tissue volume (MTV). In the white matter a majority of the macromolecules are contained in myelin membrane 34. The symmetry of the R1 changes during development and aging might be explained if the tissue created late in childhood is equal to the tissue lost during aging.
Unlike R1, the diffusivity change during aging is substantially slower than the diffusivity change during childhood. Even though tissue is lost during aging, the elderly brain does not revert back to the biology of a child’s brain. There are multiple active lifespan processes and not all of them are symmetric. This observation is supported by histology in aging macaques, showing that axons and myelin are lost but the continued creation of new astrocytes, microglia and oligodendrocytes fill the empty space 41,42.
We used the qMRI measurements to test three quantitative hypotheses regarding the biological principles of white matter development and aging. Evidence supports the gain-predicts-loss (Figure 5) and multiple-biological-process hypotheses (Figure 4), but the lifespan curves for R1, diffusivity and FA contradict the last-in-first-out hypothesis (Figure 6). These models concern changes in brain tissue as the brain approaches maturity and begins to decline, and there are certainly additional processes that drive in utero 43 and infant white matter development 5. The rapid changes that occur in utero and during infant development might be discontinuous with the changes measured between childhood and 85 years of age. By extending the measured age range, future work can confirm whether the symmetry of the curves extends from infancy through the end of life or if additional, independent mechanisms drive white matter changes at the beginning and end of life.
These observations highlight two important points. First, it is unlikely that a single model characterizes changes in the myriad of cell types in the brain. There is value, then, in using multiple qMRI measurements that are sensitive to different tissue properties. Second, formalizing ideas such as “retrogensis” into a computational framework is essential for determining whether it is a suitable principle to characterize brain development. The concept of retrogensis formalized as a symmetric curve accurately predicts changes in R1 over the lifespan while retrogensis formalized under the last-in-first-out model does not fit the data.
A major goal of human neuroscience is to understand the cellular processes in the living human brain that drive changes in cognitive function over the lifespan. There is an extensive literature linking the biophysics of macromolecules composing brain tissue to MR properties such as R1, MTV and diffusivity. These qMRI measurements offer a unique opportunity to bridge the gap between cognitive, systems and cellular neuroscience.
Before discussing how qMRI measurements further our understanding of the neurobiology of development and aging, it is useful to consider what is already known from invasive studies employing animal models and post mortem histology. Beginning in the late prenatal period and continuing through childhood and young adulthood, axons grow in caliber and oligodendrocytes wrap myelin around these axons 44. With each additional wrap of myelin, the outer diameter of the axon increases. This additional tissue provides a barrier to the diffusion process and reduces the overall water content of the tract (which also affects R1) as macromolecules fill the space that was once occupied by water molecules. Even though a substantial number of underused axons are removed (pruning) during development to free space for the growth of pertinent axons 45,46, overall there is an increase in macromolecule content and a decrease in water content as a child’s brain approaches maturity 47.
The myelination process is determined both by intrinsic genetic codes and extrinsic environmental factors 44,48. The level of electrical activity of an axon influences myelination, meaning that the myelination process is modified through experience 48,49. Myelination speeds signal conduction between distant cortical regions and together the distribution of myelin and axon caliber in a pathway determines the rate, quantity and nature of signals that a pathway transmits 37,38,50.
There is a period of relative stability before the white matter once again undergoes substantial changes due to aging processes. Even though the number of neurons in the cortex remains relatively constant, axons in the white matter begin to degenerate 51. Sandell and Peters (2001) demonstrate that the packing density of axons in the macaque optic nerve declines from an average of 28.85/100μm2 in mature monkeys to 17.18/100μm2 in old monkeys 41. The degeneration of axons appears to be coupled with degeneration of their myelin sheaths: there is as much as a 5-fold increase in the number of microglia in aging fascicles and many microglia are engorged with phagocytosed myelin. Beyond the increase in the numbers of microglia, new oligodendrocytes develop from oligodendrocyte progenitor cells and the fanning astrocyte processes expand to fill many gaps left by the degenerating axons 42.
As the brain ages, some tissue degenerates but new tissue is also created leading to large-scale changes in the cellular composition of the white matter. The different mechanisms present in development and aging are reflected in the quantitative MR data. There is a rapid change in R1 and diffusivity during development, with a symmetric rapid decline in R1 over aging but slow, gradual change in diffusivity. One hypothesis that explains the pattern of results is this: glial tissue that is created in the aging brain has a substantially lower R1 value than the myelinated axons that are lost. Diffusivity changes less because glial membrane barriers effectively restrict water movement. Glial proliferation in the aging brain could explain why diffusivity does not decline as sharply as R1.
Myelin membrane is particularly rich in cholesterol and galactocerebroside 35,47. These two macromolecules have a particularly large impact on R1 relaxation rates of water molecules 32. Moreover, unlike other cell structure, myelin has many tightly wrapped membrane layers yielding particularly high density of macromolecules versus water molecules. R1 decreases roughly linearly with the volume of water molecules in a voxel 7,52,53. The lifespan data demonstrate that R1 changes can explain with great accuracy the MTV changes. Many studies suggest that R1 is a good index of myelin variation across brain regions 27,54–56; however any decrease in water content due to additional tissue in a voxel also increases R1. Moreover, biochemical processes that change the type of macromoles and ions affect R1 without affecting the MTV values. For this reason, both measurements contribute to our understanding of white matter maturation and degeneration.
R1 and diffusivity measurements differ substantially when comparing voxels packed with cells (gray matter) and those packed with myelinated axons (white matter). The diffusivity in gray and white matter are roughly equivalent suggesting that diffusion barriers are similar in both types of tissue. But the mean R1 in white matter is almost double the mean R1 in gray matter 7,57. In aging, R1 declines steeply but diffusivity only slowly. Hence, the data support the view that in aging there is degeneration of myelinated white matter axons and proliferation of glia.
What might cause the symmetry of the R1 lifespan curves? The link between R1 growth and R1 decline may reflect a general phenomenon regarding the link between plasticity and vulnerability of a brain region. Connections between gene expression across the lifespan are an important future step for understanding the molecular mechanisms that produce the circuit level changes we measure in the living human brain.
Guided by our observations in human, the same qMRI measures might be extended to rodent models to evaluate whether these species follow the same principles of white matter development as human. If the rodent proves to be an adequate model, they could be used to explore the molecular and genetic mechanisms that produce the symmetric R1 lifespan curves and to further validate the relationship between changes in specific tissue types and changes in MR parameters.
These data provide the first benchmark of R1 in the healthy brain across a large portion of the lifespan. Because the R1 data are quantitative, an individual scanned at any location in the world can be compared to the normative lifespan curves established in this study. We demonstrate the utility of these models for detection and quantification of MS lesions (Figure 8). This approach supports the goal of using qMRI to quantitatively monitor healthy development and aging or disease progression within an individual. While the current sample reported here is too small to characterize the normal variation in white matter tissue properties across demographic groups, we hope that data sharing across institutions will assist in obtaining larger, more diverse samples. These data could prove useful in the early identification, treatment and post-treatment monitoring of myelin abnormalities in the developing, mature and aging brain. Additional measurements are needed to understand how changes in myelin affect cortical computations and resulting behaviors.
Combining in vivo biological measurements with behavioral measurements will lead to models that explain the coupling between biological and cognitive development. Diffusion weighted imaging has demonstrated robust correlations between diffusion properties and behavior, driving an interest in the role of white matter in cognition but leaving the biology of these correlations a mystery 24. Combining diffusion tractography with measures of diffusivity and R1 is a step towards inferring the biological mechanisms that link white matter tissue to cognition.
Methods
Summary
We developed a novel quantitative magnetic resonance imaging (qMRI) protocol to measure changes in the tissue properties of 24 major white matter fascicles over the lifespan. The protocol included (1) a high angular resolution diffusion imaging (HARDI) sequence that was optimized for the identification of each fascicle and the quantification of each fascicle’s diffusion properties and (2) a novel technique to quantitatively map R1 (1/T1), the longitudinal relaxation rate of the MR signal, in each fascicle. We measured 102 subjects between the ages of 7 and 85 years.
The Automated Fiber Quantification (AFQ) software package was used to identify 24 major white matter fascicles from each individual’s diffusion data and map the qMRI measurements to these fascicles 39. The following sections describe the subjects, MRI protocol and data processing in detail. Example code and data is available at https://github.com/jyeatman/lifespan.
Subjects
The Stanford University Institutional Review Board approved all data collection procedures and each adult participant provided informed consent and each child participant assent with consent provided by their parent/guardian. The participants in the study were healthy volunteers recruited from the San Francisco Bay Area based on flyers, advertisements in local papers and school newsletters. All participants were screened for neurological, psychiatric and cognitive disorders. However subjects were not screened for disorders that are likely to occur later in life (e.g., hypertension). The age distribution of the sample purposefully included more subjects in the age bins that were expected to show the largest change in tissue properties and fewer subjects in the age bins that were expected to have stable tissue properties. There were 32 participants ages 7–12, 14 participants ages 13–18, 12 ages 19–29, 11 ages 30–39, 7 ages 40–49, 9 ages 50–59, 8 ages 60–69, 9 ages 70–85, for a total of 102 participants (51 female).
Diffusion weighted MRI acquisition and preprocessing
All dMRI data were collected on a General Electric Discovery 750 (General Electric Healthcare, Milwaukee, WI) equipped with a 32-channel head coil (Nova Medical, Wilmington, MA) at the Center for Cognitive and Neurobiological Imaging at Stanford University (www.cni.stanford.edu).
dMRI data were acquired using dual-spin echo diffusion-weighted sequences with full brain coverage. Diffusion weighting gradients were applied at 96 non-collinear directions across the surface of a sphere as determined by the electro-static repulsion algorithm 58. In all subjects, dMRI data were acquired at 2.0 mm3 spatial resolution and diffusion gradient strength was set to b=2000 s/mm2. We acquired 8 non-diffusion weighted b=0 images at the beginning of each measurement. A second, independent, dMRI dataset was acquired on each subject using a low b-value (b=1000 s/mm2) 30-direction acquisition.
Subjects’ motion was corrected using a rigid body alignment algorithm. Diffusion-gradients were adjusted to account for the rotation applied to the measurements during motion correction. The dual-spin echo sequence we used does not require performing eddy current correction because it has a relatively long delay between the RF excitation pulse and image acquisition. This allows sufficient time for the eddy currents to dephase. A tensor model was fit to each voxel’s data using the RESTORE algorithm which is designed to remove outliers from the fitting procedure and minimize the effects of pulsatility and motion related artifacts 59. Pre-processing was implemented in MATLAB (MathWorks, Natwick, MI) and are publically available as part of the vistasoft git repository (http://github.com/vistalab/vistasoft/mrDiffusion; see dtiInit.m).
Quantitative T1 mapping protocol
The R1 (1/T1) relaxation was measured from spoiled gradient echo (spoiled-GE) images acquired with different flip angles (á = 4°, 10°, 20°, 30°, TR = 14ms, TE = 2.4 ms). The scan resolution was 1 mm3. In addition to the 102 subjects measured on a GE scanner, one subject was also measured on a 3T Siemens scanner in Jerusalem.
The transmit coil inhomogeneity was corrected by comparing to R1 measured with an additional spin echo inversion recovery (SEIR) scan 7 that is free from transmit coil inhomogeneity 7,60. The SEIR was done with an EPI read-out, a slab inversion pulse and spectral spatial fat suppression. For the SEIR-EPI acquisition the TR was 3 sec; Echo time was set to minimum full; inversion times were 50, 400, 1200, 2400 msec. We used 2mm2 inplane resolution with a slice thickness of 4 mm. The EPI readout was performed using 2X acceleration to minimize spatial distortions. We used the ANTS software package to register the spoiled-GE images to match the SEIR-EPI image 61. The transmit-coil inhomogeneity was calculated by combining the un-biased SEIR R1 fits with the spoiled-GE data 7. We use the estimated transmit-coil inhomogeneity and the multi flip-angle spoiled-GE measurements to derive the R1 maps. These were calculated using a nonlinear least-squares fitting procedure to minimize the difference between the data and the spoiled-GE signal equation predictions 62. We release the R1 analysis pipeline as open-source MATLAB code (https://github.com/mezera/mrQ).
Quantification of white matter tissue properties
The Automated Fiber Quantification (AFQ) software package was used to identify each fiber tract and quantify Tract Profiles of tissue properties along the tract trajectory 39. There were a number of substantial additions and revisions to the AFQ software for the analyses reported here and like previous versions we release AFQ (v1.1) as open-source MATLAB code (https://github.com/jyeatman/AFQ). The major updates to the code are described here with additional details in the on-line revision history.
AFQ uses a three-step procedure to identify each of 24 fiber tracts in an individual’s brain. First, a tractography algorithm estimates a whole-brain connectome of fiber tracts. Deterministic streamlines tracking (STT) based on a tensor model is the default algorithm 63. Second, fiber tract segmentation is done with a 2 way-point region of interest (ROI) procedure in which each fiber from the whole-brain connectome becomes a candidate for a specific fiber group if it passes through two ROIs that define the trajectory of the fiber group 64. Third, fiber tract refinement is done by comparing each candidate fiber to a fiber tract probability map and removing each candidate that passes through regions of the white matter that are unlikely to be part of the tract 65. Finally, the tract is summarized by a curve that at the central position of all the tract fibers. The curve is created by defining 100 sample-points along each fiber and robustly computing the mean position of the corresponding sample points. The robust mean is computed by estimating the 3-dimensional Gaussian covariance of the sample points and removing fibers that are more than 5 standard deviations from the mean.
AFQ (v1.1) includes an additional tract cleaning procedure in which fibers with aberrant cortical endpoints are removed from the fiber group. This is achieved by warping the cortical labels from the MNI-AAL atlas 66 to an individual’s native space, and making sure each fiber in the group starts and ends within 4mm of its known cortical destination. This a priori knowledge of fiber endpoint is only imposed at a very course resolution as to not bias new discoveries that come with improved tractography algorithms (e.g., the arcuate spans from the lateral temporal to the lateral frontal lobe and the uncinate spans from the anterior temporal to the frontal lobe). Finally, each fiber in the group is flipped such that all fibers start and end in the same cortical zone and span the same direction (e.g., posterior to anterior). These revisions increase the accuracy of Tract Profiles that are calculated for the full trajectory of the fiber group, from the cortical start to the cortical termination, rather than confining the analysis to the portion of the tract spanning between the two defining ROIs.
AFQ (v1.1) includes 8 additional callosal fiber groups that were not included in the previous release: occipital, posterior parietal, superior parietal, motor, superior frontal, anterior frontal and orbitofrontal and temporal callosal projections. Two ROIs placed in homologous regions of each hemisphere are used to segment the 8 callosal fiber groups (as described in 67). The occipital and posterior parietal ROIs are drawn on the coronal plane at the intersection of the calcarine and parietooccipital sulci. The boundary between these ROIs separate fibers destined for occipital and parietal cortices. The superior parietal, motor and superior frontal ROIs are drawn on the axial plane, superior to the corpus callosum, where the central sulcus has an omega (Ω) shape. The superior parietal ROI covers the posterior portion of this plane and goes as far anterior as the central sulcus. The motor ROI extends from the central sulcus to the precentral gyrus. The superior frontal ROI covers the anterior portion of the plane. The anterior frontal and orbitofrontal ROIs are drawn on the plane half way between the genu of the corpus callosum and the frontal pole. The orbitofrontal ROI covers the most inferior gyrus in this plane and the anterior frontal ROI covers the superior portion of this plane. The temporal ROI is draw in a coronal plane and covers the white matter adjacent to the posterior horn of the lateral ventricles know as the tapetum.
For these 8 callosal groups, the fiber tract refinement stage was not necessary. The anterior frontal and occipital callosal groups are highly overlapping with the forceps major and forceps minor fiber groups (included in AFQ v0.1). Hence, only the new callosal groups were used as in the current analysis making for 24 tracts in total.
Tissue properties are calculated along the trajectory of the fiber group by first resampling each fiber to 100 equally spaced nodes and then interpolating the value from a coregistered quantitative MRI image at each node along each fiber. The maps of scalar parameters from the dMRI data are already in register with the fiber tracts and do not require additional alignment. To coregister a subject’s quantitative R1 map to their dMRI data, we used the ANTS software package to warp the R1 map to match the non-diffusion weighted, B0 image 61. This warping procedure corrects differences in image rotation and translation as well as local stretching and compression of the dMRI data due to EPI distortions. EPI distortions were minimal due to the 2x ASSET acceleration used for the readout of the diffusion-weighted images but some regions of the white matter were misaligned by 2–4mm if a simple rigid body alignment was used. After applying the diffeomorphic warp, manual inspection of the aligned images confirmed that the registration was accurate within ~1 mm.
Tract Profiles of each parameter are calculated as a weighted sum of each fiber’s value at a given node where a fiber is weighted based on its Mahalanobis distance from the core of the tract. The result is a vector of 100 measurements of each MRI parameter sampled equidistantly along the trajectory of each fascicle. Tract Profiles can then be averaged to produce a single mean value for each tract or models can be fit at each point along the Tract Profile.
Voxel-wise analysis of R1 data
In addition to the analysis of fiber-tract R1 values, we also conducted a voxel-wise analysis of R1 development and aging. ANTS was used to build a custom R1 template from the collection of individual subject R1 maps (see the ANTS buildtemplateparallel.sh script). Then each model was fit voxel wise to characterize regional white matter development and aging.
Model fitting
We fit four classes of models to explain changes in tissue properties as a function of age (Supplementary Figure 3). Model accuracy was quantified using leave one out cross validation: The model was fit to the data leaving out one subject’s data point and then the model was used to predict this left out data point. This procedure is repeated for each subject and the difference between the model predictions and the measurements were used to calculate an unbiased estimate of the coefficient of determination (R2) using the following equation:
| (2) |
Where n is the number of measurements, y is the vector of measurements and ẏ is the vector of model predictions.
Model 1 was a second order polynomial (parabola) with following equation:
| (3) |
Where y is the vector of measurements and each wi is a weight that is estimated using ordinary least squares regression.
Model 2 was a 5-parameter piecewise linear model. The first two parameters are the intercept and slope of change over development. The third and fourth parameters are transition points, the first of which being the age when development ends and the next being the age at which aging begins. Maturity is defined as the time between the two transition points during which tissue properties remain relative constant. The fifth parameter is the slope of change during aging. The piecewise linear model was fit using the Levenberg-Marquardt algorithm with a least squares cost function. Due to local minimum, we did a grid search over starting parameters and the model with the lowest mean squared error was retained.
Model 3 was a Poisson curve with asymmetric rise and decline as described in 13 with the following equation:
Where each wi is a parameter estimated the Levenberg-Marquardt algorithm with a least squares cost function.
Model 4 was a local linear regression model in which each data point was predicted based on a linear fit that considered a local window of data centered on that point. The local regression model was fit using weighted least squares where each data point’s contribution to the fit was weighted based on its distance to the center of the window. We used a tricubic weighting function and a bandwidth of 20 years. The local regression model can assume any smooth shape and imposes very few constraints on the shape of a tract’s lifespan curve.
Parameter reliability was estimated with bootstrapping. Unless otherwise stated, the results throughout the paper use the median and bootstrapped confidence interval around the median to represent the central tendency and error of each estimate.
Supplementary Material
Acknowledgments
We thank Jenny Nguyen, Stephanie Phipps, Ryan Martin, Keith Main Le Hua and Netta Levin for assistance with data collection and Ariel Rokem, Franco Pestilli, Kevin Weiner and Nathan Withoft for comments on the manuscript. This work was funded by Weston Havens foundation grant to B.A.W., J.D.Y and A.M., NSF BCS1228397 and NIH EY015000 to B.A.W., Human Frontier science program to A.M.
Footnotes
Author Contributions: J.D.Y, B.A.W and A.M designed the experiment, analyzed the data and wrote the manuscript
The authors declare no competing financial interests.
References
- 1.Thomason ME, Thompson PM. Diffusion imaging, white matter, and psychopathology. Annu Rev Clin Psychol. 2011;7:63–85. doi: 10.1146/annurev-clinpsy-032210-104507. [DOI] [PubMed] [Google Scholar]
- 2.Fields RD. White matter in learning, cognition and psychiatric disorders. Trends Neurosci. 2008;31:361–70. doi: 10.1016/j.tins.2008.04.001. [DOI] [PMC free article] [PubMed] [Google Scholar]
- 3.Barazany D, Basser PJ, Assaf Y. In vivo measurement of axon diameter distribution in the corpus callosum of rat brain. Brain. 2009;132:1210–20. doi: 10.1093/brain/awp042. [DOI] [PMC free article] [PubMed] [Google Scholar]
- 4.Beaulieu C. The basis of anisotropic water diffusion in the nervous system - a technical review. NMR Biomed. 2002;15:435–55. doi: 10.1002/nbm.782. [DOI] [PubMed] [Google Scholar]
- 5.Deoni SCL, Dean DC, O’Muircheartaigh J, Dirks H, Jerskey B. Investigating white matter development in infancy and early childhood using myelin water faction and relaxation time mapping. Neuroimage. 2012;63:1038–53. doi: 10.1016/j.neuroimage.2012.07.037. [DOI] [PMC free article] [PubMed] [Google Scholar]
- 6.Tofts P. Quantitative MRI of the Brain: Measuring Changes Caused by Disease. Vol. 650. Wiley; 2003. [Google Scholar]
- 7.Mezer A, et al. Quantifying the local tissue volume and composition in individual brains with MRI. Nat Med. 2013;19:1667–72. doi: 10.1038/nm.3390. [DOI] [PMC free article] [PubMed] [Google Scholar]
- 8.Stikov N, et al. Bound pool fractions complement diffusion measures to describe white matter micro and macrostructure. Neuroimage. 2011;54:1112–21. doi: 10.1016/j.neuroimage.2010.08.068. [DOI] [PMC free article] [PubMed] [Google Scholar]
- 9.Mädler B, Drabycz SA, Kolind SH, Whittall KP, MacKay AL. Is diffusion anisotropy an accurate monitor of myelination? Correlation of multicomponent T2 relaxation and diffusion tensor anisotropy in human brain. Magn Reson Imaging. 2008;26:874–88. doi: 10.1016/j.mri.2008.01.047. [DOI] [PubMed] [Google Scholar]
- 10.Underhill HR, Yuan C, Yarnykh VL. Direct quantitative comparison between cross-relaxation imaging and diffusion tensor imaging of the human brain at 3.0 T. Neuroimage. 2009;47:1568–78. doi: 10.1016/j.neuroimage.2009.05.075. [DOI] [PubMed] [Google Scholar]
- 11.Flynn SW, et al. Abnormalities of myelination in schizophrenia detected in vivo with MRI, and post-mortem with analysis of oligodendrocyte proteins. Mol Psychiatry. 2003;8:811–20. doi: 10.1038/sj.mp.4001337. [DOI] [PubMed] [Google Scholar]
- 12.Hasan KM, et al. Quantification of the spatiotemporal microstructural organization of the human brain association, projection and commissural pathways across the lifespan using diffusion tensor tractography. Brain Struct Funct. 2010;214:361–73. doi: 10.1007/s00429-009-0238-0. [DOI] [PMC free article] [PubMed] [Google Scholar]
- 13.Lebel C, et al. Diffusion tensor imaging of white matter tract evolution over the lifespan. Neuroimage. 2012;60:340–52. doi: 10.1016/j.neuroimage.2011.11.094. [DOI] [PubMed] [Google Scholar]
- 14.Yeatman JD, Dougherty RF, Ben-Shachar M, Wandell BA. Development of white matter and reading skills. Proc Natl Acad Sci U S A. 2012;109:E3045–53. doi: 10.1073/pnas.1206792109. [DOI] [PMC free article] [PubMed] [Google Scholar]
- 15.Westlye LT, et al. Life-span changes of the human brain white matter: diffusion tensor imaging (DTI) and volumetry. Cereb Cortex. 2010;20:2055–68. doi: 10.1093/cercor/bhp280. [DOI] [PubMed] [Google Scholar]
- 16.Lebel C, Beaulieu C. Longitudinal development of human brain wiring continues from childhood into adulthood. J Neurosci. 2011;31:10937–47. doi: 10.1523/JNEUROSCI.5302-10.2011. [DOI] [PMC free article] [PubMed] [Google Scholar]
- 17.Madden DJ, et al. Diffusion tensor imaging of cerebral white matter integrity in cognitive aging. Biochim Biophys Acta. 2012;1822:386–400. doi: 10.1016/j.bbadis.2011.08.003. [DOI] [PMC free article] [PubMed] [Google Scholar]
- 18.Reisberg B, et al. Evidence and mechanisms of retrogenesis in Alzheimer’s and other dementias: management and treatment import. Am J Alzheimers Dis Other Demen. 17:202–12. doi: 10.1177/153331750201700411. [DOI] [PMC free article] [PubMed] [Google Scholar]
- 19.Gao J, et al. Possible retrogenesis observed with fiber tracking: an anteroposterior pattern of white matter disintegrity in normal aging and Alzheimer’s disease. J Alzheimers Dis. 2011;26:47–58. doi: 10.3233/JAD-2011-101788. [DOI] [PubMed] [Google Scholar]
- 20.Stricker NH, et al. Decreased white matter integrity in late-myelinating fiber pathways in Alzheimer’s disease supports retrogenesis. Neuroimage. 2009;45:10–16. doi: 10.1016/j.neuroimage.2008.11.027. [DOI] [PMC free article] [PubMed] [Google Scholar]
- 21.Brickman AM, et al. Testing the white matter retrogenesis hypothesis of cognitive aging. Neurobiol Aging. 2012;33:1699–715. doi: 10.1016/j.neurobiolaging.2011.06.001. [DOI] [PMC free article] [PubMed] [Google Scholar]
- 22.Raz N. In: Handb Aging Cogn. Craik F, Salthouse T, editors. Lawrence Erlbaum; 2000. [Google Scholar]
- 23.Davis SW, et al. Assessing the effects of age on long white matter tracts using diffusion tensor tractography. Neuroimage. 2009;46:530–41. doi: 10.1016/j.neuroimage.2009.01.068. [DOI] [PMC free article] [PubMed] [Google Scholar]
- 24.Wandell BA, Yeatman JD. Biological development of reading circuits. Curr Opin Neurobiol. 2013;23:261–8. doi: 10.1016/j.conb.2012.12.005. [DOI] [PMC free article] [PubMed] [Google Scholar]
- 25.Jeurissen B, Leemans A, Tournier J-D, Jones DK, Sijbers J. Investigating the prevalence of complex fiber configurations in white matter tissue with diffusion magnetic resonance imaging. Hum Brain Mapp. 2012 doi: 10.1002/hbm.22099. 000, n/a–n/a. [DOI] [PMC free article] [PubMed] [Google Scholar]
- 26.Jones DK, Knösche TR, Turner R. White matter integrity, fiber count, and other fallacies: the do’s and don’ts of diffusion MRI. Neuroimage. 2013;73:239–54. doi: 10.1016/j.neuroimage.2012.06.081. [DOI] [PubMed] [Google Scholar]
- 27.Stu_ber C, et al. Myelin and iron concentration in the human brain: A quantitative study of MRI contrast. Neuroimage. 2014 doi: 10.1016/j.neuroimage.2014.02.026. [DOI] [PubMed] [Google Scholar]
- 28.Bottomley PA, Foster TH, Argersinger RE, Pfeifer LM. A review of normal tissue hydrogen NMR relaxation times and relaxation mechanisms from 1–100 MHz: dependence on tissue type, NMR frequency, temperature, species, excision, and age. Med Phys. 1984;11:425–48. doi: 10.1118/1.595535. [DOI] [PubMed] [Google Scholar]
- 29.Mansfield P. NMR Imaging in Biomedicine: Supplement 2 Advances in Magnetic Resonance. Vol. 364. Elsevier; 1982. [Google Scholar]
- 30.Yarnykh VL. Optimal radiofrequency and gradient spoiling for improved accuracy of T1 and B1 measurements using fast steady-state techniques. Magn Reson Med. 2010;63:1610–26. doi: 10.1002/mrm.22394. [DOI] [PubMed] [Google Scholar]
- 31.Lutti A, Hutton C, Finsterbusch J, Helms G, Weiskopf N. Optimization and validation of methods for mapping of the radiofrequency transmit field at 3T. Magn Reson Med. 2010;64:229–38. doi: 10.1002/mrm.22421. [DOI] [PMC free article] [PubMed] [Google Scholar]
- 32.Kucharczyk W, Macdonald PM, Stanisz GJ, Henkelman RM. Relaxivity and magnetization transfer of white matter lipids at MR imaging: importance of cerebrosides and pH. Radiology. 1994;192:521–9. doi: 10.1148/radiology.192.2.8029426. [DOI] [PubMed] [Google Scholar]
- 33.Rooney WD, et al. Magnetic field and tissue dependencies of human brain longitudinal 1H2O relaxation in vivo. Magn Reson Med. 2007;57:308–18. doi: 10.1002/mrm.21122. [DOI] [PubMed] [Google Scholar]
- 34.Brien JSO, Sampson EL. Lipid composition of the normal human brain. J Lipid Res. 1965;6 [PubMed] [Google Scholar]
- 35.Coetzee T, et al. Myelination in the Absence of Galactocerebroside and Sulfatide: Normal Structure with Abnormal Function and Regional Instability. Cell. 1996;86:209–219. doi: 10.1016/s0092-8674(00)80093-8. [DOI] [PubMed] [Google Scholar]
- 36.Koenig SH, Brown RD, Spiller M, Lundbom N. Relaxometry of brain: why white matter appears bright in MRI. Magn Reson Med. 1990;14:482–95. doi: 10.1002/mrm.1910140306. [DOI] [PubMed] [Google Scholar]
- 37.Perge Ja, Koch K, Miller R, Sterling P, Balasubramanian V. How the optic nerve allocates space, energy capacity, and information. J Neurosci. 2009;29:7917–28. doi: 10.1523/JNEUROSCI.5200-08.2009. [DOI] [PMC free article] [PubMed] [Google Scholar]
- 38.Perge JA, Niven JE, Mugnaini E, Balasubramanian V, Sterling P. Why do axons differ in caliber? J Neurosci. 2012;32:626–38. doi: 10.1523/JNEUROSCI.4254-11.2012. [DOI] [PMC free article] [PubMed] [Google Scholar]
- 39.Yeatman JD, Dougherty RF, Myall NJ, Wandell Ba, Feldman HM. Tract profiles of white matter properties: automating fiber-tract quantification. PLoS One. 2012;7:e49790. doi: 10.1371/journal.pone.0049790. [DOI] [PMC free article] [PubMed] [Google Scholar]
- 40.Weiskopf N, et al. Quantitative multi-parameter mapping of R1, PD(*), MT, and R2(*) at 3T: a multi-center validation. Front Neurosci. 2013;7:95. doi: 10.3389/fnins.2013.00095. [DOI] [PMC free article] [PubMed] [Google Scholar]
- 41.Sandell JH, Peters a. Effects of age on nerve fibers in the rhesus monkey optic nerve. J Comp Neurol. 2001;429:541–53. doi: 10.1002/1096-9861(20010122)429:4<541::aid-cne3>3.0.co;2-5. [DOI] [PubMed] [Google Scholar]
- 42.Sandell J, Peters A. Effects of age on the glial cells in the rhesus monkey optic nerve. J Comp Neurol. 2002;28:13–28. doi: 10.1002/cne.10162. [DOI] [PubMed] [Google Scholar]
- 43.Kasprian G, et al. In utero tractography of fetal white matter development. Neuroimage. 2008;43:213–24. doi: 10.1016/j.neuroimage.2008.07.026. [DOI] [PubMed] [Google Scholar]
- 44.Emery B. Regulation of oligodendrocyte differentiation and myelination. Science (80-) 2010;330:779–82. doi: 10.1126/science.1190927. [DOI] [PubMed] [Google Scholar]
- 45.LaMantia AS, Rakic P. Axon overproduction and elimination in the corpus callosum of the developing rhesus monkey. J Neurosci. 1990;10:2156–75. doi: 10.1523/JNEUROSCI.10-07-02156.1990. [DOI] [PMC free article] [PubMed] [Google Scholar]
- 46.LaMantia AS, Rakic P. Axon overproduction and elimination in the anterior commissure of the developing rhesus monkey. J Comp Neurol. 1994;340:328–36. doi: 10.1002/cne.903400304. [DOI] [PubMed] [Google Scholar]
- 47.Dobbing J, Sands J. Quantitative growth and development of human brain. Arch Dis Child. 1973;48:757–767. doi: 10.1136/adc.48.10.757. [DOI] [PMC free article] [PubMed] [Google Scholar]
- 48.Barres B, Raff M. Proliferation of oligodendrocyte precursor cells depends on electrical activity in axons. Nature. 1993;361:258–260. doi: 10.1038/361258a0. [DOI] [PubMed] [Google Scholar]
- 49.Ishibashi T, et al. Astrocytes promote myelination in response to electrical impulses. Neuron. 2006;49:823–32. doi: 10.1016/j.neuron.2006.02.006. [DOI] [PMC free article] [PubMed] [Google Scholar]
- 50.Caminiti R, Ghaziri H, Galuske R, Hof PR, Innocenti GM. Evolution amplified processing with temporally dispersed slow neuronal connectivity in primates. Proc Natl Acad Sci U S A. 2009;106:19551–6. doi: 10.1073/pnas.0907655106. [DOI] [PMC free article] [PubMed] [Google Scholar]
- 51.Peters A. The effects of normal aging on myelin and nerve fibers: a review. J Neurocytol. 2003;31:581–93. doi: 10.1023/a:1025731309829. [DOI] [PubMed] [Google Scholar]
- 52.Fatouros PP, Marmarou a. Use of magnetic resonance imaging for in vivo measurements of water content in human brain: method and normal values. J Neurosurg. 1999;90:109–15. doi: 10.3171/jns.1999.90.1.0109. [DOI] [PubMed] [Google Scholar]
- 53.Gelman N, Ewing JR, Gorell JM, Spickler EM, Solomon EG. Interregional variation of longitudinal relaxation rates in human brain at 3.0 T: relation to estimated iron and water contents. Magn Reson Med. 2001;45:71–9. doi: 10.1002/1522-2594(200101)45:1<71::aid-mrm1011>3.0.co;2-2. [DOI] [PubMed] [Google Scholar]
- 54.Lutti A, Dick F, Sereno MI, Weiskopf N. Using high-resolution quantitative mapping of R1 as an index of cortical myelination. Neuroimage. 2013:1–13. doi: 10.1016/j.neuroimage.2013.06.005. [DOI] [PubMed] [Google Scholar]
- 55.Geyer S, Weiss M, Reimann K, Lohmann G, Turner R. Microstructural Parcellation of the Human Cerebral Cortex - From Brodmann’s Post-Mortem Map to in vivo Mapping with High-Field Magnetic Resonance Imaging. Front Hum Neurosci. 2011;5:19. doi: 10.3389/fnhum.2011.00019. [DOI] [PMC free article] [PubMed] [Google Scholar]
- 56.Sereno MI, Lutti A, Weiskopf N, Dick F. Mapping the human cortical surface by combining quantitative t1 with retinotopy. Cereb Cortex. 2013;23:2261–8. doi: 10.1093/cercor/bhs213. [DOI] [PMC free article] [PubMed] [Google Scholar]
- 57.Stanisz GJ, et al. T1, T2 relaxation and magnetization transfer in tissue at 3T. Magn Reson Med. 2005;54:507–12. doi: 10.1002/mrm.20605. [DOI] [PubMed] [Google Scholar]
- 58.Jones DK, Horsfield MA, Simmons A. Optimal strategies for measuring diffusion in anisotropic systems by magnetic resonance imaging. Magn Reson Med. 1999;42:515–25. [PubMed] [Google Scholar]
- 59.Chang LC, Jones DK, Pierpaoli C. RESTORE: robust estimation of tensors by outlier rejection. Magn Reson Med. 2005;53:1088–95. doi: 10.1002/mrm.20426. [DOI] [PubMed] [Google Scholar]
- 60.Barral JK, et al. A robust methodology for in vivo T1 mapping. Magn Reson Med. 2010;64:1057–67. doi: 10.1002/mrm.22497. [DOI] [PMC free article] [PubMed] [Google Scholar]
- 61.Avants B, Gee JC. Geodesic estimation for large deformation anatomical shape averaging and interpolation. Neuroimage. 2004;23:S139–50. doi: 10.1016/j.neuroimage.2004.07.010. [DOI] [PubMed] [Google Scholar]
- 62.Chang LC, Koay CG, Basser PJ, Pierpaoli C. Linear least-squares method for unbiased estimation of T1 from SPGR signals. Magn Reson Med. 2008;60:496–501. doi: 10.1002/mrm.21669. [DOI] [PMC free article] [PubMed] [Google Scholar]
- 63.Basser PJ, Pajevic S, Pierpaoli C, Duda J, Aldroubi A. In vivo fiber tractography using DT-MRI data. Magn Reson Med. 2000;44:625–32. doi: 10.1002/1522-2594(200010)44:4<625::aid-mrm17>3.0.co;2-o. [DOI] [PubMed] [Google Scholar]
- 64.Wakana S, Jiang H, Nagae-Poetscher LM, van Zijl PCM, Mori S. Fiber tract-based atlas of human white matter anatomy. Radiology. 2004;230:77–87. doi: 10.1148/radiol.2301021640. [DOI] [PubMed] [Google Scholar]
- 65.Hua K, et al. Tract probability maps in stereotaxic spaces: analyses of white matter anatomy and tract-specific quantification. Neuroimage. 2008;39:336–47. doi: 10.1016/j.neuroimage.2007.07.053. [DOI] [PMC free article] [PubMed] [Google Scholar]
- 66.Tzourio-Mazoyer N, et al. Automated anatomical labeling of activations in SPM using a macroscopic anatomical parcellation of the MNI MRI single-subject brain. Neuroimage. 2002;15:273–89. doi: 10.1006/nimg.2001.0978. [DOI] [PubMed] [Google Scholar]
- 67.Dougherty RF, et al. Temporal-callosal pathway diffusivity predicts phonological skills in children. Proc Natl Acad Sci U S A. 2007;104:8556–61. doi: 10.1073/pnas.0608961104. [DOI] [PMC free article] [PubMed] [Google Scholar]
Associated Data
This section collects any data citations, data availability statements, or supplementary materials included in this article.