

Abstract
Objective
Stimulation of muscle for research or clinical interventions is often superimposed on ongoing physiological activity, without a quantitative understanding of the impact of the stimulation on the net muscle activity and the physiological response. Experimental studies show that total force during stimulation is less than the sum of the isolated voluntary and stimulated forces, but the occlusion mechanism is not understood.
Approach
We develop a model of efferent motor activity elicited by superimposing stimulation during a physiologically activated contraction. The model combines action potential interactions due to collision block, source resetting, and refractory periods with previously published models of physiological motor unit recruitment, rate modulation, force production, and EMG generation in human first dorsal interosseous muscle to investigate the mechanisms and effectiveness of stimulation on the net muscle force and EMG.
Main Results
Stimulation during a physiological contraction demonstrates partial occlusion of force and the neural component of the EMG, due to action potential interactions in motor units activated by both sources. Depending on neural and stimulation firing rates as well as on force-frequency properties, individual motor unit forces can be greater, smaller, or unchanged by the stimulation. In contrast, voluntary motor unit EMG potentials in simultaneously stimulated motor units show progressive occlusion with increasing stimulus rate. The simulations predict that occlusion would be decreased by a reverse stimulation recruitment order.
Significance
The results are consistent with and provide a mechanistic interpretation of previously published experimental evidence of force occlusion. The models also predict two effects that have not been reported previously - voluntary EMG occlusion and the advantages of a proximal stimulation site. This study provides a basis for the rational design of both future experiments and clinical neuroprosthetic interventions involving either motor or sensory stimulation.
1. Introduction
Muscle stimulation during voluntary contractions is being investigated as both a therapeutic (Daly et al., 2005, Lee et al., 2013, Knutson et al., 2014) and a neuroprosthetic (Chae and Hart, 2003, Langzam et al., 2007, Perumal et al., 2010, Yeom and Chang, 2010) intervention for individuals with motor impairments following stroke.
Superimposing stimulation on peripheral nerves carrying ongoing physiological action potential trains can alter the timing and source of action potentials at the endpoint (Crago and Makowski, accepted). The resulting changes in mean action potential period and probability distribution, as well as the source of the action potentials, will evoke different physiological effects, depending on the action potential patterns produced by the interactions. The changes could also limit the ability to estimate the physiological component of recorded EMG activity.
In this paper, we examine the combined effects in the population of motor axons innervating a single muscle, as reported in a preliminary study (Crago and Makowski, 2012). Graded intramuscular or nerve stimulation recruits a subset of these neurons, depending on the axonal excitation thresholds and the stimulus parameters. We examine the interaction between the voluntary motor neuron pool excitation and motor nerve stimulation on the muscle's force and EMG generation. This is particularly relevant to experimental studies of motor neuron pool excitation during maximal voluntary contractions, c.f., (Herbert and Gandevia, 1999) and to the design of neuroprostheses for individuals with weakness, in which force might be increased by electrical stimulation of muscle, e.g., (Chae and Hart, 2003, Knutson et al., 2009, Yeom and Chang, 2010). The ability of superimposed stimulation to generate additional force is limited, as observed experimentally in both neurologically intact individuals and stroke survivors (Perumal et al., 2010, Makowski et al., 2013). The mechanisms of force occlusion have not been studied either experimentally or in simulation, although a descriptive model fitting experimental data has been published (Perumal et al., 2010).
Mathematical simulation provides a method of examining the physiological mechanisms underlying the less than linear force addition (occlusion) during simultaneous stimulated and voluntary contractions. We hypothesized that the reduction in the stimulated force with increasing voluntary excitation can be explained by overlap of the motor units excited both voluntarily and by stimulation. We expected that individual motor unit rates would be increased by stimulation, but that the total force would saturate because of nonlinear properties of motor units as well as the action potential interactions. We also predicted that the overlap of voluntary and stimulated motor unit excitation would reduce the slope of the dependence of the voluntary EMG on total force, since stimulation synchronizes motor unit action potentials to the M-wave, removing them from the voluntary pool. Finally, we hypothesized that the pattern of occlusion would depend on the stimulation recruitment order (reverse recruitment order as expected during whole nerve stimulation vs. random recruitment order as reported for motor point stimulation).
2. Methods
2.1. Combined voluntarily and stimulation activated muscle
We simulated the muscle force and EMG produced by combinations of voluntary activation and electrical stimulation of motor axons, as shown in figure 1. We employed previously published models based on the human first dorsal interosseus (FDI). A model of voluntary motor unit recruitment and rate modulation calculated the firing patterns of all motor units as a function of the normalized input excitation. Similarly, a normalized scalar stimulation level controlled the recruitment of motor units by a fixed rate stimulus. An action potential interaction model action processed the action potentials from each excitation source to calculate the temporal pattern of action potentials arriving at each motor unit. Composite action potential trains were processed to calculate the time course of each motor unit's force and EMG, as well as the summed force and EMG as functions of time for the whole muscle. The M-wave due to the synchronous stimulation was calculated separately from the asynchronous voluntary EMG.
Figure 1.
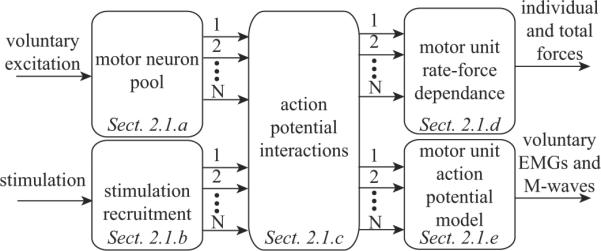
Block diagram of simulation model, with references to the sections where they are described. The inputs to the system include 1) the level of voluntary excitation, which determines the recruitment and firing rate of the N motor neurons, and 2) the stimulation level, which determines the recruitment order and stimulus rate on each of the N axons. The action potential interactions model determines the action potential trains arriving at the endpoint of each of the N axons. The motor unit force model calculates the force produced by each motor unit as well as the summed total force. The motor unit action potential model calculates the composite EMG and separates the voluntary EMG and M-waves.
2.1.a Motor unit properties and motor neuron pool recruitment and rate modulation
The FDI model is the same as described in previous modeling studies (Fuglevand et al., 1993, Zhou et al., 2007, De Luca and Contessa, 2012). The baseline normal model had N = 120 motor units, with peak twitch forces ranging from 1 - 100, with arbitrary units (a.u.). The corresponding twitch contraction times τc spanned a range of 3:1, with the slowest equal to 0.09s.
We examined two different models of normal motor unit recruitment and rate modulation in the FDI, as described by De Luca and Contessa (De Luca and Contessa, 2012) and by Fuglevand et al. (Fuglevand et al., 1993). Both recruitment and firing rate models specify the mean firing rate for a specific value of excitation for each motor unit.
The bulk of the results will be based on the onion-skin model developed De Luca and Contessa. These models differ significantly in the maximal force achieved at full excitation, the fraction of the force range over which full recruitment is achieved, the range of individual motor unit firing rates, and the behavior of firing rates above threshold. For both models, motor unit excitation thresholds increase exponentially. The range for full recruitment and the dependence of each motor unit's firing rate on the difference between the excitation and the threshold varies between the models.
For the De Luca and Contessa model, full recruitment is achieved at 67% full excitation. The De Luca and Contessa onion skin model describes motor unit firing behavior during linear force increases, and it includes dynamic properties of firing rate behavior described by a single time constant. Since we are modeling steady contractions, we used a steady-state solution to the published model. This model produces firing rates that increase with excitation. In the onion-skin model, the threshold firing rate of units decreases with increasing threshold. As excitation increases, the firing rates of already recruited units remain greater than the firing rates of higher threshold units. At maximal excitation, the MVC is 1.11×10⁴ a.u.
For the Fuglevand, et al. model, full motor unit recruitment occurs at 40% of full excitation. All motor units fire at the same minimum rate at recruitment threshold, increase their rate at the same slope with respect to excitation, and saturate at a value is higher for increasing motor unit numbers. This is a reverse onion skin model. Because of the differences in firing rate behavior, the MVC for the Fuglevand, Winter and Patla model is 2.35 ×10⁴ a.u., which is approximately twice the MVC of the De Luca and Contessa model. Thus, 10%MVC increments for the De Luca and Contessa model are approximately 5%MVC for the Fuglevand et al. model. Because of the differences in achievable MVCs, the results are examined as absolute forces.
2.1.b Stimulation sites and stimulus recruitment order
For this study, we considered two different surface stimulation sites, over the motor point of the FDI and over the ulnar nerve at the wrist. We assumed a different electrical stimulation recruitment pattern at each site. For surface stimulation over the muscle motor point, motor unit recruitment is non-selective, due to extensive motor axon branching and a distribution of motor axon sizes and spatial locations (Knaflitz et al., 1990, Gregory and Bickel, 2005). We simulated this pattern by recruiting motor units in random order with a uniform probability distribution. In contrast, when stimulating the peripheral nerve at the wrist, recruitment follows the reverse of the physiological size principle, i.e., large axons innervating large, fast motor units are recruited at lower thresholds than small, slow motor units (Bergquist et al., 2011, Bergquist et al., 2012).
2.1.c Action potential interaction model
We adopted a previously published model to simulate action potential interactions (Crago and Makowski, accepted). In the absence of interactions, an action potential generated by the neuron travels past the stimulation site after the intersite conduction time tic, and arrives at the endpoint (the muscle) after an additional delay tp. A stimulus elicits a pair of action potentials that travel both antidromically and orthodromically. The orthodromic action potential arrives at the motor endpoint after time tp, and the antidromic action potential arrives proximally at the neuron after time tic. Three action potential interactions were modeled: collision block in the axonal segment between the neuron and the stimulation site; failure of a stimulus to generate action potentials because the axon is refractory following a passing action potential generated by the neuron; and phase resetting of the neural source by an antidromic action potential invading the neuron. We assume complete phase resetting in this study (Eccles, 1955).When an antidromic action potential generated by a stimulus pulse arrives at the neuron prior to the time when the next neural action potential would normally occur, the neuron behaves as if it had just generated a normal action potential, and the next action potential is generated after the regular period.
The intersite conduction distance, d, from the spinal cord to the FDI motor point is approximately 0.8 m. The individual conduction velocities νci of axons innervating FDI range from νc1 = 40 m/s to νcN = 62 m/s and are linearly related to physiological recruitment threshold (Dengler et al., 1988). For motor point stimulation, the intersite conduction times range from tic1 = 0.02 s to ticN = 0.0129 s. For stimulation of the nerve at the wrist, motor units were recruited in order from largest to smallest size, reverse recruitment order, and the proximal intersite conduction distance was shortened 10% to 0.72 m.
The absolute refractory period tr of stimulated axons varies with the strength of the stimulus relative to the threshold. Borg reported values ranging from 0.88 +/− 0.26 to 1.83 +/− 0.26 ms for stimulation intensities of 2 to 1.1 times threshold respectively (Borg, 1984). We chose a value of 1.5 ms for our study. We did not include the relative refractory period in this model, because of the minor role of the refractory period in the resulting action potential patterns (Crago and Makowski, accepted).
Individual motor unit action potential trains were created by independent neuronal and stimulation sources. The endpoint arrival times and sources of action potentials in each axon were computed on the basis of a logical decision tree implementing the conditions described above. Neuronal sources were modeled as pulse trains with normally distributed firing periods described by the mean (Tn) and coefficient of variation (CV = 0.2). The neuronal firing period was reset if an antidromic action potential from the stimulation arrived at the neuron before the next neuronal action potential was generated. Stimulus action potentials were always generated except when the stimulus occurred during the refractory period following the passage of a neuronal action potential at the stimulation site.
2.1.d Motor unit rate-force model
Motor unit forces were calculated using the model described by Fuglevand et al. (Fuglevand et al., 1993). The time course of force for individual motor units was computed by summing superimposed scaled twitch responses starting at the time that each action potential arrived at the muscle. Total muscle force was calculated as the sum of the forces produced by all active motor units. Motor unit force twitches were modeled as critically damped second order impulse responses scaled to the peak force and contraction time of the individual motor unit and also scaled by an additional factor to model the force-frequency dependence. The model does not include other known contraction effects such as potentiation or fatigue.
2.1.e Motor unit action potentials and EMG summation
We adopted the EMG modeling process outlined by Zhou et al. (Zhou and Rymer, 2004, Zhou et al., 2007) for the human FDI. Each action potential arriving at a motor unit triggers the addition of an impulse response representing the motor unit action potential (MUAP). The time course of each MUAP is modeled as a first order Hermite-Rodriguez function with a 12 ms duration and amplitude proportional to the peak twitch force of the motor unit, in arbitrary units. The MUAPs from each motor unit were assumed to add linearly to create the muscle EMG and M-wave. The source of each motor unit action potential was tracked and the EMGs due to action potentials arising from the neurons were summed separately from those arising from the stimulation source. Thus, the asynchronous voluntary EMG was computed separately from the M-wave, and summed to compute the composite.
2.2 Simulation protocols
Whole muscle contractions were simulated to examine the behavior of muscle force and EMG, as well as the contributions of the individual motor units to both force and EMG. We systematically varied the stimulus frequency, the excitation levels for the voluntary and stimulated contractions, the recruitment and rate modulation model, and the stimulation site and recruitment order.
Whole muscle contractions were simulated for a 3 s total duration (see example in figure 2). The first 1.5 s consisted of an isolated voluntary contraction, followed by a 1.5 s combined voluntary and stimulated contraction. Voluntary and stimulated contraction levels were chosen in increments of 10% MVC, from 0% to 100% (121 combinations at each stimulus frequency). Voluntary contraction levels were specified by the appropriate value of excitation corresponding to the desired %MVC for each model. For random stimulation recruitment order, we averaged the results of 10 simulations with different random recruitment patterns for each combination of recruitment levels.
Figure 2.
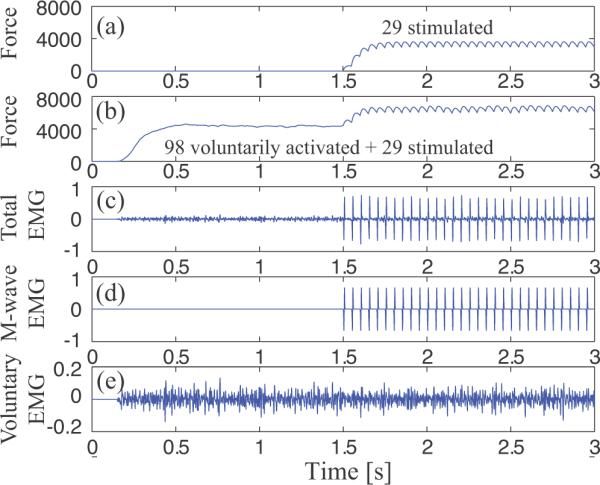
Example of simulated whole muscle force, EMG, and M-waves. Force and EMG are in arbitrary units. (a) A stimulated contraction at 30% MVC is achieved by stimulating 29 motor units at 20 s−1. (b) A neurally generated 40% MVC contraction achieved by recruiting 98 motor units is maintained for a full 3 s period, and the same stimulation as shown in (a) is superimposed beginning at time 1.5 s. The total EMG (c) is separated into the M-wave (d) and voluntary EMG (e) components.
For stimulated contractions, the force range is limited by the stimulus rate and it was not possible to achieve full MVC at low stimulus rates. Also for stimulation it is not always possible to match a specific percentage of MVC because stimulation levels must be set as an integer number of motor units. This was typically a greater problem with the reverse recruitment order and high stimulation frequencies at low stimulated force levels, when a relatively small number of high force motor units were recruited.
For each combination of excitation levels and stimulation frequency, the process was to first construct the action potential train for each motor unit, following the interaction rules described above, and then calculate the individual motor unit forces and EMGs in the time domain (0.0005 s time increments), all according to the models described above. The individual motor unit forces and EMGs were summed to calculate the whole muscle contraction. Simulations were programmed in Matlab (version 2011b).
Force and EMG levels were calculated during the two plateau phases of the simulated contractions – the initial voluntary contraction and the subsequent period of combined contractions. Each time window started 0.5 s after the contraction phase began and stopped 0.1 s before the phase ended, i.e., a 0.9 s window for each phase for the typical 3 s simulation. Forces were calculated as the mean value over the window, whereas the voluntary component of the EMG was quantified by calculating the mean of the absolute value during each time window. The force increment was calculated as the difference in the mean forces from the first to second phases.
The contributions of individual motor units to the total force were analyzed quantitatively. At specified voluntary and stimulated contraction levels, the mean force produced by each motor unit was calculated in the two plateau phases. The incremental force produced by each motor unit during stimulation was calculated by taking the difference between the two phases.
The firing periods of action potentials arriving at each motor unit were analyzed to calculate the effects on the mean and distribution during simultaneous voluntary and stimulated contractions. These were compared to the periods prescribed by the model to show the effects of simultaneous excitation. The effect of stimulation on individual motor unit contributions to the voluntary EMG was quantified as the fraction of endpoint action potentials that came from the motor neuron during stimulation. Individual contributions to the total EMG cannot be quantified by calculating the mean absolute value of the individual motor unit action potentials because cancellation introduced by randomly superimposing opposite polarity phases occurs prior to rectification (Keenan et al., 2005). To reduce statistical fluctuation due to small numbers of action potentials in the typical 0.9 s windows, simulations to analyze single motor unit contributions were extended to 100 s total duration (50 s voluntary phase, 50 s combined phase) Again, the first 0.5s and final 0.1s of each phase were discarded.
3. Results
3.1 Force and EMG occlusion during combined voluntary and stimulated muscle contractions
3.1.a. Motor point stimulation with random recruitment order
Combining contractions resulted in both force and EMG occlusion. We systematically varied voluntary excitation level, stimulation recruitment level, and stimulus rate to examine the effects of their interdependencies in producing the occlusion. We also examined the sensitivity of the occlusion to the choice of motor neuron pool model.
The total force during combined stimulated and voluntary contractions increases continuously with the level of voluntary force, as shown in figure 3a,b for the De Luca and Contessa motor neuron pool model. However, at a given stimulus rate, the slope decreases as the level of stimulated force level increases, indicating that the total force is less than the sum of the individual components, i.e., there is force occlusion. For stimulation at 10 s−1, the total force falls below the voluntary force level when the voluntary force reaches about 5500 a.u. (50% MVC), and there is noticeable upward curvature of the total force. In this region, the total force can decrease with increasing stimulation level. For the 30 s−1 stimulation example in figure 3b, the slope decrease is smaller, the relationships display a nearly straight-line dependence, and the total force stays above the voluntary force at all levels.
Figure 3.

Force and EMG occlusion as a function of voluntary and stimulated contraction levels and stimulus rate during motor point stimulation with random recruitment order. (a,b) The increment in force produced by stimulation at 10 s−1 and 30 s−1 respectively is plotted as a function of the initial voluntary force for stimulation levels producing 0% - 100% of MVC in the absence of any voluntary force. In each panel, the dotted line is unity slope, i.e. without any stimulation. (c) Normalized stimulated force increments at each stimulus rate as a function of the initial voluntary force for both motor neuron pool models. The forces (mean +/− sd) at each stimulation level were normalized to the stimulated force without any background voluntary contraction and then averaged. Each symbol represents a different stimulus rate. (d) The voluntary component of the combined EMG during stimulation is plotted versus the voluntary EMG prior to stimulation onset for stimulation at 20 s−1 for different levels of stimulation. A thin unity slope line is shown for visual reference. (e, f) Voluntary force as a function of the voluntary EMG during stimulation at 20 and 45 s−1 respectively at various stimulated contraction levels given by the legend in (f).
The occlusion can be quantified more directly by calculating the stimulated force increment as a function of increasing voluntary force. The incremental force is the vertical difference between the unity slope line and one of the constant stimulus level lines in figures 3(a) and 3(b). At a given stimulus rate, the dependence of the incremental force on stimulus level at a given frequency appears to scale with the stimulated force level. Thus, in figure 3c the incremental force at each stimulus rate is normalized to the incremental force in the absence of a voluntary contraction, and then averaged. The low standard deviations validate the scaling assumption. Voluntary force is not normalized in order to compare the models at equivalent force levels, but the symbols on each line are spaced at 10% MVC increments for both motor neuron pool models.
At each stimulus rate, the normalized force increments have the same dependence on the initial voluntary force, regardless of the stimulation force level as evidenced by the small standard deviations for the averaged normalized forces. At equal forces, the two motor neuron pool models have very similar levels of occlusion and force dependence.
The slope of the incremental force fall-off is highest at low stimulus frequencies, with complete occlusion at 6000, 9000 and 15000 a.u. during stimulation at 10, 15 and 20 s−1 respectively, and negative force increments at higher voluntary levels before some recovery as voluntary force reaches MVC for the Fuglevand model. Occlusion is less prominent at higher stimulus frequencies. For stimulation at 30 and 45 s−1, there is about 50% force occlusion at MVC for the De Luca and Contessa model, and essentially 100% for the Fuglevand et al. model at its MVC, with no negative increments at any force level. Curvature is evident at 10, 15 and 20 s−1, but the relationships are essentially straight lines at the two higher frequencies.
The voluntary component of the EMG during combined voluntary and stimulated contractions shows occlusion that is qualitatively similar to the force occlusion, i.e., the voluntary component of the EMG is reduced by stimulation, as illustrated in figure 3d for stimulation at 20 s−1. The reduction is greater at increasing stimulation levels. EMG occlusion is independent of motor neuron pool model for contraction levels up to the MVC of the De Luca and Contessa motor neuron pool model. The Fuglevand et al. model shows less occlusion at higher contraction levels, but stimulated forces greater than approximately 60% of the Fuglevand et al. MVC cannot be achieved at 20 s−1.
The effects of occlusion are also evident in the force-EMG relationship, constructed by plotting the total force as a function of the voluntary component of the EMG, as shown in figure 3 (e,f). In the absence of stimulation, force displays the expected nearly straight-line dependence on the mean rectified EMG (dotted lines without markers). During superimposed stimulation, the force-EMG relationships are similar but the progressive reduction of the voluntary component of the EMG with increasing stimulation level compresses the range of the voluntary EMGs over the same voluntary excitation level even though total force increases. At a 20 s−1 stimulus rate in figure 3(e), the force-EMG slope decreases with increasing stimulation level. In contrast, at 45 s−1 stimulation in figure 3(f), the relationships shift to higher forces, and saturate at the maximal muscle force level.
When compared over the force and EMG ranges of the De Luca and Contessa model, there is little difference between the two motor neuron pool models. At higher force and EMG levels obtained with the Fuglevand model, prominent force occlusion but little EMG occlusion are observed at a 20 s−1 stimulus rate, figure 3(e). In contrast, force and EMG occlusion occur in parallel at a 45 s−1 stimulus rate, figure 3(f).
3.1.b Nerve trunk stimulation at the wrist with reverse recruitment order
Moving the stimulation site to the ulnar nerve at the wrist shortens the intersite conduction time by 10% and changes the stimulation recruitment order from random to the reverse physiological order. The change in recruitment order from random to reverse has a profound effect on the patterns of force and EMG occlusion.
The pattern of force occlusion depends strongly on both the voluntary and stimulation recruitment levels, which in turn depend strongly on the stimulation rate. The dependence on both voluntary and stimulation force levels is evident for stimulation at 15 s−1, as shown in figure 4(a). For the highest stimulation force that can be achieved at this frequency (70% MVC), the incremental force decreases in a nearly straight-line manner with increasing levels of voluntary contraction. As the stimulation level decreases from 60% to 10%, occlusion begins at progressively higher levels of voluntary contraction and develops more gradually. The order of the force increments reverses in the middle of the voluntary force range – lower stimulation levels generally produce higher incremental forces as the voluntary force level approaches MVC. At an initial force of 5500 (50% MVC), the stimulation force increment is virtually identical for stimulation levels ranging from 30% to 50% MVC.
Figure 4.
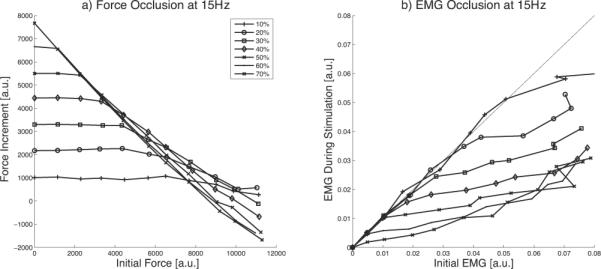
. (a) Force and (b) EMG occlusion during simultaneous voluntary (De Luca and Contessa model) and 15 s−1 stimulated contractions applied at the wrist with the reverse recruitment order. Each line shows increasing voluntary contractions at one level of stimulation as indicated in the legend. Stimulated forces greater than 70% MVC could not be generated by stimulation at 15 s−1.
EMG occlusion parallels the force occlusion pattern, as illustrated in figure 4(b). The voluntary component of the EMG is unchanged during low stimulation level contractions, but the slope decreases abruptly as occlusion develops.
Increasing the stimulation frequency moves the point at which the force increment begins to decline to higher voluntary contraction levels and decreases the slope and depth of occlusion. However, some occlusion in force and EMG is evident at the highest contraction levels for all of the stimulus frequencies tested.
3.2 Contributions of single motor units to force and EMG occlusion
The contributions of individual motor units to the stimulated force increment vary widely, but a small number of large motor units are the predominant source, even in the case of random recruitment during stimulation. An example showing the contributions of individual motor units to the incremental force and EMG during motor point stimulation is shown in figure 5 (a-e). This example combines a voluntary contraction at 50% MVC (107 active motor units) with a stimulated contraction at 30% MVC (49 motor units stimulated at 15Hz) using the De Luca and Contessa motor neuron pool model for the voluntary contractions.
Figure 5.

The alterations in firing rate and the contributions of single motor units to the incremental force and voluntary EMG for motor point stimulation. The voluntary level was 50%MVC and the stimulation level was 30%MVC. a) Cumulative incremental force of motor units across the motor unit pool. b) Incremental force produced by stimulation of each motor unit. c) Motor unit rates determined by neural drive and stimulation. Also shown are the net rates arriving at the endpoint (endpoint APs), and the rates of endpoint APs originating at the neuron. d) Probability distribution of endpoint action potential periods driven by neural activation alone. e) Probability distribution of endpoint action potential periods of all stimulated units. The motor unit contraction time τc of individual motor units is superimposed. For d) and e), the color scales give the probabilities of an action potential occurring in 5 ms bins estimated over a 50 s simulation time period. The area of each point is also scaled by the probability to facilitate comparisons.
Figure 5(c) shows the firing rates established by the neural drive and by the stimulation at 15 s−1. We also plot the average rate of action potentials arriving at the endpoint activated by both sources (endpoint APs). In this example, stimulation of motor units at rates below the neural firing rate (motor unit rank less than 86) produces almost no change in the endpoint rate. Above the rate cross-over point, the average rate tracks the stimulus rate. Motor units below the crossover point produce negative incremental forces, i.e, their force during simultaneous excitation actually decreases, figure 5(b), compared to neural excitation alone, even when there is a minor increase in average rate. The only positive force increments are due to stimulated motor units in the range between 86 and 120. The cumulative incremental force is plotted versus motor unit number as the total incremental force of all motor units up to and including that number in figure 5(a). The negative increments of the smaller motor units offset the positive contributions of the increasingly larger motor units up to 100. Thus, the total force increment is due to the nine stimulated motor units recruited between 100 and 120.
Although stimulation rates below or close to the average voluntary discharge rate only modestly increase the net average motor unit rate, the firing period distribution changes substantially in comparison to the physiological distribution (compare the normal probability distributions of single motor unit action potential periods during neural activation alone in figure 5d, with the probability distributions of periods during combined stimulation in figure 5e, which show a bimodal distribution of periods shorter than the stimulus period, and another prominent peak at the stimulus period that increases with motor unit number.
Superimposed on figure 5(e) is a plot of motor unit twitch contraction time τc as a function of motor unit number. When the force decrement is the largest, there is a large fraction of the endpoint action potentials with periods greater than the twitch contraction time. This introduction of relatively large periods, combined with the nonlinear force frequency relationship is responsible for the force decrements, as has been observed previously (Fuglevand et al., 1993). Increasing the stimulus frequency, e.g., to 20 s−1, effectively eliminates the force decrements (not shown). Force decrements are only seen when the stimulus period is both greater than the neural firing period and long compared to the twitch contraction time.
The mechanism of EMG occlusion is revealed in figure 5(c) by the gradually decreasing rate of endpoint action potentials that arise from the neural source. Even for the smallest motor units, with the highest intrinsic neural rate, less than half of the endpoint action potentials come from the neuron. The fraction decreases to zero in larger motor units before reaching the upper limit of neural recruitment.
In the case of reverse recruitment order during stimulation of the nerve trunk, there is no occlusion if there is no overlap between the voluntarily and stimulated units, i.e., if the sum of the number of voluntarily activated units and electrically stimulated units is less than or equal to the total number of motor units. The same level of non-occluded stimulated force is achieved with a much smaller number of motor units with reverse recruitment than with random recruitment due to the higher motor unit forces. A 50% MVC stimulated contraction at 15 s−1, requires 53 stimulated units for reverse recruitment order vs. approximately 81 for random recruitment order. This difference is even larger at 30 s−1, with 9 vs. 38 motor units required for 50% MVC with reverse and random recruitment respectively.
As with random recruitment by motor point stimulation, motor units stimulated at rates greater than the neuronal rate produce the majority of the additional force. Increases in motor unit rate by stimulation at lower rates are modest, in agreement with the relatively high intersite conduction time:stimulus period ratio (Crago and Makowski, accepted) even with the more proximal wrist stimulation location.
4. Discussion
To our knowledge, this is the first systematic study of the effects of all three mechanisms of collision block, source resetting, and refractory periods on both the force and EMG during stimulation of physiologically activated muscle. The interaction model reproduces experimentally observed force occlusion and provides insight into the responsible mechanisms. The results support the hypothesis that overlapping activation of some motor units by the two different sources, combined with nonlinearities of action potential interactions and motor unit force generation, are responsible for the observed occlusion. The study predicts consequences of the action potential interactions that have not been previously identified, i.e., the reduction of voluntary activation information from the EMG signal during stimulation.
4.1 Mechanisms of force and EMG occlusion
The three interaction mechanisms have different effects on the mean firing rate at the endpoint and on fraction of those action potentials that originate from the neuron or from the stimulus. Refractory blocks have no effect on the conduction of neural action potentials since any refractory block would be preceded by a collision block. However neural action potentials can occlude the stimulation. Collision blocks do not change the number of endpoint action potentials, but shorten the time of arrival and switch the source from the neuron to the stimulus. Thus, the mean endpoint rate will not change, but the fraction of action potentials from the neuron will decrease. In the case of muscle stimulation, the switch of the action potential from the neural to the stimulated pool removes its contribution to the voluntary EMG and adds it to the M-wave. Similarly, resetting involves decreasing the number of action potentials arising from the neuron by lengthening the neural firing period. However, each resetting is accompanied by an endpoint action potential from the stimulation site. The combination of asymmetrical resetting and short intersite conduction times allows stimulation to increase the mean rate of endpoint action potentials even when the neuron is firing faster than the stimulus. As will be discussed below, both the location of the stimulation along the axon length and the stimulus rate are design variables that allow optimization of experimental or clinical outcomes.
As voluntary force increases, both the increment in force produced by stimulation and the voluntary component of the EMG, decrease. The pattern of occlusion depends on the stimulation recruitment order and stimulation rate. Random recruitment shows progressive occlusion of stimulated force as the voluntary background force increases. Increasing the stimulus frequency requires less recruitment to achieve the same stimulation force, and thus decreases the number of overlapping motor units and the degree of occlusion. In contrast to random recruitment, reverse recruitment order predicts a region of voluntary force with no occlusion, where there is no overlap between the motor units recruited voluntarily (in order of increasing size) and those recruited by stimulation (in order of decreasing size). As the level of voluntary and stimulated excitation increases, the two populations overlap and occlusion develops progressively.
The pattern of progressive force occlusion we observed in the case of random stimulated recruitment parallels that seen experimentally for surface motor point stimulation in human subjects, including stimulation of tibialis anterior in neurologically intact subjects during both static (Langzam et al., 2007) and dynamic (Langzam et al., 2006) contractions, stimulation of quadriceps in neurologically intact subjects during static contractions (Perumal et al., 2010), and stimulation of triceps in individuals impaired by chronic stroke, also during static contractions (Makowski et al., 2013).
The Langzam et al. protocol required the subjects to track specific force targets with and without stimulation, adjusting their voluntary effort in real time to reduce the tracking error. A measure of the voluntary contribution to the total force was estimated from the voluntary EMG following artifact and M-wave removal, under the assumption that the voluntary EMG was unaltered by the stimulation at the low contraction levels studied (20% MVC in the dynamic case (Langzam et al., 2006) and 20% or 30% in the static case (Langzam et al., 2007). In view of the EMG occlusion predicted in the current study, this assumption may not be valid even at these low contraction levels. The concept of separating the net force into a voluntary and stimulated component is also problematic because of the neuromuscular system nonlinearities. The two components do not add linearly in the case where there is shared activation of some of the same motor neurons.
Nevertheless, we can create a plot of the estimated voluntary force as a function of the combined force for different levels of stimulation for direct comparison with their figure 6 (Langzam et al., 2007). Our estimates are based on the data in figure 3b during stimulation at 20 s−1, the same rate as used in the experimental study for static contractions. A horizontal line through figure 3b connects combinations of voluntary and stimulated forces that produce the same combined force, and a vertical line gives the value of the voluntary component of the EMG that would be recorded during the combined contraction at a given force. That value of EMG provides an estimate of the force that would be produced in the absence of stimulation through the force-EMG relationship obtained without stimulation, thus paralleling the methodology employed in the experimental studies. In agreement with their experimental results, the simulation predicts a family of nearly straight-line decreases in voluntary force contributions as the stimulated force level increases, as shown in our figure 6.
Figure 6.
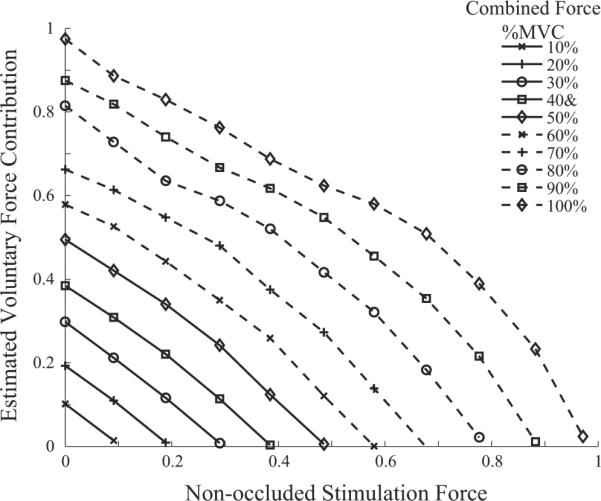
Voluntary contributions to the total combined force as a function of stimulation force level. Each line is for a constant level of combined force.
Our simulation results can also be compared directly to other experimental results reported for both neurologically intact subjects (Perumal et al., 2010) and poststroke subjects (Makowski et al., 2013). Both of these studies were for static contractions and the lines in figure 3c are strikingly similar to the experimental data for similar contraction levels. Both studies found a progressive, nearly straight-line, decrease in the incremental force with increasing voluntary force.
The Perumal study examined selected combinations of stimulus rates (20 and 60 s−1) for voluntary and stimulated contraction levels from 10% to 70% MVC (Perumal et al., 2010). For the combinations studied, the simulations and the experimental results are in agreement, with nearly straight-line occlusion of incremental force developing with increasing voluntary contraction level. Unfortunately, the experimental data did not include high voluntary force and low stimulus rate conditions where the model predicts negative force increments. The 70% voluntary contraction level only employed a 60 s−1 stimulation rate.
The data reported by Makowski et al. (Makowski et al., 2013) for 20% MVC stimulation at 35 s−1 during voluntary contractions of 20 and 50% MVC (their figure 4d), show nearly straight-line occlusion, as observed by Perumal and by this simulation study. Since this study was in individuals poststroke, it indicates the potential applicability of the results to neuroprosthetic force augmentation. There are reasons why this result might not have been expected, including differences in motor unit recruitment and rate modulation, as well as changes in motor unit properties poststroke (Gemperline et al., 1995, Suresh et al., 2011).
Perumal et al. derived a phenomenological model to describe their experimental results, fitting a nonlinear power relationship to the experimental data and forcing complete occlusion at 100% MVC (Perumal et al., 2010). The power relationship would not describe the family of occlusion curves shown in figure 3c. We also found that a straight line relationship fit the Perumal experimentally measured data well (their figure 3B), ignoring the assumed point of complete occlusion. A straight-line model also does not fit the curvature we predict at low frequencies and only intersects the point of complete occlusion at the highest stimulus rates.
4.3 Application to neuroprosthetic force augmentation
The concept of augmenting voluntary muscle force by stimulation of the same muscle (force amplification) has been proposed as a neuroprosthetic method of restoring function in individuals with weakness following stroke, but is not in clinical use. There are two potential functional advantages of such an approach – increasing the maximum force that can be achieved in the case of weakness due to inadequate muscle excitation, and/or 2) decreasing the level of voluntary effort required to achieve a certain force level. Increasing the force enables a user to complete tasks that require forces greater than they can achieve voluntarily. Decreasing voluntary effort could make tasks less cognitively demanding (Zijdewind et al., 2006) and lower the motivation threshold for limb use, with the potential to decrease the likelihood of learned disuse of the affected limb and reduce the expression of abnormal synergies that might interfere with task completion (Makowski et al., 2013).
There are several tradeoffs in specifying an EMG based force augmentation controller. The first choice is the balance between voluntary and stimulated force levels. A low voluntary force keeps the voluntary effort low, whereas a high voluntary force makes it easier to estimate the control signal since the voluntary EMG will be larger in magnitude. High stimulation rates and recruitment levels will create a potentially higher and smoother combined force. A higher stimulus rate also requires less recruitment, reducing the impact of occlusion on voluntary EMG estimation. However, fatigue resistance is improved at low stimulus rates, which would be important for maintained contractions. Low rates also increase the time between stimulus pulses, increasing the time for estimating the voluntary EMG.
Stimulation recruitment order and electrode site are also important considerations for the design of force augmentation systems. The incremental forces are almost entirely due to stimulation of the larger motor units, even during random recruitment. Thus, no force is gained by simultaneous activation of the small or intermediate motor units, but the motor unit action potentials from these motor units are lost from the voluntary EMG. Therefore, a reverse recruitment order might have some advantages for force augmentation, since there is less overall occlusion of force and EMG. Reverse recruitment order is normally viewed as undesirable because of the enhanced rate of fatigue, but since random recruitment produces the force augmentation via some of the same motor units, there may be little difference in fatigue rate with reverse recruitment order.
One of the reasons that the forces of intermediate size motor units are not increased by low frequency stimulation is the relatively long intersite conduction time for motor point stimulation of distal muscles such as the FDI. Motor unit rates could be increased even at low stimulus rates if the axons could be stimulated at a more proximal location to decrease the intersite conduction time between the two action potential sources (Crago and Makowski, accepted). This could enable greater incremental force in intermediate size motor units that are not yet activated to the saturation point on the force-frequency curve. Increasing the force contribution of these motor units could potentially provide greater fatigue resistance. Ideally, one would like to selectively increase the firing rate of intermediate size units to avoid the force depression seen in figure 5 and to avoid recruiting the large fatiguable units until the larger force is necessary. Thus, a proximally located nerve cuff stimulation electrode with sufficient muscle selectivity (Tyler and Durand, 2002) and with a physiological recruitment order (Lertmanorat et al., 2006) could have functional benefits as well as the practical implantation benefits of avoiding long lead lengths.
Neurophysiological changes in motor neuron control properties and motor unit mechanical properties following stroke and spinal cord injury (SCI) will have implications for the design of FES assistance. Due to the nonlinear interactions of the system, specific combinations of changes would need to be simulated to make predictions, but some general observations can be made for particular types of changes. In stroke, the reduction in motor unit discharge rates at threshold and the reduction in rate modulation slopes above threshold (Gemperline et al., 1995, Chou et al., 2013, Mottram et al., 2014, Suresh et al., 2011) imply that lower rates of stimulation would need to be applied in order to avoid complete occlusion of voluntary control of the stimulated units. In contrast, it also implies that there may be a greater opportunity to augment force by stimulation induced rate increases in the smaller motor units, especially for stimulation sites and muscles that allow short intersite conduction times (Crago and Makowski, 2014). A reduction in motor unit number (Hara et al., 2004) will reduce overall muscle strength. If the loss were dominated by high threshold, fast motor units, there would be very low force augmentation by stimulation. Disuse atrophy, particularly of large, fast motor units would similarly predict lower force augmentation by stimulation. Motor unit changes such as the above are also reported following SCI (Thomas et al., 2014), and would have similar effects on occlusion.
4.4 Activity seen by the CNS related to motor axon stimulation
The mechanisms of force enhancement predicted by this study do not rely on any possible reflex effects of the stimulation, which could arise from three sources – the direct excitation of muscle afferents by the stimulation, the physiological response of the muscle proprioceptors to the induced contraction, and the antidromic activity in stimulated muscle efferents. The changes in antidromic activity in the motor axons that reach the spinal cord and that could be conducted in the recurrent collaterals of the Renshaw system can be predicted by the interactions observed in this study and reported previously (Crago and Makowski, accepted).
Of the three types of outcome for stimulation of motor efferents (refractory block, collision block, and resetting), only those action potentials that evoke resetting would reach the recurrent collaterals. There is a potential for increased recurrent feedback, but it is recruitment level, stimulus rate, and intersite conduction time dependent.
For motor neurons that are not voluntarily recruited, each stimulus action potential would produce a recurrent action potential. This is only possible for voluntary contractions less than the level for full recruitment, i.e., 67% MVC for the De Luca and Contessa model of FDI. At the same stimulated contraction level, more silent motor efferents would be stimulated for reverse stimulation recruitment order than for random recruitment order.
For motor neurons that are voluntarily recruited and for a stimulus rate Rs less than the neural rate Rn, the average rate of recurrent action potentials during stimulation would be Rrs = fn Rn + fsr Rs, where fn is the fraction of neural action potentials that either reach the muscle or result in collision block, and fsr is the fraction of stimuli that produce resetting. Thus, the net increase in recurrent action potential rate would be Rrs-Rn for each voluntarily recruited motor unit. The fraction of stimuli that produce resetting depends strongly on the intersite conduction time, and for FDI, about 60% of low rate stimuli would be transmitted through the recurrent axons to the CNS. For Rs > Rn, essentially all stimuli would produce activity in the recurrent collaterals, and the change in the recurrent rate would be the difference in the rates, Rs – Rn. In addition to changing the average rate, the stimulus generated recurrent action potentials would be highly synchronized, with the potential of producing a different physiological response than the asynchronous firing case.
4.5 Limitations of the current study
Muscle stimulation, as a therapeutic intervention, produces complex interacting effects on the signals seen by the CNS, but the mechanisms of action are not understood either qualitatively or quantitatively. Thus, it is uncertain what constitutes a therapeutic dose. In addition to stimulation of the motor efferents, muscle contractions produce physiological length and force changes that modulate proprioceptive afferent firing. The co-location and overlapping size distribution of motor efferents and large proprioceptive afferents from muscle spindles and tendon organs results in overlapping simultaneous electrical excitation of these axon populations, altering the afferent pattern arriving centrally, as well as modulating the CNS response. Antidromic action potentials in motor efferents were described in section 4.4. A comprehensive model of the sensorimotor system is required to quantitatively understand the CNS inputs and to drive the design of muscle stimulation therapy.
As mentioned in Section 2.1, the model does not include the activation history dependent motor unit properties of potentiation or fatigue. In particular, potentiation and fatigue are observed in type II muscle fibers, which constitute the large, high threshold units that contribute most of the force augmentation predicted by this study, as seen in Figure 5(b). Since experimental occlusion protocols control for potentiation and fatigue, this model limitation is not an issue for the comparisons made in Section 4.2. Potentiation and fatigue will limit the ability to reliably predict force augmentation, and, as pointed out in Section 4.3, fatigue could be a significant issue limiting force augmentation in prolonged contractions.
A limitation of the current occlusion model is that it does not include dynamic motor unit recruitment and rate modulation conditions, which are more characteristic of normal movement, and could involve motor unit firing in bursts, which would be less occluded. Constant rate stimulation is widely used in neuroprosthetic and neurorehabilitation applications, but dynamically patterned stimulation can be more effective under some conditions.
Supplementary Material
Acknowledgments
This research was supported in part by the U.S. National Institutes of Health, National Institute for Child Health and Development under grants R21HD055256, the American Heart Association grant 11PRE6600000, and the United States Department of Education grant number P200A100112.
References
- Bergquist AJ, Clair JM, Collins DF. Motor unit recruitment when neuromuscular electrical stimulation is applied over a nerve trunk compared with a muscle belly: triceps surae. J Appl Physiol. 2011;110:627–37. doi: 10.1152/japplphysiol.01103.2010. [DOI] [PubMed] [Google Scholar]
- Bergquist AJ, Wiest MJ, Collins DF. Motor unit recruitment when neuromuscular electrical stimulation is applied over a nerve trunk compared with a muscle belly: quadriceps femoris. J Appl Physiol. 2012;113:78–89. doi: 10.1152/japplphysiol.00074.2011. [DOI] [PubMed] [Google Scholar]
- Borg J. Refractory period of single motor nerve fibres in man. J Neurol Neurosurg Psychiatry. 1984;47:344–8. doi: 10.1136/jnnp.47.4.344. [DOI] [PMC free article] [PubMed] [Google Scholar]
- Chae J, Hart R. Intramuscular hand neuroprosthesis for chronic stroke survivors. Neurorehabil Neural Repair. 2003;17:109–17. doi: 10.1177/0888439003017002005. [DOI] [PubMed] [Google Scholar]
- Chou L-W, Palmer JA, Binder-Macleod S, Knight CA. Motor unit rate coding is severely impaired during forceful and fast muscular contractions in individuals post stroke. J Neurophysiol. 2013;109:2947–2954. doi: 10.1152/jn.00615.2012. [DOI] [PMC free article] [PubMed] [Google Scholar]
- Crago PE, Makowski NS. Muscle response to simultaneous stimulated and physiological action potential trains--a simulation study. Conf Proc IEEE Eng Med Biol Soc. 2012;2012:1839–42. doi: 10.1109/EMBC.2012.6346309. [DOI] [PMC free article] [PubMed] [Google Scholar]
- Crago PE, Makowski NS. Conf Proc IEEE Eng Med Biol Soc. Chicago: 2014. Augmenting Muscle Force by Low Rate Proximal Nerve Stimulation. [Google Scholar]
- Crago PE, Makowski NS. Alteration of neural action potential patterns by axonal stimulation: the importance of stimulus location. J Neural Eng. doi: 10.1088/1741-2560/11/5/056016. accepted. [DOI] [PMC free article] [PubMed] [Google Scholar]
- Daly JJ, Hogan N, Perepezko EM, Krebs HI, Rogers JM, Goyal KS, Dohring ME, Fredrickson E, Nethery J, Ruff RL. Response to upper-limb robotics and functional neuromuscular stimulation following stroke. J Rehabil Res Dev. 2005;42:723–36. doi: 10.1682/jrrd.2005.02.0048. [DOI] [PubMed] [Google Scholar]
- De Luca CJ, Contessa P. Hierarchical control of motor units in voluntary contractions. J Neurophysiol. 2012;107:178–195. doi: 10.1152/jn.00961.2010. [DOI] [PMC free article] [PubMed] [Google Scholar]
- Dengler R, Stein RB, Thomas CK. Axonal conduction velocity and force of single human motor units. Muscle Nerve. 1988;11:136–45. doi: 10.1002/mus.880110209. [DOI] [PubMed] [Google Scholar]
- Eccles JC. The central action of antidromic impulses in motor nerve fibres. Pflugers Archiv : European journal of physiology. 1955;260:385–415. doi: 10.1007/BF00363548. [DOI] [PubMed] [Google Scholar]
- Fuglevand AJ, Winter DA, Patla AE. Models of Recruitment and Rate Coding Organization in Motor-Unit Pools. J Neurophysiol. 1993;70:2470–2488. doi: 10.1152/jn.1993.70.6.2470. [DOI] [PubMed] [Google Scholar]
- Gemperline JJ, Allen S, Walk D, Rymer WZ. Characteristics of motor unit discharge in subjects with hemiparesis. Muscle Nerve. 1995;18:1101–14. doi: 10.1002/mus.880181006. [DOI] [PubMed] [Google Scholar]
- Gregory CM, Bickel CS. Recruitment patterns in human skeletal muscle during electrical stimulation. Phys Ther. 2005;85:358–64. [PubMed] [Google Scholar]
- Hara Y, Masakado Y, Chino N. The physiological functional loss of single thenar motor units in the stroke patients: when does it occur? Does it progress? Clin Neurophysiol. 2004;115:97–103. doi: 10.1016/j.clinph.2003.08.002. [DOI] [PubMed] [Google Scholar]
- Herbert RD, Gandevia SC. Twitch Interpolation in Human Muscles: Mechanisms and Implications for Measurement of Voluntary Activation. J Neurophysiol. 1999;82:2271–2283. doi: 10.1152/jn.1999.82.5.2271. [DOI] [PubMed] [Google Scholar]
- Keenan KG, Farina D, Maluf KS, Merletti R, Enoka RM. Influence of amplitude cancellation on the simulated surface electromyogram. J Appl Physiol. 2005;98:120–31. doi: 10.1152/japplphysiol.00894.2004. [DOI] [PubMed] [Google Scholar]
- Knaflitz M, Merletti R, De Luca CJ. Inference of motor unit recruitment order in voluntary and electrically elicited contractions. J Appl Physiol. 1990;68:1657–1667. doi: 10.1152/jappl.1990.68.4.1657. [DOI] [PubMed] [Google Scholar]
- Knutson JS, Harley MY, Hisel TZ, Makowski NS, Chae J. Contralaterally controlled functional electrical stimulation for recovery of elbow extension and hand opening after stroke: a pilot case series study. Am J Phys Med Rehabil. 2014;93:528–39. doi: 10.1097/PHM.0000000000000066. [DOI] [PMC free article] [PubMed] [Google Scholar]
- Knutson JS, Hisel TZ, Harley MY, Chae J. A novel functional electrical stimulation treatment for recovery of hand function in hemiplegia: 12-week pilot study. Neurorehabil Neural Repair. 2009;23:17–25. doi: 10.1177/1545968308317577. [DOI] [PMC free article] [PubMed] [Google Scholar]
- Langzam E, Nemirovsky Y, Isakov E, Mizrahi J. Partition between volitional and induced forces in electrically augmented dynamic isometric muscle contractions. IEEE Trans Neural Syst Rehabil Eng. 2006;14:322–35. doi: 10.1109/TNSRE.2006.881591. [DOI] [PubMed] [Google Scholar]
- Langzam E, Nemirovsky Y, Isakov E, Mizrahi J. Muscle enhancement using closed-loop electrical stimulation: volitional versus induced torque. J Electromyogr Kinesiol. 2007;17:275–84. doi: 10.1016/j.jelekin.2006.03.001. [DOI] [PubMed] [Google Scholar]
- Lee HJ, Cho KH, Lee WH. The effects of body weight support treadmill training with power-assisted functional electrical stimulation on functional movement and gait in stroke patients. Am J Phys Med Rehabil. 2013;92:1051–9. doi: 10.1097/PHM.0000000000000040. [DOI] [PubMed] [Google Scholar]
- Lertmanorat Z, Gustafson KJ, Durand DM. Electrode array for reversing the recruitment order of peripheral nerve stimulation: experimental studies. Ann Biomed Eng. 2006;34:152–60. doi: 10.1007/s10439-005-9012-5. [DOI] [PubMed] [Google Scholar]
- Makowski N, Knutson J, Chae J, Crago P. Interaction of poststroke voluntary effort and functional neuromuscular electrical stimulation. J Rehabil Res Dev. 2013;50:85–98. doi: 10.1682/jrrd.2011.04.0068. [DOI] [PMC free article] [PubMed] [Google Scholar]
- Mottram CJ, Heckman CJ, Powers RK, Rymer WZ, Suresh NL. Disturbances of motor unit rate modulation are prevalent in muscles of spastic-paretic stroke survivors. J Neurophysiol. 2014;111:2017–28. doi: 10.1152/jn.00389.2013. [DOI] [PMC free article] [PubMed] [Google Scholar]
- Perumal R, Wexler AS, Kesar TM, Jancosko A, Laufer Y, Binder-Macleod SA. A phenomenological model that predicts forces generated when electrical stimulation is superimposed on submaximal volitional contractions. J Appl Physiol. 2010;108:1595–604. doi: 10.1152/japplphysiol.01231.2009. [DOI] [PMC free article] [PubMed] [Google Scholar]
- Suresh N, Li X, Zhou P, Rymer WZ. Examination of motor unit control properties in stroke survivors using surface EMG decomposition: a preliminary report. Conf Proc IEEE Eng Med Biol Soc. 2011;2011:8243–6. doi: 10.1109/IEMBS.2011.6092032. [DOI] [PubMed] [Google Scholar]
- Thomas CK, Bakels R, Klein CS, Zijdewind I. Human spinal cord injury: motor unit properties and behaviour. Acta Physiol (Oxf) 2014;210:5–19. doi: 10.1111/apha.12153. [DOI] [PubMed] [Google Scholar]
- Tyler DJ, Durand DM. Functionally selective peripheral nerve stimulation with a flat interface nerve electrode. IEEE Trans Neural Syst Rehabil Eng. 2002;10:294–303. doi: 10.1109/TNSRE.2002.806840. [DOI] [PubMed] [Google Scholar]
- Yeom H, Chang YH. Autogenic EMG-controlled functional electrical stimulation for ankle dorsiflexion control. J Neurosci Methods. 2010;193:118–25. doi: 10.1016/j.jneumeth.2010.08.011. [DOI] [PMC free article] [PubMed] [Google Scholar]
- Zhou P, Rymer WZ. MUAP number estimates in surface EMG: template-matching methods and their performance boundaries. Ann Biomed Eng. 2004;32:1007–15. doi: 10.1023/b:abme.0000032463.26331.b3. [DOI] [PubMed] [Google Scholar]
- Zhou P, Suresh NL, Rymer WZ. Model based sensitivity analysis of EMG-force relation with respect to motor unit properties: applications to muscle paresis in stroke. Ann Biomed Eng. 2007;35:1521–31. doi: 10.1007/s10439-007-9329-3. [DOI] [PubMed] [Google Scholar]
- Zijdewind I, Van Duinen H, Zielman R, Lorist MM. Interaction between force production and cognitive performance in humans. Clin Neurophysiol. 2006;117:660–7. doi: 10.1016/j.clinph.2005.11.016. [DOI] [PubMed] [Google Scholar]
Associated Data
This section collects any data citations, data availability statements, or supplementary materials included in this article.