

Abstract
We describe a general framework for constructing two-dimensional crystals with prescribed depth and sophisticated three-dimensional features. These crystals may serve as scaffolds for the precise spatial arrangements of functional materials for diverse applications. The crystals are self-assembled from single-stranded DNA components called DNA bricks. We demonstrate the experimental construction of DNA brick crystals that can grow to micron-size in the lateral dimensions with precisely controlled depth up to 80 nanometers. They can be designed to display user-specified sophisticated three-dimensional nanoscale features, such as continuous or discontinuous cavities and channels, and to pack DNA helices at parallel and perpendicular angles relative to the plane of the crystals.
The production of two-dimensional materials, particularly crystals with prescribed depths and intricate three-dimensional (3D) features, provides an enabling platform for nanofabrication. For example, these two-dimensional (2D) crystals could be integrated with inorganic nanomaterials for developing complex nanoelectronics1 and photonics systems.2,3 Although thin film structures have been created using either electron/ion beam lithography3 or self-assembly of block co-polymers,4,5 fabricating two-dimensional materials that simultaneously achieve precisely tunable thickness, and prescribed complex surface and internal features (e.g. channels or pores) with sub-5 nm resolution remains challenging.3,6–8
A promising route to address this challenge is structural DNA nanotechnology.9 DNA has been used to create complex discrete shapes9–25 and extended periodic crystals,26–38 including ribbons,33 tubes,27,32,33,35 two-dimensional crystals,18,26–32,36–38 and three-dimensional crystals.34 DNA structures can serve as scaffolds for precise patterning of functional moieties (e.g. gold nanoparticles) for electronics and photonics applications.35,39,40 However, in contrast to current organic polymeric films,41 the two-dimensional DNA crystals are typically restricted to a single-layer of DNA helices with about 2 nanometer depth. A 3D crystal was previously reported but it grows in all three dimensions with no control in depth and uses a small triangular repeating unit.34 One major categorical gap in constructing atomically precise DNA structures – and, more generally, synthetic molecular structures – is the lack of a general framework for making complex 2D crystals with precisely controlled depth and sophisticated three-dimensional features. Successful construction of such structures could enable a wide range of applications ranging from nanoelectronics and plasmonics to biophysics and molecular diagnosis.
Using single-stranded DNA bricks,21,22,33 we describe here a simple, robust, and general approach to engineer complex micron-sized two-dimensional crystals with prescribed depths and complex three-dimensional features with nanometer resolution. In previous reports,26–32,34–38 DNA crystals are typically formed via a two-stage hierarchical process: individual strands first assemble into a discrete building block (often known as a DNA tile) and individual tiles then assemble into crystals. In contrast, DNA brick crystals grow non-hierarchically: the growth of DNA crystals from short, floppy, single-stranded DNA bricks does not involve the assembly of pre-formed discrete multi-stranded building blocks with well-defined shapes. During the brick crystal growth, assembly and disassembly occur by relatively weak intermolecular interactions involving addition or subtraction of a single short strand at a time.
We constructed a total of 32 DNA brick crystals. These crystals can grow up to several microns in the lateral dimensions with a prescribed depth up to 80 nanometers, and display sophisticated user-specified nanometer scale three-dimensional features, including intricate cavities, channels, and tunnels (Supplementary Fig. S1). Additionally, the non-hierarchical nature of the assembly permits isothermal formation of the crystals. We illustrated the scaffolding utility of these crystals by functionalizing them with parallel arrays and layers of tightly-packed (1–2 nm spaced) gold nanoparticles.
Design and assembly of DNA-brick crystals
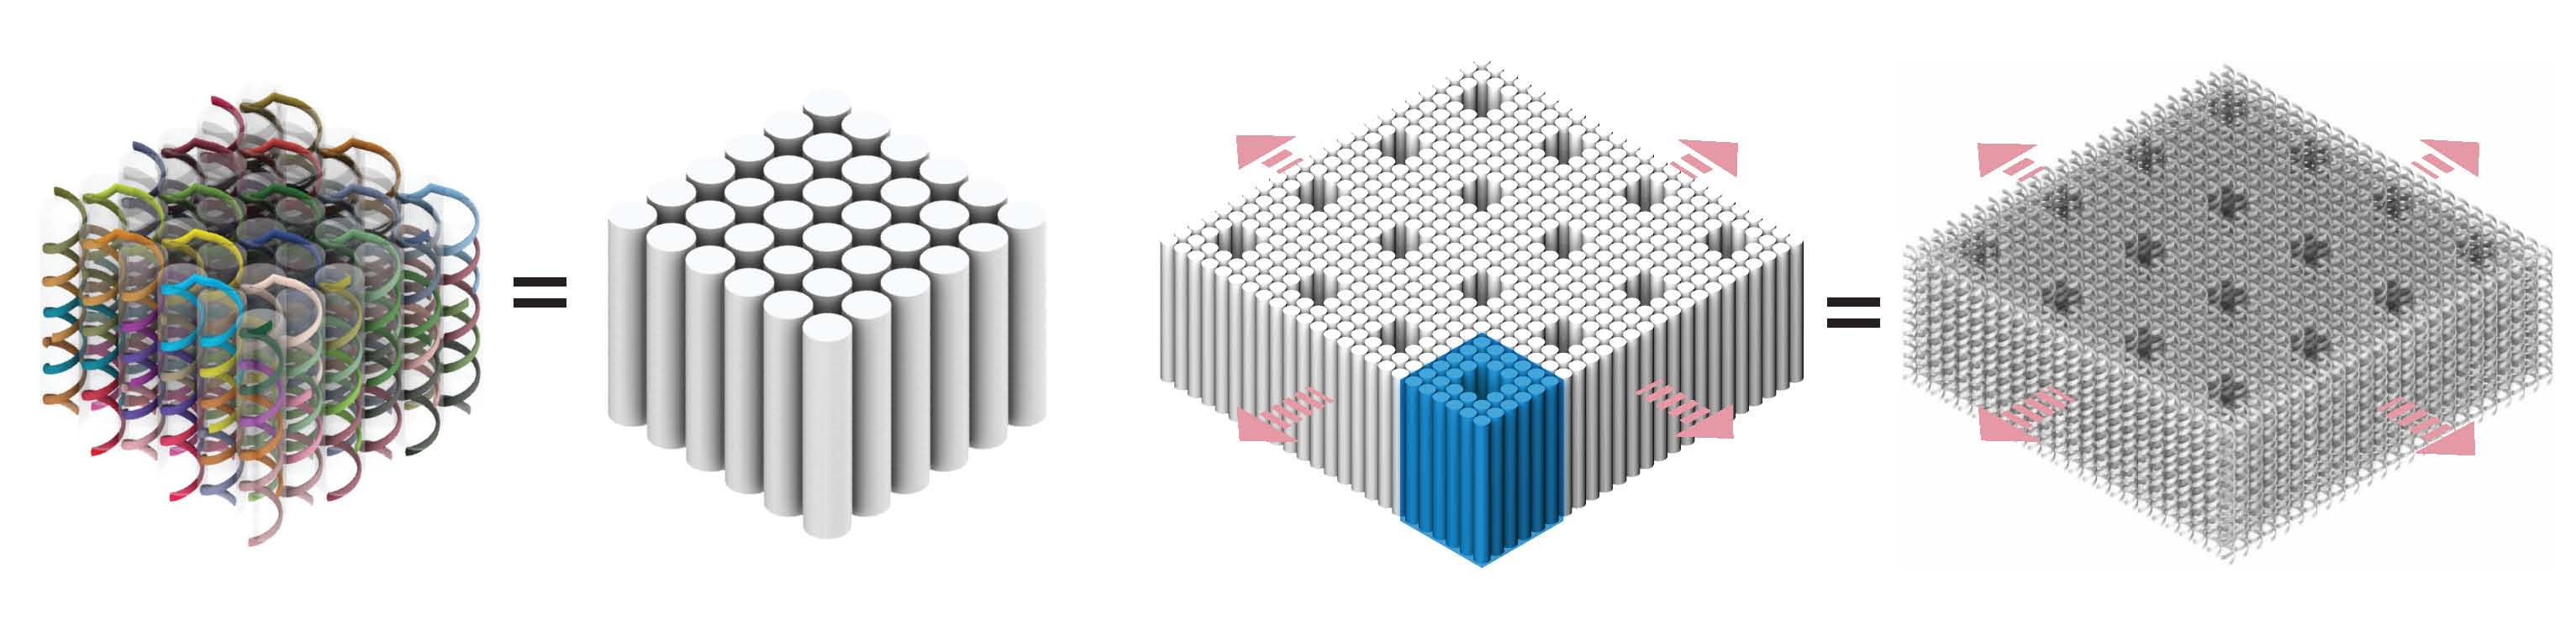
Crystal design is based on previous discrete three-dimensional DNA-brick structures.22 A DNA brick is a 32-nucleotide (nt) strand with four 8-nt binding domains, and can be modeled as a LEGO-like brick (Fig. 1a). In a one-step annealing reaction, DNA bricks – each with a distinct sequence – assemble into a prescribed structure by binding to their designated neighbors. Implementing “connecting” bricks between discrete structures yields DNA-brick crystals. The design strategy is illustrated using a 6H (helix) × 6H (helix) × 24B (basepair) cuboid structure that can be programmed to grow along three orthogonal axes (Fig. 1b). To achieve homo-multimerization along the Z-axis (i.e. parallel to helical axes), the first layer of domains are modified to be complementary to the last layer of domains. Homomultimerization along the X-axis or Y-axis is achieved by including bricks that each has two of its domains bound to one face of the cuboid and the other two domains to the opposing face. See Supplementary Fig. S2 for detailed strand connecting patterns. The crystals are designed to form via non-hierarchical growth: individual bricks (rather than pre-formed multi-brick blocks) are directly incorporated into the crystal (Fig. 1c).
Fig. 1. Design of DNA-brick crystals.
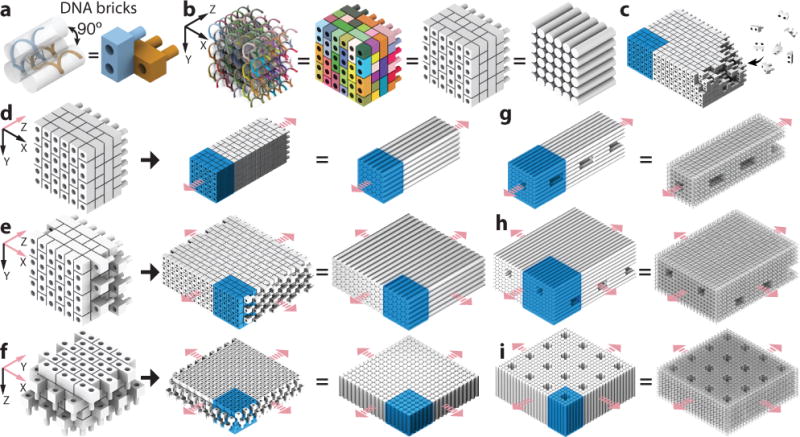
a, A strand (left) and a brick (right) model showing two 32-nt DNA bricks that form a 90° angle. b, Models of a 6H (helix) × 6H (helix) × 24B (basepair) cuboid with increasing levels of abstraction: a strand (leftmost) and a brick model where colors distinguish brick species, a brick model with all bricks colored grey, and a model where cylinders representing DNA double-helices. c, Individual DNA strands, rather than pre-assembled multi-brick blocks, are directly incorporated into the growing crystal. d to f, Brick and cylinder models of a 1D Z-crystal (d), a 2D ZX-crystal (e), and a 2D XY-crystal (f) designed from the 6H×6H×24B cuboid. g to i, Cylinder and DNA-helix models of crystals with pores and tunnels. g, A Z-crystal with a tunnel and periodic pores. h, A ZX-crystal with two groups of parallel tunnels. i, An XY-crystal with periodic pores. Repeating units of the crystals are denoted using blue-colored boxes. Pink arrows indicate the directions of crystal growth.
We constructed four groups of crystals: (1) Z-crystals: one-dimensional “DNA-bundle” crystals extending along the Z-axis (Fig. 1d); (2) X-crystals: one-dimensional crystals extending along the X-axis; (3) ZX-crystals: two-dimensional “multilayer” crystals extending along the Z-axis and the X-axis (Fig. 1e); (4) XY-crystals: two-dimensional “DNA-forest” crystals extending along the X-axis and Y-axis (Fig. 1f). Using different designs of repeating units, DNA crystals with prescribed depths and features, such as pores, channels, and tunnels, can be made (Fig. 1g to 1i). Here we define a channel as a surface-exposed cavity extending across multiple repeating units, a pore as a hole across a single repeating unit, and a tunnel as a series of concatenated pores. A crystal is named as “[the growth direction(s)]-[the dimensions of the repeating-unit]-[the shape of the unit]”. For instance, an “XY6H×6H×24B-cuboid” crystal is a two-dimensional XY-crystal with a cuboid-shaped 6H×6H×24B repeating unit. Like discrete DNA-brick structures,22 the sequences for DNA-brick crystals were randomly generated. All crystals used 10.67 base-pair (bp)/turn reciprocal twist density which is slightly under-wound compared to the 10.5 bp/turn of natural B-form DNA.
Each crystal was assembled by mixing 100 nM of each unpurified DNA brick strand in 40 mM MgCl2, without careful adjustment of strand stoichiometry. After 72-hour or 168-hour one-pot annealing, assembled crystals were imaged using transmission electron microscopy (TEM), cryo-electron microscopy (cryo-EM), or atomic force microscopy (AFM) without further purification. See Methods for details.
One-dimensional DNA-bundle crystals (Z-crystals)
Both solid Z-crystals (Fig. 2a–f) and Z-crystals with tunnels (Fig. 2g–i) were successfully constructed.
Fig. 2. One-dimensional DNA crystals.
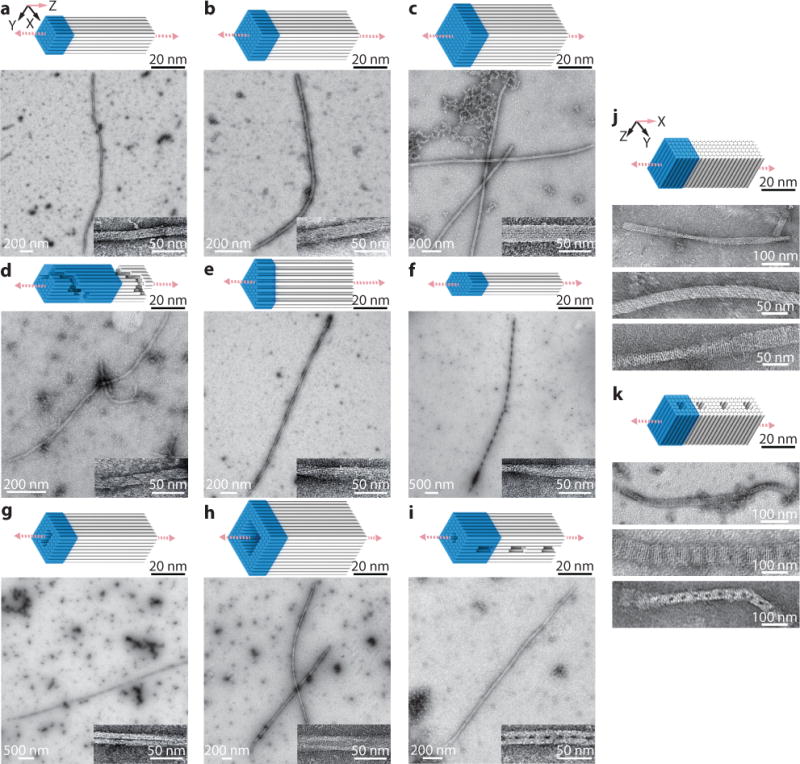
a to i, Z-crystals with cylinder models and TEM images. a to c, Z-crystals with solid cross-sections: 6H×6H (a), 8H×8H (b), and 10H×10H (c) Z-crystals. d to f, Z-crystals with different cross-sectional shapes: an 8H×8H Z-crystal with right-handed spiral channel (d), a 43H Z-crystal with triangle-shaped cross-section (e), and a 44H Z-crystal with hexagon-shaped cross-section (f). g to i, Z-crystals with porous cross-sections: an 8H×8H Z-crystal with a 2H×4H tunnel (g), a 12H×12H Z-crystal with a 6H×6H tunnel (h), and an 8H×8H Z-crystal with a 2H×2H tunnel and perpendicular 8H×2H×24B pores (i). j and k, cylinder models (top) and TEM images (bottom) of X-crystals. j, an X-6H×6H×64B-cuboid crystal. k, a 6H×6H X-crystal with 2H×2H pores. Unit cells of crystals are denoted using blue-colored boxes. See Supplementary Figs. S3 to S12 for more TEM images.
Solid Z-crystals with different cross-sectional shapes
We first constructed three solid Z-crystals with distinct square-shaped cross-sections (6H×6H×32B, 8H×8H×32B, and 10H×10H×32B; Fig. 2a–c). We then demonstrated crystals with more complex cross-sections: a Z-8H×8H×128B-spiral crystal with a surface helical channel along the Z-axis (Fig. 2d), a Z-43H×32B-triangle crystal (Fig. 2e), and a Z-44H×32Bhexagon crystal (Fig. 2f). The spiral channel was clearly visible in the TEM image of the Z-8H×8H×128B-spiral crystal. However, many broken structures were also observed for this spiral crystal (Supplementary Fig. S6).
Z-crystals with tunnels
Three Z-crystals with tunnels were tested (Fig. 2g–i). The cross-section of the Z-56H×32B-tunnel is an 8H×8H square with a 2H×4H rectangle removed from the center (Fig. 2g). The Z-108H×32B-tunnel has a 12H×12H square cross-section with a 6H×6H hole (Fig. 2h). The Z60H×64B-tunnel crystal contains a 2H×2H tunnel along the Z-axis and 8H×2H×24B pores that intersect the 2H×2H tunnel every 64bp along the Z-axis (Fig. 2i). TEM images of the Z-60H×64B-tunnel showed many splintered structures containing only half of the designed DNA helices, likely reflecting the weakening effect of the periodic 8H×2H×24B pores on the connections between the top and bottom halves of the structures along the Y-axis.
All Z-crystals displayed a global right-handed twist, which likely resulted from the stress generated by the underwound design.17,42 Zoomed-out TEM images of Z-crystals are included in Supplementary Figs. S3 to S11.
One-dimensional X-crystals
We constructed two 1D-crystals that extended along the X-axis: an X-6H×6H×64B-cuboid crystal (Fig. 2j) and an X-32H×64B-pore crystal (Fig. 2k). Both appeared well-formed and grew up to a few hundred nanometers in length in TEM images. See Supplementary Fig. S12 for larger images.
Two-dimensional DNA-multilayer crystals (ZX-crystals)
Solid ZX-crystals (Fig. 3a–d), ZX-crystals with channels, pores, and tunnels (Fig. 3e–h), and an offset ZX-crystal (Fig. 3i) were successfully constructed.
Fig. 3. Two-dimensional multilayer ZX-crystals.
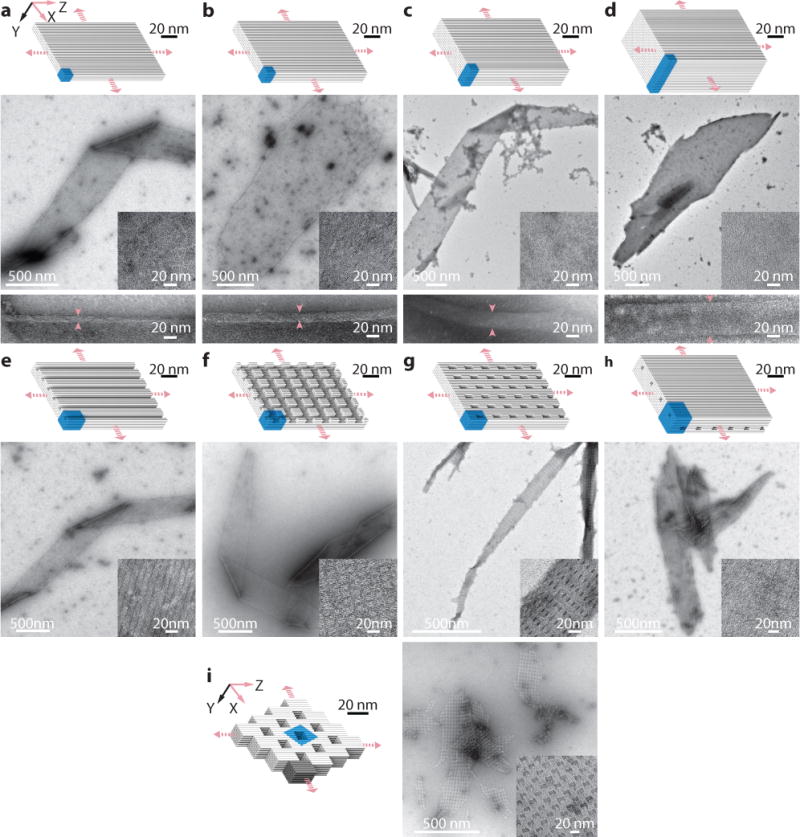
Cylinder models (top) and TEM images (bottom) are shown for each crystal. a to d, Solid ZX-crystals: 4-layer (a), 6-layer (b), 10-layer (c), and 20-layer (d), solid ZX-crystals. Arrows indicate the positions for the thickness measurement of the crystals. e to h, ZX-crystals with channels, pores, and tunnels: 6-layer crystal with 2H×2H parallel channels (e), 6-layer crystal with two groups of crossing channels – 2H×2H channels that run parallel to the DNA helical axis and 2H×32B channels that run perpendicular to the DNA helical axis (f), 6 layer crystal with 2H×6H×32B pores (g), and 10 layer crystal with two groups of non-contacting tunnels – 2H×2H tunnels parallel to the DNA helical axis and 2H×24B tunnels perpendicular to DNA helical axis (h). In h, the two groups of tunnels are separated by two layer of DNA helices. i, An offset-ZX-6H×6H×64B-cuboid ZX-crystal. The dark grey part represents a 6H×6H×64B-cuboid repeating unit. Unit cells of crystals are denoted using blue-colored boxes. See Supplementary Figs. S13 to S21 for more TEM images.
Solid ZX-crystals
Four solid ZX-crystals were designed from 4H×32B units that contained 4, 6, 10, and 20 layers of helices, respectively (Fig. 3a–d). The thickness of each ZX-crystals was directly measured at the crease where the crystal folded over onto itself in TEM images. The thicknesses of the 4, 6, 10, and 20-layer ZX-crystals were measured to be approximately 10, 15, 25 and 50 nm, respectively, proving all layers of the crystals were completely formed and that the width of each DNA helix was about 2.5 nm in diameter.
ZX-crystals with channels, pores, and tunnels
We first designed three ZX-crystals from a 6H×6H×32B cuboid unit (Fig. 3e–g). Four helices were removed from the cuboid to generate ZX-32H×64B-channel (Fig. 3e). The second design, ZX32H×64B-cross-channel, was obtained by further removing a perpendicular 2H×32B channel from ZX-32H×64B-channel (Fig. 3f). The third design, ZX-6H×6H×64B-pore, contained a 2H×4H×32B vertical pore along the Y-axis in each cuboid unit (Fig. 3g). This design yielded narrow and long crystals. The most complex ZX-crystal design is the ZX-96H×64B-crosstunnel crystal (Fig. 3h). Its repeating unit can be considered as a 10H×10H×64B cuboid with a 2H×2H×64B pore along the Z-axis and with a 10H×2H×24B pore along the X-axis. In this structure, the design contained two types of parallel tunnels separated by two layers of DNA. These tunnels appeared perpendicular when viewed from the ZX projection.
Offset 2D ZX-crystal
We constructed a ZX-crystal that extended 6H×6H×64B-cuboid repeating units along the Z-axis and X-axis using an “offset-register” scheme: the crystal’s Z-axis extension was shifted 4H along the X-axis; the crystal’s X-axis extension was shifted 32B along the Z-axis (Fig. 3i).
All ZX-crystals showed a small amount of right-handed twist, which also likely arose from the 10.67 bp/turn under-wound design. As a result, we observed that the crystals sometimes appeared twisted and folded on top of themselves in TEM images. We also observed that all ZX-crystals grew faster along the Z-axis than the X-axis, consistent with observations from previous crystal growth studies.26 See Supplementary Figs. S13 to S21 for more TEM images.
Two-dimensional DNA-forest crystals (XY-crystals)
We constructed solid XY-crystals (Fig. 4a–d), XY-crystals with pores and surface channels (Fig. 4e–i), and XY-crystals that form a tube structure (Fig. 4j).
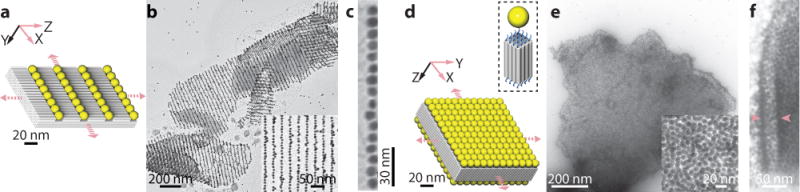
Fig. 4. Two-dimensional DNA-forest XY-crystals.
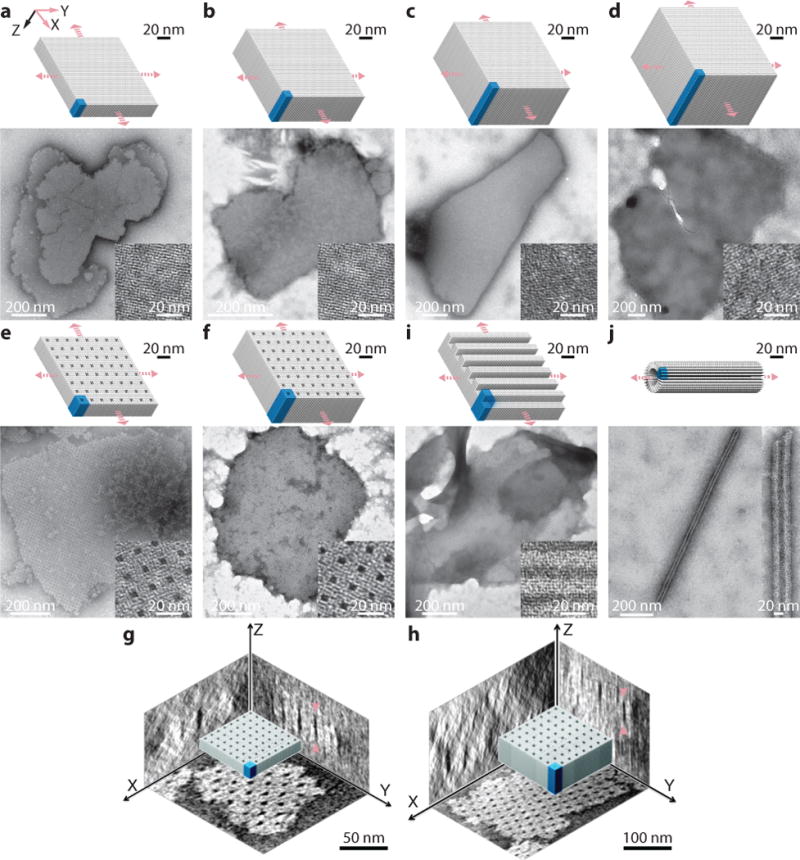
Cylinder models (top) and TEM images (bottom) are shown for each crystal. a to d, Solid XY-crystals: 64B (a), 128B (b), 192B (c), and 256B (d) solid XY-crystals designed from a 4H×4H cuboid. e and f, XY-crystals with pores: a 32×64B-pore XY-crystal with 2H×2H×64B parallel pores (e) and a 32H×128B-pore XY-crystal with 2H×2H×128B parallel pores (f). g and h, Cryo-EM 3D reconstruction images showing the three projections of the XY-32H×64B-pore crystal (g) and the XY-32H×128B-pore crystal (h). Arrows indicate the positions for thickness measurements. i, A 96B XY-crystal with 4H×32B parallel channels. j, A tube crystal formed by 32B helices with helical axis perpendicular to the tube axis. Unit cells of crystals are denoted using blue-colored boxes. See Supplementary Figs. S25 to S34 for more TEM images.
Solid XY-crystals
Solid XY-crystals of variable thicknesses constructed (Fig. 4a–d). Using a 4H×4H cuboid unit of various heights, we constructed four XY-crystals with 64B (21 nm), 128B (42 nm), 192B (63 nm), and 256B (84 nm) designed thickness.
XY-crystals with pores and channels
XY-32H×64B-pore and XY-32H×128B-pore crystals were constructed (Fig. 4e, h). Both designs contained periodic 2H×2H pores separated by 4H in each dimension. The two crystals resemble 21 and 42 nm porous membranes, respectively. Cryo-EM imaging was applied to these two crystals (Supplementary Fig. S22). Based on 3D reconstruction data, their depths were measured to be 26±2 nm (32H×64B-pore) and 45±3 nm (32H×128B-pore), respectively (Fig. 4g, h), in good agreement with the theoretical values (21 nm and 42 nm). The slight discrepancy is likely because theoretical estimations did not account for the single-stranded poly-T at the ends of the duplex. The depth of these two crystals were also measured by AFM to be approximately 16 nm and 36 nm, respectively (Supplementary Fig. S23). The smaller depths obtained from AFM likely reflects the compression of the crystal by the cantilever.
An XY-4H×8H×96B-channel crystal was constructed (Fig. 4g). It contained a solid 64B (42 nm) base and parallel channels. The channels are 4H (10 nm) in width and 32B (21 nm) in height, and are separated by 4 layers of helices.
A tube-shaped XY-crystal
An XY-4H×4H×32B-tube crystal (Fig. 4h) was designed using the same strategy as the other XY-crystals. However, when assembled in 40 mM MgCl2, this thin 32B (10.6 nm) XY-crystal formed a tube (Supplementary Figs. S24 and S25) instead of a flat 2D crystal, likely due to the uneven distribution of connections between helices (Supplementary Fig. S24).
Annealing the XY-4H×4H×32B-tube at higher MgCl2 concentration produced tubes with larger diameters, presumably due to a greater reduction in repulsion between negatively-charged DNA helices. At 60 mM MgCl2, we observed many tubes with diameters between 140 and 300 nm (Supplementary Fig. S26). To further test our hypothesis that the tube formation is caused by the asymmetric distribution of crossovers, we designed an XY-4H×4H×32B-cuboid crystal in which the DNA bricks are arranged in an alternating fashion between layers.22 Connections between helices in this design were symmetrically distributed along both the X-axis and Y-axis (Supplementary Fig. S65). This alternating design produced only flat crystal structures (Supplementary Fig. S27). Additionally, the thicker 64, 128, 192, and 256B XY-crystals with non-alternating designs had 2, 4, 6, and 8 connections between each pair of neighboring helices, respectively. No visible curvature was observed for these designs in TEM images (Supplementary Figs. S28 to S31).
General observations
Unlike the ZX-crystals, the XY-crystals did not show global right-handed twist. The lack of global twist can be explained by the following analysis. For simplicity, assuming an XY-crystal forms a perfect cylinder containing n helices. The overall twist in radians of the cylinder is θ = TL/JG, where T is the applied torque resulting from the underwound design, L is helix length, G is the modulus rigidity of a helix, and J is the torsion constant. The first three parameters can be considered as constants. The torsion constant J for a cylinder as a function of cross-sectional (XY-plane) radius can be approximated as πr4/2 (r4 is proportional to n2), where r is the circular cross-sectional radius. Thus, θ is inversely proportional to n2. As an XY-crystal grows to include a large number of helices, its global twist θ rapidly becomes negligible.
As both growth directions (X-axis and Y-axis) for an XY-crystal is perpendicular to the DNA helical axis, the XY-crystal grew in an isotropic fashion and did not exhibit any apparent directional preference. Because crystal growth along the X-axis or Y-axis is slower than growth along Z-axis (as discussed for ZX-crystals), the 72-hour annealing often produces either no XY-crystals or XY-crystals smaller than one hundred nanometers in the lateral dimensions. Therefore, we used a 168-hour annealing ramp for all XY-crystals.
XY-crystals provide a particularly attractive platform for DNA-directed guest molecule assembly: the surface of an XY-crystal can be considered as a “breadboard”13 on which guest molecules can be conveniently attached to the ends of DNA helices at 2.5 nm resolution in the lateral plane.
See Supplementary Figs. S25 to S34 for more TEM images of XY-crystals.
Crystal growth mechanism
The non-hierarchical growth mechanism of DNA brick crystals is verified by the following experiments: (1) Analysis of the boundaries of DNA brick crystals based on high-resolution TEM images revealed that these crystals lack well defined, complete structural repeating units on their boundaries; (2) Annealing profile of the formation of the crystals revealed a single transition temperature (rather than two or more transition temperatures characteristic of hierarchically formed DNA crystals32,36); (3) Time-lapse analysis of the TEM images and gel electrophoresis of the assembly process revealed the absence of repeating units of designed size.
Boundary analysis
We studied the edge of the XY-32H×64B-pore crystal by counting the number of units that match with that of the designed repeating unit (Supplementary Fig. S35). In hierarchically-assembled crystals, the designed repeating units are first formed before they are assembled into a crystal. As a result, the edges of the crystal often consist of the shape of the designed repeating unit (e.g. >90% of the edges of a previously reported hierarchically-assembled crystal36 [Supplementary Fig. S36]). In contrast, only 2% of the edges of the XY-32H×64B-pore brick crystal match that of the designed shape (Supplementary Fig. S37), consistent with a non-hierarchical assembly mechanism. See Supplementary Sect. S6.1 for more details.
Annealing curve
To study the annealing profile of the brick crystals, we assembled the ZX-4H×20H×32B and XY-32H×64B-pore crystals in the presence of SYBR Green I (Supplementary Figs. S38 and S39). Annealing curves for both brick crystals depict a single, sharp transition peak, which occurred around 40°C for the ZX-crystal (Supplementary Fig. S38b, c) and 30°C for the XY-crystal (Supplementary Fig. S39b, c), consistent with a non-hierarchical assembly process where individual component strands are directly incorporated into the lattices. See Supplementary Sect. S6.2 for more details.
Time lapse analysis with gel electrophoresis and TEM
Time-points before, at, and after the transition temperature were sampled for both the above two ZX-and XY-crystals to confirm the lack of well-formed, discrete repeating units. Gel electrophoresis showed no intermediate band between the well and monomers (Supplementary Figs. S38d, S39d), as expected. Although TEM imaging revealed some small, randomly sized and shaped clusters of strands, no uniformly sized and shape-defined structures were observed, supporting the designed non-hierarchical assembly mechanism (Supplementary Figs. S38e, S39e). See Supplementary Sect. S6.2 for more details.
Isothermal assembly
The single transition temperature of the DNA-brick crystallization suggests that these crystals should be able to assemble isothermally. Thus, we assembled a ZX-6H×4H×96B-cuboid crystal isothermally at the observed annealing transition temperature of 33°C (Fig. 5a and Supplementary Fig. S40c). Gel electrophoresis showed no discrete monomer band during annealing (Supplementary Fig. S40d). Time-lapse TEM images further supported the non-hierarchical assembly mechanism: structures around 100 nm in size appeared after 4 hours and rapidly grew to micron-sized structures by 48 hours (Fig. 5c). See Supplementary Sect. S6.3 for more details.
Fig. 5. Isothermal assembly of brick crystals.
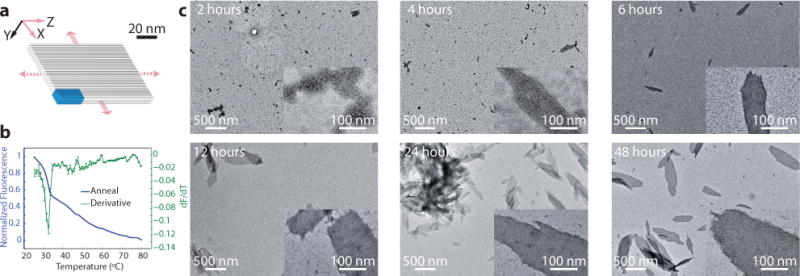
a, A cylinder model of a ZX-6H×4H×96B crystal. b, Annealing curve (blue) with the derivative of the fluorescence with respect to temperature (green) of the ZX-6H×4H×96B crystal. Annealing curves were obtained in the presence of 0.3× SYBR Green I at 500 nM of each strand. Error bars represent standard error from the mean acquired from 3 measurements. c, TEM images of the ZX-6H×4H×96B crystal incubated at 33°C for various durations. Samples were diluted four times before deposition on the TEM grid.
Yield and defect analysis
We used crystal deposition density and strand depletion ratio to study the approximate yield of the brick crystals: after four-times dilution, an isothermally-assembled ZX-6H×4H×96B sample produced 0.23 structures per μm2 on a TEM grid (Supplementary Fig. S41); Förster Resonance Energy Transfer analysis of dye-labeled ZX-6H×6H×64B sample suggests 80% strand depletion ratio (Supplementary Figs. S42). Analysis of the pore morphology of XY-32H×64B-pore TEM images indicates a 9% defect rate (Supplementary Fig. S43). See Supplementary Sect. S7 for more details.
Patterning gold nanoparticles
Gold nanoparticles have been previously arranged into discrete patterns39,40,43 and single-layer periodic patterns35 using DNA structures as templates. However, it remains challenging to form close-packed periodic patterns, especially multi-layer patterns, of gold nanoparticles. This challenge is addressed here using DNA crystals. We constructed two close-packed gold nanoparticle superstructures on DNA-brick crystals: (1) parallel lines of gold particles arranged on a ZX-4H×6H×96channel crystal (Supplementary Fig. S44) spaced on average 2 nm apart (Fig. 6a, b), and (2) parallel gold-nanoparticle monolayers, with each particle spaced on average 1 to 2 nm apart, on an XY-4H×4H×64-cuboid (Fig. 6c–e). Aligning gold nanoparticles into micron-scale ordered arrays is required in diverse plasmonic applications. In particular, nanoparticle arrays with sub-2-nm face-to-face spacing are expected to exhibit strong plasmonic coupling.44 See Supplementary Sect. S8 for more experimental details.
Fig. 6. Gold nanoparticles patterned using DNA-brick crystals.
a to c, Model (a) and TEM images (b, c) of parallel lines of 10-nanometer gold nanoparticles closely packed on a ZX-4H×6H×96-channel crystal. (c), Zoomed-in TEM image of a single chain of gold nanoparticles. d to e, Model (d) and TEM images (e, f) of close-packed gold nanoparticle monolayers formed on the top and bottom surfaces of an XY-4H×4H×64Bcuboid crystal. Inset shows the single-stranded poly-T extensions on each end of the helix and a 10 nm gold nanoparticle occupying a 4H×4H surface. f, A crystal displays curvatures on the edge. Pink arrows indicate the curved positions where the two gold nanoparticle monolayers can be seen.
Discussion
Crystallization of increasingly large macromolecular complexes can be challenging. Traditionally the process is hierarchical, i.e. the complexes incorporate into the crystal as preformed monomeric units.26–32,34–38 However, the homogeneity of complex monomers is often difficult to ensure, and the addition of a defective monomer can compromise the growth of a well-ordered crystal. Furthermore, the kinetics of joining large monomers can be slow because of their size, especially in the case when they repel each other due to like charges. Finally, effective crystallization is thought to require error correction that involves near-equilibrium incorporation and dissociation of monomers to erase defects on the path to the lowest energy state. Therefore, if the strength of the interaction between monomers is too strong, which is more likely for large structures, irreversible rather than reversible self-assembly may dominate, resulting in defective crystals.
In contrast, our DNA-brick framework explores a non-hierarchical route to crystallization that achieves reversible assembly of rapidly diffusing subcomponents without sacrificing the complexity of the larger repeating unit in the final crystals. Using a modular strategy that utilizes standardized components – such as our DNA bricks – a repeating unit can contain thousands of base pairs, enabling the implementation of designs bearing intricate features. Although we define a repeating unit for ease of design, there is no difference between bricks within each repeating unit and those that connect the repeating units, hence bricks can be added to or subtracted from the growing crystal one at a time. A corollary is that the boundary where one repeating unit begins and the next one ends is arbitrary.
Microscale two-dimensional DNA-brick crystals with prescribed depth and three-dimensional nanoscale features provide a new platform for developing diverse applications. In biophysics, host-guest two-dimensional DNA crystals could facilitate cryo-electron microscopic imaging and 3D reconstruction of protein structures.45 Thicker two-dimensional crystals are more rigid and resistant to dynamic thermal fluctuations, providing better translational alignment of proteins; their 3D cavities could potentially hold the guest molecule in a specific conformation, providing better orientational alignment within each unit cell. In photovoltaics, bottom-up self-assembly of nanomaterials, such as nanowires,46 provides a promising route to producing high efficiency photovoltaic devices. DNA-brick crystals may prove useful for self-assembling 3D nanomaterials with nanometer precision, thus achieving enhanced cooperation effects and energy conversion efficiency for photovoltaic devices. In nanofabrication, these two-dimensional DNA crystals may serve as etching masks for fabricating diverse inorganic materials based devices and circuits, providing better shape programmability than current block copolymer based masks.5
Methods
Design diagrams
DNA strand diagrams are included in Supplementary Sect. S9 (Supplementary Figs. S45 to S76).
Sample preparation
DNA strands were synthesized by Integrated DNA Technology, Inc. (www.idtdna.com). To assemble the structures, unpurified DNA strands were mixed in an equimolar stoichiometric ratio to the highest possible concentration from a 100 μM stock in 0.5 × TE buffer (5 mM Tris, pH 7.9, 1 mM EDTA) supplemented with 40 mM MgCl2.
Annealing ramps and isothermal assembly
The strand mixture was then annealed in a PCR thermo cycler using a fast linear cooling step from 80°C to 60°C over 1 hour, then a 72-hour or 168-hour linear cooling ramp from 60°C to 24°C. The annealing ramps were named according to length of the second cooling step, as 72-hour annealing or 168-hour annealing. Most ZX-crystals were folded using the 72-hour annealing, except the ZX-96H×64Bcross-tunnels which used the 168-hour annealing. All XY-crystals were folded with the 168-hour annealing. For isothermal assembly of DNA crystals, the sample solution was incubated at 33°C for up to 48 hours.
DNA modification of 10-nm gold nanoparticles
Conjugation of thiolated DNA onto 10-nm gold nanoparticles was achieved following previously reported protocol.47 In a typical experiment, 20 μL 2.5 μM phosphine-coated 10-nm gold nanoparticle was mixed with 0.5 μL 2 M NaNO3 and 0.65 μL 100 μM thiolated DNA in 0.25× TBE buffer. The reaction solution was incubated at room temperature for 36 hours in the dark. After that, the reaction solution was loaded into 1% agarose gel containing 0.5× TBE buffer. The electrophoresis was running at 95 V for 1 hour in a gel box on an ice-water bath. The purple band was recovered by pestle crushing, followed by centrifugation for 3 min at 10,000 rpm at room temperature using “Freeze ’N Squeeze” DNA Gel Extraction spin columns (Bio-Rad). Recovered DNA-modified gold nanoparticles were stored at 4°C in the dark for further use. The sequence for the thiolated DNA was: 5′-AAAAAAAAAA-/3ThioMC3-D/.
Gold nanoparticle decoration of DNA crystals
To 15 μL 400 mM NaCl solution, 0.8 μL (ZX-4H×6H×96B-channel crystal) or 0.6 μL (XY4H×4H×64B-cuboid crystal) DNA samples were added. Then 0.2 uL 95 nM 10 nm gold nanoparticles were introduced. After pipetting for 50 times, the reaction mixture was left at room temperature for three hours in the dark.
TEM imaging
For imaging, 2.5 μL of annealed sample were adsorbed for 2 minutes onto glow-discharged, carbon-coated TEM grids. The grids were then stained for 10 seconds using a 2% aqueous uranyl formate solution containing 25 mM NaOH. Imaging was performed using a JEOL JEM-1400 TEM operated at 80 kV.
Cryo-EM imaging
A5 μL droplet of the crystal sample was added onto the positively-charged carbon grids, blotted 5.5 s, and plunge-frozen in liquid ethane using a Vitrobot (FEI). Grids were then loaded into a Titan Krios transmission electron microscope (FEI), which was operated at 300 kV with nominal–3-μm defocus using a dose of 1.5 e/°A2. The specimen was tilted ~2°C increments over a total angular range of ±60°C. All of the images were kept by using automated data acquisition software. 3D reconstructions from the above tilt series were performed with the weighted back-projection method and further analysis of tomograms was done using IMOD software.48
Annealing and melting curves
500 nM of strands were folded following the annealing ramp protocol listed above in the presence of 0.3× SYBR Green I using the Eppendorf Master cycler realplex 4 PCR. Samples were read once during the first cooling step and four times during the second cooling step. Following annealing, the same samples were melted at the rate of 0.2°C/min. 9 μL samples were removed during the annealing or melting for TEM and gel electrophoresis analysis.
Agarose gel electrophoresis
Annealed samples were subjected to 1.5 or 2 percent native agarose gel electrophoresis for 2 hours (gel prepared in 0.5 × TBE buffer supplemented with 10 mM MgCl2 and 0.005% (v/v) EtBr) or 1× SYBR Safe in an ice water bath.
AFM imaging
AFM images were obtained using a MultiMode VIII SPM (Bruker) equipped with a liquid cell. 2 μL of sample was applied onto the surface of highly ordered pyrolytic graphite (HOPG), which was pretreated with ultraviolet-ozone for 30 seconds. The 50 μL of TAE buffer (12.5 mM Mg2+, 5 mM Ni+) was added into the liquid cell. And images were collected using silicon nitride cantilevers (Olympus).
Supplementary Material
Acknowledgments
This work is supported by an ONR Young Investigator Program Award N000141110914, ONR Grants N000141010827, N000141410610, N000141310593, an ARO Grant W911NF1210238, an NSF CAREER Award CCF1054898, an NSF Expedition in Computing Award CCF1317291, NSF Grants CCF1162459, CMMI1333215, CMMI1334109, CMMI1344915, an NIH Director’s New Innovator Award 1DP2OD007292, and a Wyss Institute Faculty Startup Fund to P.Y., and by a Wyss Institute Faculty Grant, ARO MURI grant W911NF1210420, ONR Grants N000014091118 and N000141010241, and an NIH Director’s New Innovator Award 1DP2OD004641 to W.M.S. L.L.O. is supported by a NSF Graduate Research Fellowship. J.S. acknowledges AUFF founding from Aarhus University and Niels Bohr Foundation from The Royal Danish Academy of Science. M.D. acknowledges financial support from the Danish National Research Foundation, and the Villum Foundation.
Footnotes
Author contributions
Y.K., L.L.O. and W.S. made equal contributions. Y.K. conceived the project, designed and performed the experiments, analyzed the data, and wrote the paper; L.L.O. and W.S. designed and performed the experiments, analyzed the data, and wrote the paper; J.S. and M.D. performed the cryo-EM and AFM experiments, analyzed the data, and wrote the paper; W.M.S discussed the results and wrote the paper; P.Y. conceived, designed, and supervised the study, interpreted the data, and wrote the paper.
Additional information
Supplementary information is available in the online version of the paper. Reprints and permission information is available online at http://www.nature.com/reprints. Correspondence and requests for materials should be addressed to P.Y. and Y.K.
Competing financial interests
The authors declare competing financial interests: a provisional US patent application has been filed.
References
- 1.Melosh NA, et al. Ultrahigh-density nanowire lattices and circuits. Science. 2003;300:112–115. doi: 10.1126/science.1081940. [DOI] [PubMed] [Google Scholar]
- 2.Qi MH, et al. A three-dimensional optical photonic crystal with designed point defects. Nature. 2004;429:538–542. doi: 10.1038/nature02575. [DOI] [PubMed] [Google Scholar]
- 3.Liu N, Hentschel M, Weiss T, Alivisatos AP, Giessen H. Three-dimensional plasmon rulers. Science. 2011;332:1407–1410. doi: 10.1126/science.1199958. [DOI] [PubMed] [Google Scholar]
- 4.Tang CB, Lennon EM, Fredrickson GH, Kramer EJ, Hawker CJ. Evolution of block copolymer lithography to highly ordered square arrays. Science. 2008;322:429–432. doi: 10.1126/science.1162950. [DOI] [PubMed] [Google Scholar]
- 5.Tavakkoli KGA, et al. Templating three-dimensional self-assembled structures in bilayer block copolymer films. Science. 2012;336:1294–1298. doi: 10.1126/science.1218437. [DOI] [PubMed] [Google Scholar]
- 6.Liu N, et al. Three-dimensional photonic metamaterials at optical frequencies. Nature Mater. 2008;7:31–37. doi: 10.1038/nmat2072. [DOI] [PubMed] [Google Scholar]
- 7.Edward EW, Montague MF, Solak HH, Hawker CJ, Nealey PF. Precise control over molecular dimensions of block-copolymer domains using the interfacial energy of chemically nanopatterned substrates. Adv Mater. 2004;16:1315–1319. [Google Scholar]
- 8.Kim SO, et al. Novel complex nanostructure from directed assembly of block copolymers on incommensurate surface patterns. Adv Mater. 2007;19:3271–3275. [Google Scholar]
- 9.Seeman NC. Nucleic acid junctions and lattices. J Theor Biol. 1982;99:237–247. doi: 10.1016/0022-5193(82)90002-9. [DOI] [PubMed] [Google Scholar]
- 10.Chen J, Seeman NC. The synthesis from DNA of a molecule with the connectivity of a cube. Nature. 1991;350:631–633. doi: 10.1038/350631a0. [DOI] [PubMed] [Google Scholar]
- 11.Fu TJ, Seeman NC. DNA double-crossover molecules. Biochemistry. 1993;32:3211–3220. doi: 10.1021/bi00064a003. [DOI] [PubMed] [Google Scholar]
- 12.Shih WM, Quispe JD, Joyce GF. A 1.7-kilobase single-stranded DNA that folds into a nanoscale octahedron. Nature. 2004;427:618–621. doi: 10.1038/nature02307. [DOI] [PubMed] [Google Scholar]
- 13.Rothemund PWK. Folding DNA to create nanoscale shapes and patterns. Nature. 2006;440:297–302. doi: 10.1038/nature04586. [DOI] [PubMed] [Google Scholar]
- 14.He Y, et al. Hierarchical self-assembly of DNA into symmetric supramolecular polyhedra. Nature. 2008;452:198–201. doi: 10.1038/nature06597. [DOI] [PubMed] [Google Scholar]
- 15.Andersen ES, et al. Self-assembly of a nanoscale DNA box with a controllable lid. Nature. 2009;459:73–76. doi: 10.1038/nature07971. [DOI] [PubMed] [Google Scholar]
- 16.Douglas SM, et al. Self-assembly of DNA into nanoscale three-dimensional shapes. Nature. 2009;459:414–418. doi: 10.1038/nature08016. [DOI] [PMC free article] [PubMed] [Google Scholar]
- 17.Dietz H, Douglas SM, Shih WM. Folding DNA into twisted and curved nanoscale shapes. Science. 2009;325:725–730. doi: 10.1126/science.1174251. [DOI] [PMC free article] [PubMed] [Google Scholar]
- 18.Woo S, Rothemund PWK. Programmable molecular recognition based on the geometry of DNA nanostructures. Nature Chemistry. 2011;3:620–627. doi: 10.1038/nchem.1070. [DOI] [PubMed] [Google Scholar]
- 19.Han D, et al. DNA origami with complex curvatures in three-dimensional space. Science. 2011;332:342–346. doi: 10.1126/science.1202998. [DOI] [PubMed] [Google Scholar]
- 20.Sobczak Jean-Philippe J, Martin Thomas G, Gerling Thomas, Dietz Hendrik. Rapid folding of DNA into nanoscale shapes at constant temperature. Science. 2012;338:1458–1461. doi: 10.1126/science.1229919. [DOI] [PubMed] [Google Scholar]
- 21.Wei B, Dai M, Yin P. Complex shapes self-assembled from single-stranded DNA tiles. Nature. 2012;485:623–626. doi: 10.1038/nature11075. [DOI] [PMC free article] [PubMed] [Google Scholar]
- 22.Ke Y, Ong LL, Shih WM, Yin P. Three-dimensional structures self-assembled from DNA bricks. Science. 2012;338:1177–1183. doi: 10.1126/science.1227268. [DOI] [PMC free article] [PubMed] [Google Scholar]
- 23.Han D, et al. DNA gridiron nanostructures based on four-arm junctions. Science. 2013;339:1412–1415. doi: 10.1126/science.1232252. [DOI] [PubMed] [Google Scholar]
- 24.Wei B, et al. Design space for complex DNA structures. J Am Chem Soc. 2013;135:18080–18088. doi: 10.1021/ja4062294. [DOI] [PMC free article] [PubMed] [Google Scholar]
- 25.Iinuma R, et al. Polyhedra self-assembled from DNA tripods and characterized with 3D DNA-PAINT. Science. 2014;344:65–69. doi: 10.1126/science.1250944. [DOI] [PMC free article] [PubMed] [Google Scholar]
- 26.Winfree E, Liu F, Wenzler LA, Seeman NC. Design and self-assembly of two-dimensional DNA crystals. Nature. 1998;394:539–544. doi: 10.1038/28998. [DOI] [PubMed] [Google Scholar]
- 27.Yan H, Park SH, Finkelstein G, Reif JH, LaBean TH. DNA-templated self-assembly of protein arrays and highly conductive nanowires. Science. 2003;301:1882–1884. doi: 10.1126/science.1089389. [DOI] [PubMed] [Google Scholar]
- 28.Liu D, Wang M, Deng Z, Walulu R, Mao C. Tensegrity: Construction of rigid DNA triangles with flexible four-arm DNA junctions. J Am Chem Soc. 2004;126:2324–2325. doi: 10.1021/ja031754r. [DOI] [PubMed] [Google Scholar]
- 29.Rothemund PWK, Papadakis N, Winfree E. Algorithmic self-assembly of DNA Sierpinski triangles. PLoS Biology. 2004;2:2041–2053. doi: 10.1371/journal.pbio.0020424. [DOI] [PMC free article] [PubMed] [Google Scholar]
- 30.He Y, Chen Y, Liu H, Ribbe AE, Mao C. Self-assembly of hexagonal DNA two-dimensional (2d) arrays. J Am Chem Soc. 2005;127:12202–12203. doi: 10.1021/ja0541938. [DOI] [PubMed] [Google Scholar]
- 31.Malo J, et al. Engineering a 2d protein-DNA crystal. Angew Chem Intl Ed. 2005;44:3057–3061. doi: 10.1002/anie.200463027. [DOI] [PubMed] [Google Scholar]
- 32.Ke Y, Liu Y, Zhang JP, Yan H. A study of DNA tube formation mechanisms using 4-, 8-, and 12-helix DNA nanostructures. J Am Chem Soc. 2006;128:4414–4421. doi: 10.1021/ja058145z. [DOI] [PubMed] [Google Scholar]
- 33.Yin P, et al. Programming DNA tube circumferences. Science. 2008;321:824–826. doi: 10.1126/science.1157312. [DOI] [PubMed] [Google Scholar]
- 34.Zheng JP, et al. From molecular to macroscopic via the rational design of a self-assembled 3D DNA crystal. Nature. 2009;461:74–77. doi: 10.1038/nature08274. [DOI] [PMC free article] [PubMed] [Google Scholar]
- 35.Sharma J, et al. Control of self-assembly of DNA tubules through integration of gold nanoparticles. Science. 2009;323:112–116. doi: 10.1126/science.1165831. [DOI] [PMC free article] [PubMed] [Google Scholar]
- 36.Liu W, Zhong H, Seeman Nadrain C. Crystalline two dimensional DNA origami arrays. Angew Chem Int Ed. 2011;50:264–267. doi: 10.1002/anie.201005911. [DOI] [PMC free article] [PubMed] [Google Scholar]
- 37.Majumder U, Rangnekar A, Gothelf KV, Reif JH, LaBean TH. Design and constructionof double-decker tile as a route to three-dimensional periodic assembly of DNA. J Am Chem Soc. 2011;133:3843–3845. doi: 10.1021/ja1108886. [DOI] [PubMed] [Google Scholar]
- 38.Wang T, Schiffels D, Cuesta SM, Fygenson DK, Seeman NC. Design and characterization of 1D nanotubes and 2D periodic arrays self-assembled from DNA multi-helix bundles. J Am Chem Soc. 2012;134:1606–1616. doi: 10.1021/ja207976q. [DOI] [PMC free article] [PubMed] [Google Scholar]
- 39.Kuzyk A, et al. DNA-based self-assembly of chiral plasmonic nanostructures with tailored optical response. Nature. 2012;483:311–314. doi: 10.1038/nature10889. [DOI] [PubMed] [Google Scholar]
- 40.Acuna GP, et al. Fluorescence enhancement at docking sites of DNA-directed self-assembled nanoantennas. Science. 2012;338:506–510. doi: 10.1126/science.1228638. [DOI] [PubMed] [Google Scholar]
- 41.Park S, et al. Macroscopic 10-terabitpersquare-inch arrays from block copolymers with lateral order. Science. 2009;323:1030–1033. doi: 10.1126/science.1168108. [DOI] [PubMed] [Google Scholar]
- 42.Ke Y, et al. Multilayer DNA origami packed on a square lattice. J Am Chem Soc. 2009;131:15903–15908. doi: 10.1021/ja906381y. [DOI] [PMC free article] [PubMed] [Google Scholar]
- 43.Aldaye FA, Sleiman HF. Sequential self-assembly of a DNA hexagon as a template for the organization of gold nanoparticles. Angew Chem Int Ed. 2006;45:2204–2209. doi: 10.1002/anie.200502481. [DOI] [PubMed] [Google Scholar]
- 44.Tan SF, et al. Quantum plasmon resonances controlled by molecular tunnel junctions. Science. 2014;343:1496–1499. doi: 10.1126/science.1248797. [DOI] [PubMed] [Google Scholar]
- 45.Selmi DN, et al. DNA-templated protein arrays for single-molecule imaging. Nano Lett. 2011;11:657–660. doi: 10.1021/nl1037769. [DOI] [PubMed] [Google Scholar]
- 46.Dang XN, et al. Virus-templated self-assembled single-walled carbon nanotubes for highly efficient electron collection in photovoltaic devices. Nat Nanotechnol. 2011;6:377–384. doi: 10.1038/nnano.2011.50. [DOI] [PubMed] [Google Scholar]
- 47.Sharma J, et al. Toward reliable gold nanoparticle patterning on self-assembled DNA nanoscaffold. J Am Chem Soc. 2008;130:7820–7821. doi: 10.1021/ja802853r. [DOI] [PubMed] [Google Scholar]
- 48.Kremer JR, Mastronarde DN, McIntosh JR. Computer visualization of three dimensional image data using IMOD. J Struct Biol. 1996;116:71–76. doi: 10.1006/jsbi.1996.0013. [DOI] [PubMed] [Google Scholar]
Associated Data
This section collects any data citations, data availability statements, or supplementary materials included in this article.