

Abstract
Purpose
Asparaginase is a critical agent used to treat acute lymphoblastic leukemia (ALL). Pegaspargase (SS-PEG), a pegylated form of Escherichia coli L-asparaginase with a succinimidyl succinate (SS) linker, is the first-line asparaginase product used in Children's Oncology Group (COG) ALL trials. Calaspargase pegol (SC-PEG) replaces the SS linker in SS-PEG with a succinimidyl carbamate linker, creating a more stable molecule. COG AALL07P4 was designed to determine the pharmacokinetic and pharmacodynamic comparability of SC-PEG to SS-PEG in patients with newly diagnosed high-risk (HR) B-cell ALL.
Patients and Methods
A total of 165 evaluable patients were randomly assigned at a 2:1 ratio to receive SC-PEG at 2,100 (SC-PEG2100; n = 69) or 2,500 IU/m2 (SC-PEG2500; n = 42) versus SS-PEG 2,500 IU/m2 (SS-PEG2500; n = 54) as part of an otherwise identical chemotherapy regimen. The groups were similar demographically, except more female patients received SC-PEG2500.
Results
The mean half-life of plasma asparaginase activity for both SC-PEG doses was approximately 2.5× longer than that of SS-PEG2500. The total systemic exposure, as defined by induction area under the curve from time 0 to 25 days, was greater with SC-PEG2500 than with SS-PEG2500 or SC-PEG2100. The proportion of patients with plasma asparaginase activity ≥ 100 mIU/mL and ≥ 400 mIU/mL was higher in patients who received SC-PEG as compared with SS-PEG2500. After one dose of pegylated asparaginase on induction day 4, plasma asparagine was undetectable for 11 days for SS-PEG2500 and 18 days for both SC-PEG groups.
Conclusion
SC-PEG2500 achieves a significantly longer period of asparaginase activity above defined thresholds and asparagine depletion compared with SS-PEG2500 and has a comparable toxicity profile in children with HR B-cell ALL.
INTRODUCTION
Asparaginase is a critical agent in the treatment of acute lymphoblastic leukemia (ALL). This enzyme deaminates asparagine and glutamine, interfering with protein synthesis and resulting in cell death as lymphoblasts are deficient in asparagine synthetase.1,2 Native Escherichia coli (E coli) L-asparaginase and a pegylated version thereof, pegaspargase (SS-PEG), are major components of ALL treatment regimens. SS-PEG is currently the first-line asparaginase preparation used in Children's Oncology Group (COG) ALL trials.
Calaspargase pegol (SC-PEG) is a newly developed form of pegylated asparaginase that uses the identical enzyme and polyethylene glycol moiety present in SS-PEG; however, SC-PEG uses a succinimidyl carbonate linker that is more stable than the SS-PEG succinimidyl succinate linker. Specifically, SC-PEG urethane linkages formed with lysine groups are more hydrolytically stable.3 SC-PEG and SS-PEG have comparable pharmacokinetic (PK) and pharmacodynamics (PD) properties in preclinical studies.3
COG AALL07P4 was designed to assess the PK and PD comparability4 of SC-PEG to SS-PEG when administered intravenously during induction and consolidation therapy in newly diagnosed patients with National Cancer Institute–designated high-risk (HR) B-cell ALL receiving an otherwise identical COG augmented Berlin-Frankfurt-Münster (aBFM) –based chemotherapy regimen.
PATIENTS AND METHODS
Patients
Eligible patients (age 1 to 30.99 years) had newly diagnosed HR B-cell ALL (age ≥ 10 years and/or initial WBC count ≥ 50,000/microliter).5 Key exclusion criteria included patients with Down syndrome, testicular leukemia, prior cytotoxic chemotherapy, pregnancy, and breastfeeding women.
Institutional review board approval was obtained at each participating institution before patient enrollment. Written informed consent and assent (where appropriate) were obtained from each patient and/or his or her parent or guardian before initiation of therapy.
Study Design
This pilot multicenter, open-label, randomized trial opened to accrual in July 2008 at 23 COG centers. All patients received a modified COG aBFM chemotherapy regimen based on Children's Cancer Group 1961 arm C,6 with the asparaginase preparation assigned at study enrollment. Patients were initially randomly assigned at a ratio of 2:1 to SC-PEG 2,500 IU/m2 (SC-PEG2500; calaspargase pegol [EZN-2285]) versus SS-PEG (SS-PEG2500; pegaspargase). The regimens included a total of seven, 11, or 12 scheduled doses, depending on rapid early responders (RERs), slow early responders (SERs), and extended induction status, respectively, in the first 7 to 11 months of therapy (Table 1).
Table 1.
Therapy Regimens at Time of Study Initiation

| Phase and Treatment | Dose |
|---|---|
| Induction (5 weeks) | |
| Prednisone | 60 mg/m2 per day orally on days 1 to 28 |
| Cytarabinea | IT ×1 on days −2 to 1 |
| Vincristine | 1.5 mg/m2 (maximum, 2 mg) per dose on days 1, 8, 15, and 22 |
| Daunorubicin | 25 mg/m2 per dose on days 1, 8, 15, and 22 |
| Methotrexateb | IT on days 8, 15,c 22,c and 29 |
| Assigned PEG asparaginase product (SS-PEG or SC-PEG) | 2,500 IU/m2 per dose IV on day 4 |
| Extended induction (2 weeks)d | |
| Prednisone | 60 mg/m2 per day orally on days 1 to 14 |
| Vincristine | 1.5 mg/m2 (maximum, 2 mg) per dose on days 1 and 8 |
| Daunorubicin | 25 mg/m2 per dose on day 1 |
| Assigned PEG asparaginase product (SS-PEG or SC-PEG) | 2,500 IU/m2 per day IV on day 4 |
| Consolidatione (8 weeks) | |
| Cyclophosphamide | 1,000 mg/m2 per day IV on days 1 and 29 |
| Cytarabine | 75 mg/m2 per day SQ IV on days 1 to 4, 8 to 11, 29 to 32, and 36 to 39 |
| Mercaptopurine | 60 mg/m2 per day orally on days 1 to 14 and 29 to 42 |
| Methotrexateb | IT on days 1, 8, 15,f and 22f |
| Assigned PEG asparaginase product (SS-PEG or SC-PEG) | 2,500 IU/m2 per day IV on days 15 and 43 |
| Vincristine | 1.5 mg/m2 (maximum, 2 mg) per dose on days 15, 22, 43, and 50 |
| Interim maintenancee (8 weeks) | |
| Vincristine | 1.5 mg/m2 (maximum, 2 mg) per dose IV on days 1, 11, 21, 31, and 41 |
| Methotrexate | 100 mg/m2 per day IV on days 1, 11, 21, 31, and 41 (escalate by 50 mg/m2 per dose) |
| Assigned PEG asparaginase product (SS-PEG or SC-PEG) | 2,500 IU/m2 per day IM on days 2 and 22 |
| Methotrexateb | IT on days 1 and 31 |
| Delayed intensification (8 weeks) | |
| Dexamethasone | 10 mg/m2 per day orally on days 1 to 7 and 15 to 21 |
| Vincristine | 1.5 mg/m2 (maximum, 2 mg) per dose IV on days 1, 8, 15, 43, and 50 |
| Doxorubicin | 25 mg/m2 per day IV on days 1, 8, and 15 |
| Assigned PEG asparaginase product (SS-PEG or SC-PEG) | 2,500 IU/m2 per day IV on days 4 and 43 |
| Methotrexateb | IT on days 1, 29, and 36 |
| Cyclophosphamide | 1,000 mg/m2 per day IV on day 29 |
| Thioguanine | 60 mg/m2 per day orally on days 29 to 42 |
| Cytarabine | 75 mg/m2 per day SQ or IV on days 29 to 32 and 36 to 39 |
| Interim maintenance II (8 weeks): same as interim maintenance Ig | Starting dose of IV methotrexate 50 mg/m2 < MTD in interim maintenance I, with same escalation rules |
| Delayed intensification II (8 weeks): same as delayed intensification Ig | — |
| Maintenance (12 weeks)h | |
| Vincristine | 1.5 mg/m2 per day IV on days 1, 29, and 57 |
| Prednisone | 40 mg/m2 per day orally on days 1 to 5, 29 to 33, and 57 to 61 |
| Mercaptopurine | 75 mg/m2 per day orally on days 1 to 84 |
| Methotrexate | 20 mg/m2 per day orally on days 8, 15, 22, 29,i 36, 43, 50, 57, 64, 71, and 78 |
| Methotrexateb | IT on day 1 (and day 29 in cycles one to four for RER patients) |
Abbreviations: IT, intrathecally; IV, intravenously; MRD, minimal residual disease; MTD, maximum-tolerated dose; PEG, pegylated; RER, rapid early responder; SC-PEG, calaspargase pegol; SER, slow early responder; SQ, subcutaneously; SS-PEG, pegaspargase.
Doses were age adjusted as follows: age 1 to 1.99 years, 30 mg; age 2 to 2.99 years, 50 mg; and age ≥ 3 years, 70 mg.
Doses were age adjusted as follows: age 1 to 1.99 years, 8 mg; age 2 to 2.99 years, 10 mg; age 3 to 8.99 years, 12 mg; and age ≥ 9 years, 15 mg.
Patients with CNS3 leukemia only.
Extended induction for patients with 5% to < 25% blasts on day 29 bone marrow or ≥ 1% MRD.
During first 2 weeks of consolidation therapy, patients with CNS disease at diagnosis received 18 Gy to cranial midplane in 10 fractions. Patients classified as SERs received 12 Gy to cranial midplane in eight fractions starting on day 29 of delayed intensification II; day-36 IT methotrexate and day-29 to -42 thioguanine were omitted.
Omit for patients with CNS3 leukemia.
SER patients only.
Cycles of maintenance therapy were repeated until total duration of therapy, beginning with first interim maintenance period, reached 2 years for female and 3 years for male patients.
Omit for RER patients.
The primary end point was to determine the PK comparability4 of SC-PEG and SS-PEG administered intravenously during induction and consolidation. Secondary end points included: safety, serum and CSF asparagine levels, immunogenicity, end-induction minimal residual disease (MRD), percentage of patients who were RERs, and complete remission and event-free survival rates. MRD was determined by multiparameter flow cytometry performed in a central laboratory.7,8 A cutoff of < 0.1% was used for treatment stratification; however, for outcome analysis, positive MRD was defined as ≥ 0.01%, because multivariable analyses found this to be the most important prognostic variable in other COG trials.9 Patients with < 5% blasts by morphologic bone marrow analysis on day 8 or 15 and day 29 and MRD < 0.1% were RERs; all others were SERs. The area under the curve (AUC) of asparaginase was based on plasma asparaginase activity from time 0 to 25 days (AUC0-25 days) after induction day-4 dose of study drug (mIU × hr/mL) and was calculated using linear trapezoidal summation. The PK-evaluable analysis population was defined as patients who received 94% to 106% of the induction day-4 asparaginase dose and had samples available to calculate AUC0-25 days. Additional PK parameters examined the percentage of patients with asparaginase activity ≥ 100 and ≥ 400 mIU/mL at specified time points. After planned interim PK analysis, the trial was amended in September 2009 to randomly assign patients between SC-PEG 2100 IU/m2 (SC-PEG2100) versus SS-PEG2500, because this dose was predicted to achieve comparability of AUC0-25 days. In December 2010, after data safety monitoring committee review of MRD suggested inferior results with SC-PEG2100, having crossed predefined response monitoring boundaries, the trial was closed to accrual. Patients in the SC-PEG2100 arm were nonrandomly changed to SS-PEG2500 for the duration of therapy. In January 2011, results of COG AALL0232, conducted in an identical risk group of patients with ALL, demonstrated the superiority of high-dose methotrexate over Capizzi methotrexate in interim maintenance,10 and the protocol was amended to incorporate this change. Adverse events (AEs) were graded according to the National Cancer Institute Common Terminology Criteria for Adverse Events (CTCAE; version 3.0) before July 2011 and converted into CTCAE (version 4.0) codes, with subsequent AEs collected in CTCAE (version 4.0).
Laboratory Tests
PKs, PDs, and immunogenicity were performed at central laboratories (Frontage Laboratories, Malvern, PA, and Commonwealth Biotechnologies, Richmond, VA) at specified time points. PKs were determined by a validated enzymatic coupled activity–modified assay.11 PDs were determined using validated reverse-phase high-performance liquid chromatography with double mass spectrometry. Immunogenicity assessment included the detection of both binding antibodies and neutralizing antibodies, determined by a validated direct enzyme-linked immunosorbent assay and an enzymatic coupled activity assay, respectively (Data Supplement).
Statistical Analysis
Clinical data frozen as of September 30, 2012, are included in this report. This report focuses on PK, PD, and AE data up to the end of delayed intensification I, and all patients were past that point in therapy as of that date. All analyses of clinical data were performed by intention to treat using validated SAS software (version 9.2; SAS Institute, Cary, NC). χ2 and Fisher's exact tests were used for comparison of proportions between the three randomly assigned cohorts. All continuous data were summarized using medians and were compared among the three cohorts using the nonparametric Kruskal-Wallis test. The PK and PD data were computed from individual asparaginase activity and asparagine concentrations by applying a noncompartmental model approach using Phoenix WINNonlin software (version 6.1; Scientific Consultant, Apex, NC; Pharsight Corporation, St Louis, MO). For maximum plasma concentration (Cmax) and AUC values (AUC0-t, AUC0-25 days, and AUC0-), 90% CIs were calculated. For other parameters, the differences were described descriptively.
RESULTS
Patient Characteristics
Between October 2008 and December 2010, 166 patients were enrolled and randomly assigned (Fig 1). One patient was inevaluable because of a major protocol violation and was excluded. Three patients discontinued the trial before receiving the randomly assigned study drug, and 162 received treatment with the randomly assigned study drug. Demographic characteristics (Table 2) of the three groups were similar, except for a higher percentage of female patients in the SC-PEG2500 arm as compared with the SC-PEG2100 and SS-PEG arms (67% v 45% and 43%, respectively; P = .04).
Fig 1.

CONSORT diagram for Children's Oncology Group AALL07P4. PK, pharmacokinetic; SC-PEG, calaspargase pegol; SS-PEG, pegaspargase.
Table 2.
Demographic and Clinical Characteristics of Eligible, Evaluable Patients (N = 165)

| Characteristic | Regimen |
P | |||||
|---|---|---|---|---|---|---|---|
| SS-PEG 2,500 IU/m2 (n = 54) |
SC-PEG 2,500 IU/m2 (n = 42) |
SC-PEG 2,100 IU/m2 (n = 69) |
|||||
| No. | % | No. | % | No. | % | ||
| Age at diagnosis, years | .13 | ||||||
| < 10 | 18 | 33 | 18 | 43 | 19 | 28 | |
| 10 to 15 | 28 | 52 | 19 | 45 | 30 | 43 | |
| ≥ 16 | 8 | 15 | 5 | 12 | 20 | 29 | |
| Sex | .04 | ||||||
| Male | 31 | 57 | 14 | 33 | 38 | 55 | |
| Female | 23 | 43 | 28 | 67 | 31 | 45 | |
| Race | .55 | ||||||
| White | 42 | 78 | 35 | 83 | 56 | 81 | |
| African American | 6 | 11 | 1 | 2 | 4 | 6 | |
| Other | 6 | 11 | 6 | 15 | 9 | 13 | |
| Ethnicity | .55 | ||||||
| Non-Hispanic | 34 | 63 | 28 | 67 | 53 | 77 | |
| Hispanic | 18 | 33 | 12 | 28 | 14 | 20 | |
| Unknown | 2 | 4 | 2 | 5 | 2 | 3 | |
| CNS status | .20 | ||||||
| 1 | 46 | 85 | 36 | 86 | 50 | 72 | |
| 2 | 8 | 15 | 5 | 12 | 15 | 22 | |
| 3 | 0 | 0 | 1 | 2 | 4 | 6 | |
| Initial WBC, × 1,000/μL | .46 | ||||||
| < 50 | 32 | 59 | 20 | 48 | 35 | 51 | |
| ≥ 50 | 22 | 41 | 22 | 52 | 34 | 49 | |
| BSA at study entry, m2 | .23 | ||||||
| Median | 1.3 | 1.2 | 1.4 | ||||
| Range | 0.5-2.9 | 0.5-2.4 | 0.4-2.8 | ||||
| MRD day 29 | |||||||
| Percent negative (< 0.01%) | 36 of 50 | 72 | 29 of 39 | 74 | 36 of 64 | 56 | .10 |
| Percent negative (< 0.1%) | 39 of 50 | 78 | 33 of 39 | 85 | 44 of 64 | 69 | .18 |
| Early response | .15 | ||||||
| RER | 38 of 50 | 76 | 32 of 39 | 82 | 41 of 63 | 65 | |
| SER | 12 of 50 | 24 | 7 of 39 | 18 | 22 of 63 | 35 | |
Abbreviations: BSA, body-surface area; MRD, minimal residual disease; RER, rapid early responder; SC-PEG, calaspargase pegol; SER, slow early responder; SS-PEG, pegaspargase.
PKs
Mean plasma asparaginase activity versus asparagine concentration over time during induction and consolidation therapies is shown in Figure 2. After completion of the induction day-4 intravenous dose of asparaginase, high levels of plasma asparaginase activity were observed for all treatment arms 5 minutes after infusion. Mean plasma asparaginase activity in all arms decreased based on the respective half-lives (t1/2; Table 3). By 18 days after administration, patients treated with SC-PEG maintained higher levels of asparaginase activity when compared with SS-PEG–treated patients (Fig 2A). Before the consolidation day-15 dose, which is at least 46 days after the induction day-4 asparaginase dose, 20% to 30% of patients in both SC-PEG groups had asparaginase activity ≥ 100 mIU/mL, as compared with none in the SS-PEG group.
Fig 2.
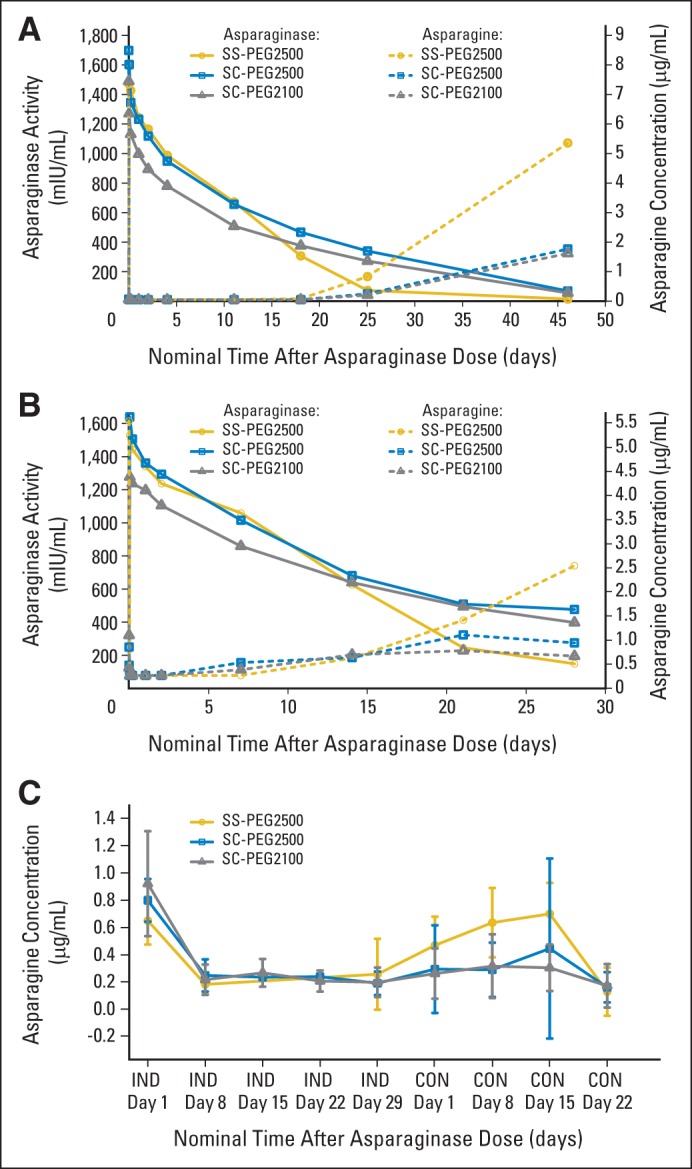
Mean plasma asparaginase activity versus asparagine concentration by treatment group over time during (A) induction (IND) and (B) consolidation (CON), and (C) mean CSF asparagine concentration by treatment group over time during IND and CON. SC-PEG, calaspargase pegol; SS-PEG, pegaspargase.
Table 3.
PK Parameters During Induction and Consolidation in PK-Evaluable Population

| Parameter | Induction |
Consolidation |
||||||||||
|---|---|---|---|---|---|---|---|---|---|---|---|---|
| SS-PEG 2,500 IU/m2 (n = 43)* |
SC-PEG 2,500 IU/m2 (n = 40)* |
SC-PEG 2,100 IU/m2 (n = 62)* |
SS-PEG 2,500 IU/m2 (n = 30)* |
SC-PEG 2,500 IU/m2 (n = 21)* |
SC-PEG 2,100 IU/m2 (n = 30)* |
|||||||
| Mean | SD | Mean | SD | Mean | SD | Mean | SD | Mean | SD | Mean | SD | |
| Cmax, mIU/mL | 1,650 | 474 | 1,655 | 366 | 1,291 | 379 | 1,480† | 292 | 1,610 | 424 | 1,280† | 274 |
| tmax, hours | 3.8 | 6.2 | 6.0 | 17.0 | 2.9 | 6.8 | 7.7† | 11.8 | 5.1 | 11.2 | 7.5† | 11.1 |
| CL, mL/hr | 9.1 | 5.0 | 6.4 | 4.8 | 7.9‡ | 6.6 | 7.8§ | 5.2 | 7.5∥ | 0.015 | 4.9§ | 0.0045 |
| t1/2, hours | 127 | 51 | 322 | 118 | 305‡ | 98 | 117§ | 49 | 356∥ | 133 | 416§ | 149 |
| Vss, L | 2.0 | 1.2 | 2.7 | 2.02 | 3.1‡ | 2.0 | 1.8§ | 1.4 | 2.4∥ | 2.4 | 2.5§ | 1.3 |
| AUC0-25 days, IU × hr/mL | 365 | 77 | 404 | 94.1 | 324 | 86.4 | NA | NA | NA | |||
| AUC0-inf, IU × hr/mL | 387 | 85.8 | 574 | 15.9 | 454‡ | 144 | 441§ | 109 | 777∥ | 303 | 687§ | 197 |
Abbreviations: AUC, area under the curve; CL, clearance; Cmax, maximum plasma concentration; NA, not applicable; PK, pharmacokinetic; SC-PEG, calaspargase pegol; SD, standard deviation; SS-PEG, pegaspargase; t1/2, half-life; tmax, time to maximum plasma concentration; V, volume.
n indicates No. of PK-evaluable patients.
n = 29.
n = 58.
n = 24.
n = 17.
Similar to induction, after the day-15 consolidation dose (Fig 2B), high levels of plasma asparaginase activity were observed for all treatment arms at 5 minutes afater infusion; these decreased based on their respective t1/2 (Table 3). Twenty-one days after administration, patients treated with SC-PEG maintained higher levels of asparaginase activity when compared with SS-PEG–treated patients, and at 28 days after dosing, mean SS-PEG plasma asparaginase activity was below the therapeutic threshold of 100 mIU/mL, whereas those in the SC-PEG2100 and SC-PEG2500 groups had mean values of 333.8 and 412.9 mIU/mL, respectively.
PK results for the PK-evaluable patients for induction and consolidation are summarized in Table 3. Mean t1/2 of plasma asparaginase activity for both the SC-PEG doses was approximately 2.5× longer than that of SS-PEG2500 in induction and consolidation.
When administered at the 2,500 IU/m2 dose, the total systemic exposure to SC-PEG, as defined by induction AUC0-25 days (404 IU × h/mL) and AUC0-inf (574 IU × h/mL), was greater than that observed with SS-PEG2500 (365 and 387 IU × h/mL, respectively). For SC-PEG2500 compared with SS-PEG2500, the ratio of geometric means and corresponding 90% CIs for AUC0-25 days was 111.0% (90% CI, 100.7% to 122.3%). This difference in total systemic exposure as defined by Induction AUC0-25 days was not seen with SC-PEG2100 group. A similar pattern of Cmax, t1/2, systemic exposure, and elimination constant was also observed during consolidation (Table 3).
Plasma asparaginase activity presented as the percentage of PK-evaluable patients with asparaginase activity ≥ 100 and ≥ 400 mIU/mL by treatment group during induction and consolidation is shown in Figure 3. During induction, SS-PEG2500 and both doses of SC-PEG achieved comparable results in the proportion of patients who maintained asparaginase activity levels ≥ 100 mIU/mL through 18 days after the induction dose. Twenty-five days after the induction dose, both doses of SC-PEG maintained asparaginase activity levels ≥ 100 mIU/mL in 95% of patients, as compared with only 28.6% of patients receiving SS-PEG2500 (Fig 3A; P < .001). By the time of the first consolidation dose of asparaginase (approximately 46 days after induction dose), approximately one quarter of the patients receiving SC-PEG continued to have asparaginase activity levels ≥ 100 mIU/mL, whereas no patients in the SS-PEG2500 arm did (P = .002).
Fig 3.
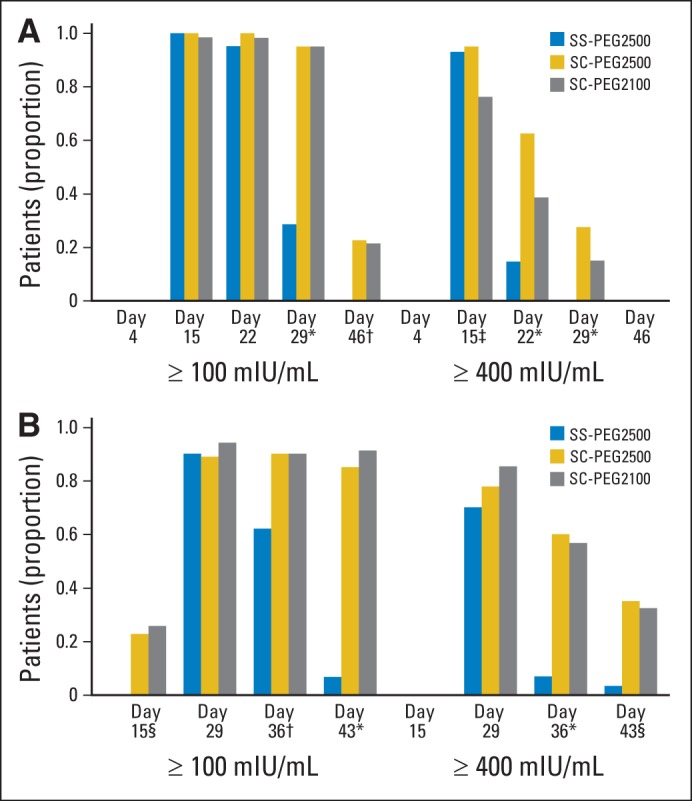
Plasma asparaginase activity presented as percentage of pharmacokinetically evaluable patients with asparaginase activity ≥ 100 and ≥ 400 mIU/mL by treatment group over time during (A) induction and (B) consolidation. SC-PEG, calaspargase pegol; SS-PEG, pegaspargase. (*) P < .001. (†) P = .006. (‡) P = .008. (§) P = .002.
Using an asparaginase activity threshold level of ≥ 400 mIU/mL, both SC-PEG2500 and SS-PEG2500 achieved comparable results in the proportion of patients who maintained this level through 11 days, with SC-PEG2100 being slightly lower. After that time point, the proportion of patients maintaining a level of asparaginase activity ≥ 400 mIU/mL was higher for both doses of SC-PEG compared with SS-PEG2500. By the end of induction, none of the SS-PEG2500 patients maintained asparaginase activity level ≥ 400 mIU/mL, compared with 27.5% in the SC-PEG2500 group and 13.6% in the SC-PEG2100 group (P < .001). During consolidation (Fig 3B), results were observed similar to those seen during the induction phase.
PDs
There was a direct correlation between the reduction in plasma asparagine and plasma asparaginase activity during induction and consolidation (Figs 2A and 2B). Plasma asparagine was completely reduced with higher levels of asparaginase activity and began to rebound once plasma asparaginase activity declined < 400 mIU/mL. Thus, the longer t1/2 of SC-PEG resulted in a prolonged suppression of plasma asparagine.
Baseline mean plasma asparagine concentrations were similar for all three groups. After the induction dose, plasma asparagine concentrations decreased and were not detectable (< 0.05 μg/mL) for all treatment groups at the 5 minutes postdose time point and remained undetectable for 11 days for SS-PEG2500 and 18 days for both SC-PEG groups. Twenty-five days after administration, plasma asparagine levels were undetectable in some patients in all three groups (88%, 95%, and 96% in SS-PEG2500, SC-PEG2500, and SC-PEG2100 groups, respectively). After this time point, the rate of plasma asparagine rise was greatest in the SS-PEG group.
Before consolidation day-15 dosing, the residual plasma asparagine level in patients in the SS-PEG2500 group was 5.33 μg/mL (72.4% of preinduction baseline, with only 3% of patients < lower limit of detection [LLD]). By comparison, the residual plasma asparagine levels in patients treated with SC-PEG2500 and SC-PEG2100 were 0.64 (7.6% of preinduction baseline, with 72% of patients < LLD) and 0.88 μg/mL (11.8% of preinduction baseline, with 76% of patients < LLD), respectively. Similar levels were observed after the consolidation dose.
CSF Asparagine Concentration
Mean CSF asparagine concentration by treatment group during induction and consolidation is shown in Figure 2C. All three treatment regimens were effective in reducing CSF asparagine levels. Four days after the induction dose, mean CSF asparagine concentration in all treatment groups was diminished to approximately 25% to 30% of the preinduction dose values. Mean CSF asparagine levels returned to prebaseline levels by the time of the consolidation dose on day 15 in SS-PEG2500–treated patients, which was earlier than occurred for SC-PEG–treated patients (60% of baseline in SC-PEG2500 group; 40% of baseline in SC-PEG2100 group).
Immunogenicity
Antiasparaginase binding antibodies were confirmed in eight patients: four in the SS-PEG2500 group, two in the SC-PEG2500 group, and two in the SC-PEG2100 group. None of these patients had positive neutralizing antibody assays; however, three patients treated with SS-PEG and one treated with SC-PEG2500 were noted to have more rapid clearance of asparaginase activity compared with their treatment groups. Two of these eight patients (one in SC-PEG2500 group and one in SC-PEG2100 group) had positive binding antibodies in the preinduction dose sample and had no subsequent positive tests, and no effect on asparaginase activity was seen. One SC-PEG2100 patient was noted to have a neutralizing antibody to SC-PEG and a false-positive binding assay but was noted to have more rapid clearance of asparaginase activity. In the patients with positive binding antibodies, allergic or hypersensitivity reactions were reported in two of four SS-PEG2500 patients, one of two SC-PEG2500 patients, and no patients in the SC-PEG2100 group.
Asparaginase-Specific AEs
Protocol-specified asparaginase-specific AEs (regardless of grade or attribution to study drug; allergic reactions, coagulopathy, hyperbilirubinemia, hyperglycemia, hyperlipidemia, ketoacidosis, pancreatitis, thrombosis, and CNS events [bleeding, thrombosis, or infarction]) are listed in Table 4. AEs were similar between the three different treatment arms, with the exception of hyperglycemia in induction and hyperbilirubinemia in delayed intensification I, which were higher for the SC-PEG groups than for the SS-PEG2500 group (P = .001 and .01, respectively). When restricted to grade 3 and 4 events, the incidence of hyperbilirubinemia in delayed intensification I was not significant (P = .71; Appendix Table A1, online only).
Table 4.
Incidence of Protocol-Specified Asparaginase-Specific Grade 1 to 4 AEs by Regimen and Course

| AE and Course | SS-PEG 2,500 IU/m2 |
SC-PEG 2,500 IU/m2 |
SC-PEG 2,100 IU/m2 |
P | |||
|---|---|---|---|---|---|---|---|
| No. | % | No. | % | No. | % | ||
| Allergic reaction* | |||||||
| Induction | 4 of 54 | 7.4 | 2 of 42 | 4.8 | 1 of 69 | 1.4 | .26 |
| Consolidation | 10 of 43 | 23.3 | 9 of 33 | 27.3 | 10 of 49 | 20.4 | .77 |
| Interim maintenance I | 0 of 39 | 0.0 | 0 of 29 | 0.0 | 1 of 46 | 2.1 | 1.00 |
| Delayed intensification I | 0 of 38 | 0.0 | 0 of 26 | 0.0 | 2 of 45 | 4.4 | .34 |
| Hyperbilirubinemia | |||||||
| Induction | 20 of 54 | 37.0 | 14 of 42 | 33.3 | 28 of 69 | 40.6 | .75 |
| Consolidation | 13 of 43 | 30.2 | 15 of 33 | 45.5 | 26 of 49 | 53.1 | .09 |
| Interim maintenance I | 13 of 39 | 33.3 | 8 of 29 | 27.6 | 19 of 46 | 41.3 | .49 |
| Delayed intensification I | 4 of 38 | 10.5 | 10 of 26 | 38.5 | 13 of 45 | 28.9 | .01 |
| Hyperlipidemia | |||||||
| Induction | 4 of 54 | 7.4 | 4 of 42 | 9.5 | 2 of 69 | 2.9 | .31 |
| Consolidation | 3 of 43 | 7.0 | 1 of 33 | 3.0 | 1 of 49 | 2.0 | .53 |
| Interim maintenance I | 1 of 39 | 2.6 | 1 of 29 | 3.4 | 1 of 46 | 2.2 | 1.00 |
| Delayed intensification I | 0 of 38 | 0.0 | 0 of 26 | 0.0 | 1 of 45 | 2.2 | 1.00 |
| Hyperglycemia | |||||||
| Induction | 25 of 54 | 46.3 | 34 of 42 | 81.0 | 47 of 69 | 68.1 | .001 |
| Consolidation | 20 of 43 | 46.5 | 14 of 33 | 42.4 | 22 of 49 | 44.9 | .97 |
| Interim maintenance I | 13 of 39 | 33.3 | 13 of 29 | 44.8 | 16 of 46 | 34.8 | .60 |
| Delayed intensification I | 14 of 38 | 36.8 | 16 of 26 | 61.5 | 20 of 45 | 44.4 | .13 |
| CNS | |||||||
| Induction | 0 of 54 | 0.0 | 0 of 42 | 0.0 | 4 of 69 | 5.8 | .09 |
| Consolidation | 0 of 43 | 0.0 | 0 of 33 | 0.0 | 0 of 49 | 0.0 | 1.00 |
| Interim maintenance I | 0 of 39 | 0.0 | 0 of 29 | 0.0 | 0 of 46 | 0.0 | 1.00 |
| Delayed intensification I | 1 of 38 | 2.6 | 1 of 26 | 3.8 | 0 of 45 | 0.0 | .34 |
| Pancreatitis | |||||||
| Induction | 2 of 54 | 3.7 | 3 of 42 | 7.1 | 4 of 69 | 5.8 | .76 |
| Consolidation | 3 of 43 | 7.0 | 2 of 33 | 6.1 | 5 of 49 | 10.2 | .85 |
| Interim maintenance I | 1 of 39 | 2.6 | 1 of 29 | 3.4 | 1 of 46 | 2.2 | 1.00 |
| Delayed intensification I | 0 of 38 | 0.0 | 2 of 26 | 7.7 | 1 of 45 | 2.2 | .25 |
| Thrombosis | |||||||
| Induction | 0 of 54 | 0.0 | 0 of 42 | 0.0 | 4 of 69 | 5.8 | .09 |
| Consolidation | 1 of 43 | 2.3 | 0 of 33 | 0.0 | 0 of 49 | 0.0 | .61 |
| Interim maintenance I | 0 of 39 | 0.0 | 0 of 29 | 0.0 | 0 of 46 | 0.0 | 1.00 |
| Delayed intensification I | 0 of 38 | 0.0 | 0 of 26 | 0.0 | 1 of 45 | 2.2 | 1.00 |
| Prolongation of activated partial thromboplastin time | |||||||
| Induction | 3 of 54 | 5.6 | 3 of 42 | 7.1 | 9 of 69 | 13.0 | .35 |
| Consolidation | 3 of 43 | 7.0 | 3 of 33 | 9.1 | 4 of 49 | 8.2 | .92 |
| Interim maintenance I | 3 of 39 | 7.7 | 2 of 29 | 6.9 | 3 of 46 | 6.5 | 1.00 |
| Delayed intensification I | 7 of 38 | 18.4 | 7 of 26 | 26.9 | 4 of 45 | 8.9 | .13 |
| INR increase | |||||||
| Induction | 2 of 54 | 3.7 | 4 of 42 | 9.5 | 9 of 69 | 13.0 | .23 |
| Consolidation | 3 of 43 | 7.0 | 1 of 33 | 3.0 | 3 of 49 | 6.1 | .79 |
| Interim maintenance I | 1 of 39 | 2.6 | 0 of 29 | 0.0 | 1 of 46 | 2.2 | 1.00 |
| Delayed intensification I | 0 of 38 | 0.0 | 1 of 26 | 3.8 | 3 of 45 | 6.7 | .29 |
Abbreviations: AE, adverse event; INR, international normalized ratio; SC-PEG, calaspargase pegol; SS-PEG, pegaspargase.
Allergic reactions limited to events attributed as possibly, probably, or definitely related to SS-PEG or SC-PEG treatment.
End-of-Induction Treatment Response
The end-of-induction treatment responses are listed in Table 2. The rates of RERs and MRD negativity were similar in the SC-PEG2500 (82% and 74%, respectively) and SS-PEG2500 groups (76% and 72%, respectively). However, the SC-PEG2100 group had a lower rate of RERs and MRD negativity (65% and 56%, respectively) compared with the SC-PEG2500 treatment group (P = .15 and .18, respectively). Although these differences were not statistically significant, at the time of interim analysis, the available values had crossed predefined response monitoring boundaries, leading to suspension of enrollment and transition of all SC-PEG2100 patients to SS-PEG2500.
DISCUSSION
L-asparaginase is an essential component of standard combination therapy for ALL, and most children with ALL treated in North America and Western Europe now receive SS-PEG.12 This study investigated a new formulation of pegylated asparaginase conjugated with a more stable SC linker that also imparts improved drug product shelf life compared with SS-PEG.3
Early studies in nonhuman primates as well as previously published reports have concluded that ≥ 100 mIU/mL is an appropriate target level of asparaginase activity associated with asparagine depletion when a native asparaginase is used.13–16 Some reports have noted that complete asparagine depletion can still be observed even with levels < 100 mIU/mL.17,18 Other investigators have suggested that a higher level of asparaginase activity (≥ 400 mIU/mL) is needed to achieve optimal asparagine depletion.19 Our data suggest that asparaginase activity level ≥ 400 mIU/mL is associated with more significant asparagine depletion, which could translate to improved outcomes.
We found that SC-PEG2500 was comparable in PKs to SS-PEG2500 with regard to AUC0-25 days and Cmax, whereas SC-PEG2100 was comparable in PKs to SS-PEG2500 with regard to AUC0-25 days. The t1/2 of asparaginase activity for both doses of SC-PEG was more than twice that of SS-PEG2500. After a single infusion at day 4, both SC-PEG doses were effective in maintaining asparaginase activity ≥ 100 mIU/mL in > 95% of patients at the end of the 4-week induction phase, and 20% to 30% of patients still had levels above this threshold 3 weeks later (consolidation day 15). By comparison, < 30% of patients treated with SS-PEG2500 maintained asparaginase activity ≥ 100 mIU/mL at end of induction, and none had levels above this threshold at consolidation day 15. Similarly, patients treated with SC-PEG maintained asparaginase activity level ≥ 400 mIU/mL for longer than those who received SS-PEG2500. Both doses of SC-PEG were effective in reducing plasma asparagine levels below detectable levels for a longer duration than SS-PEG2500 during induction and consolidation.
End-of-induction complete remission rates, RERs, and MRD negativity were similar among the three groups. However, the SC-PEG2100 group trended toward inferior responses, with lower rates of RERs and MRD negativity (65% and 56%, respectively) compared with the SS-PEG and SC-PEG2500 groups. This difference crossed predefined statistical monitoring boundaries during conduct of the study, but ultimately, it was not statistically significant. The reason for this difference is unclear and may be an artifact resulting from small sample size or the higher number of older patients in the SC-PEG2100 group (P = .13). Superior responses might be explained by enhanced asparagine depletion having an effect on the clearance of leukemia blasts. There was a slightly higher percentage of patients age ≥ 16 years in the SC-PEG2100 group as compared with the other two groups, which did not reach conventional levels of statistical significance (P = .06), and older adolescents have been shown to have inferior end-of-induction MRD responses compared with younger patients with HR B-cell ALL,20 but this likely does not fully explain the observed differences.
Few patients in all groups had confirmed antiasparaginase antibodies, even though clinical allergic or hypersensitivity reactions were reported at a higher rate. Half of patients with antiasparaginase antibodies did not have clinical allergic or hypersensitivity reactions reported, and numerous patients had allergic or hypersensitivity reactions reported but no antibodies detected. This may be because of assay limitations. Some of the reported allergic reactions may have actually been allergic or hypersensitivity reactions related to other medications or blood products or nonallergic infusion reactions.
The limitations of this study include small numbers of patients, the challenge of measuring plasma asparagine in the presence of ex vivo asparaginase activity, and possibly reporting bias in this open-label trial. Although COG phase III studies do not require reporting of grade 1 or 2 AEs, for this trial, the US Food and Drug Administration mandated reporting of asparaginase-specific events of all grades regardless of attribution; thus, the rates attributed to asparaginase may have been overestimated and cannot be compared directly with those from other COG ALL trials.
COG AALL07P4 randomly assigned patients with newly diagnosed HR B-cell ALL at a 2:1 ratio to receive SC-PEG (2100 or 2500 IU/m2) or SS-PEG (2,500 IU/m2) during aBFM multiagent chemotherapy. Because of its increased t1/2, SC-PEG2500 produced a significantly longer period of asparagine depletion than SS-PEG2500 and had a comparable toxicity profile in children with HR B-cell ALL. Additional studies are needed to determine whether the superior PK and PD properties of SC-PEG translate to improved treatment outcomes.
Supplementary Material
Acknowledgment
We thank the participating institutions (Children's Hospital Colorado, Children's Hospital of Philadelphia, Children's Hospital of Pittsburgh of University of Pittsburgh Medical Center, Children's Hospitals and Clinics of Minnesota–Minneapolis, Children's National Medical Center, Children's Hospital of Orange County, Children's Memorial Hospital, Cincinnati Children's Hospital Medical Center, Connecticut Children's Medical Center, Hackensack University Medical Center, Johns Hopkins University, Lucile Packard Children's Hospital Stanford University, New York University, Langone Medical Center, Oregon Health and Science University, Primary Children's Medical Center, Riley Hospital for Children, Seattle Children's Hospital, University of Alabama at Birmingham, University of Minnesota Medical Center-Fairview, University of New Mexico, University of Oklahoma Health Sciences Center, University of Texas Southwestern Medical Center, Vanderbilt University, Washington University School of Medicine, and Wayne State University) as well as all the patients and study staff.
Presented in part at the 48th Annual Meeting of the American Society of Clinical Oncology, Chicago, IL, June 1-5, 2012.
Glossary Terms
- pharmacokinetics:
a branch of pharmacology that studies the relationship between drug exposure level, time course of exposure, and the overall response of an organism. Although pharmacokinetics is largely applied to drugs, it is also applicable to other compounds such as nutrients, toxins, hormones, etc. Pharmacokinetics is subdivided into absorption and disposition (distribution, metabolism, and excretion) and is generally referred to as ADME (absorption, distribution, metabolism, excretion). With respect to drugs administered, all processes occur in tandem once a drug dose is administered. In clinical trials, phase I studies will typically study pharmacokinetics and safety of the drug.
- pharmacodynamics:
the study of the biochemical and physiologic effects of a drug on the body.
Appendix
Table A1.
Protocol-Specified Asparaginase-Specific AEs Restricted to Grades 3 to 4

| AE and Course | SS-PEG 2,500 IU/m2 |
SC-PEG 2,500 IU/m2 |
SC-PEG 2,100 IU/m2 |
P | |||
|---|---|---|---|---|---|---|---|
| No. | % | No. | % | No. | % | ||
| Pancreatitis | |||||||
| Induction | 2 of 54 | 3.7 | 2 of 42 | 4.8 | 4 of 69 | 5.8 | .90 |
| Delayed intensification I | 0 of 38 | 0.0 | 2 of 26 | 7.7 | 1 of 45 | 2.2 | .25 |
| Hyperlipidemia | |||||||
| Induction | 2 of 54 | 3.7 | 2 of 42 | 4.8 | 1 of 69 | 1.4 | .62 |
| Delayed intensification I | 0 of 38 | 0.0 | 0 of 26 | 0.0 | 1 of 45 | 2.2 | 1.00 |
| Hyperbilirubinemia | |||||||
| Induction | 4 of 54 | 7.4 | 5 of 42 | 11.9 | 6 of 69 | 8.7 | .74 |
| Delayed intensification I | 0 of 38 | 0.0 | 1 of 26 | 3.9 | 1 of 45 | 2.2 | .71 |
| Hyperglycemia | |||||||
| Induction | 8 of 54 | 14.8 | 11 of 42 | 26.2 | 24 of 69 | 34.8 | .04 |
| Delayed intensification I | 3 of 38 | 7.9 | 6 of 26 | 23.1 | 7 of 45 | 15.6 | .24 |
Abbreviations: AE, adverse event; SC-PEG, calaspargase pegol; SS-PEG, pegaspargase.
Footnotes
Support information appears at the end of this article.
Terms in blue are defined in the glossary, found at the end of this article and online at www.jco.org.
Authors' disclosures of potential conflicts of interest and author contributions are found at the end of this article.
AUTHORS' DISCLOSURES OF POTENTIAL CONFLICTS OF INTEREST
Although all authors completed the disclosure declaration, the following author(s) and/or an author's immediate family member(s) indicated a financial or other interest that is relevant to the subject matter under consideration in this article. Certain relationships marked with a “U” are those for which no compensation was received; those relationships marked with a “C” were compensated. For a detailed description of the disclosure categories, or for more information about ASCO's conflict of interest policy, please refer to the Author Disclosure Declaration and the Disclosures of Potential Conflicts of Interest section in Information for Contributors.
Employment or Leadership Position: Taha Keilani, Sigma Tau Pharmaceuticals (C) Consultant or Advisory Role: Stephen P. Hunger, Sigma Tau Pharmaceuticals (C), Jazz Pharmaceuticals (C) Stock Ownership: None Honoraria: Stephen P. Hunger, Jazz Pharmaceuticals, Sigma Tau Pharmaceuticals Research Funding: Julie M. Gastier-Foster, Bristol-Myers Squibb Expert Testimony: None Patents, Royalties, and Licenses: None Other Remuneration: None
AUTHOR CONTRIBUTIONS
Conception and design: Anne L. Angiolillo, Reuven J. Schore, Meenakshi Devidas, Gregory H. Reaman, Charlotte Wood, Elizabeth A. Raetz, Naomi J. Winick, William L. Carroll, Stephen P. Hunger
Administrative support: Charlotte Wood, Stephen P. Hunger
Collection and assembly of data: Anne L. Angiolillo, Reuven J. Schore, Meenakshi Devidas, Michael J. Borowitz, Andrew J. Carroll, Julie M. Gastier-Foster, Nyla A. Heerema, Taha Keilani, Ashley R. Lane, Brent Wood, Charlotte Wood, Hao W. Zheng, William L. Carroll, Stephen P. Hunger
Data analysis and interpretation: Anne L. Angiolillo, Reuven J. Schore, Meenakshi Devidas, Taha Keilani, Mignon L. Loh, Gregory H. Reaman, Peter C. Adamson, Hao W. Zheng, Stephen P. Hunger
Manuscript writing: All authors
Final approval of manuscript: All authors
Support
Supported by grants from the National Cancer Institute to the Children's Oncology Group (Chair's Grant No. CA98543 and Statistics and Data Center Grant No. CA98413) and by research funding from Enzon, Sigma-Tau Pharmaceuticals, and BD Biosciences. S.P.H. is the Ergen Family Chair in Pediatric Cancer.
REFERENCES
- 1.Broome JD. Evidence that the L-asparaginase of guinea pig serum is responsible for its antilymphoma effects: II. Lymphoma 6C3HED cells cultured in a medium devoid of L-asparagine lose their susceptibility to the effects of guinea pig serum in vivo. J Exp Med. 1963;118:121–148. doi: 10.1084/jem.118.1.121. [DOI] [PMC free article] [PubMed] [Google Scholar]
- 2.Broome JD. Evidence that the L-asparaginase of guinea pig serum is responsible for its antilymphoma effects: I. Properties of the L-asparaginase of guinea pig serum in relation to those of the antilymphoma substance. J Exp Med. 1963;118:99–120. doi: 10.1084/jem.118.1.99. [DOI] [PMC free article] [PubMed] [Google Scholar]
- 3.Gaithersburg, MD: Sigma Tau Pharmaceuticals; 2007. Investigator brochure for EZN-2285 (SC-PEG E coli L-asparaginase), version 1. [Google Scholar]
- 4.US Department of Health and Human Services. Guidance for Industry: Statistical Approaches to Establishing Bioequivalence. http://www.fda.gov/downloads/Drugs/Guidances/ucm070244.pdf.
- 5.Smith M, Arthur D, Camitta B, et al. Uniform approach to risk classification and treatment assignment for children with acute lymphoblastic leukemia. J Clin Oncol. 1996;14:18–24. doi: 10.1200/JCO.1996.14.1.18. [DOI] [PubMed] [Google Scholar]
- 6.Seibel NL, Steinherz PG, Sather HN, et al. Early postinduction intensification therapy improves survival for children and adolescents with high-risk acute lymphoblastic leukemia: A report from the Children's Oncology Group. Blood. 2008;111:2548–2555. doi: 10.1182/blood-2007-02-070342. [DOI] [PMC free article] [PubMed] [Google Scholar]
- 7.Borowitz MJ, Pullen DJ, Shuster JJ, et al. Minimal residual disease detection in childhood precursor-B-cell acute lymphoblastic leukemia: Relation to other risk factors. A Children's Oncology Group study. Leukemia. 2003;17:1566–1572. doi: 10.1038/sj.leu.2403001. [DOI] [PubMed] [Google Scholar]
- 8.Weir EG, Borowitz MJ. Flow cytometry in the diagnosis of acute leukemia. Semin Hematol. 2001;38:124–138. doi: 10.1016/s0037-1963(01)90046-0. [DOI] [PubMed] [Google Scholar]
- 9.Borowitz MJ, Devidas M, Hunger SP, et al. Clinical significance of minimal residual disease in childhood acute lymphoblastic leukemia and its relationship to other prognostic factors: A Children's Oncology Group study. Blood. 2008;111:5477–5485. doi: 10.1182/blood-2008-01-132837. [DOI] [PMC free article] [PubMed] [Google Scholar]
- 10.Larsen EC, Salzer WL, Devidas M, et al. Comparison of high-dose methotrexate (HD-MTX) with Capizzi methotrexate plus asparaginase (C-MTX/ASNase) in children and young adults with high-risk acute lymphoblastic leukemia (HR-ALL): A report from the Children's Oncology Group study AALL0232. J Clin Oncol. 2011;29(suppl):6s. doi: 10.1200/JCO.2015.62.4544. abstr 3. [DOI] [PMC free article] [PubMed] [Google Scholar]
- 11.Jayaram HN, Cooney DA, Jayaram S, et al. A simple and rapid method for the estimation of L-asparaginase in chromatographic and electrophoretic effluents: Comparison with other methods. Anal Biochem. 1974;59:327–346. doi: 10.1016/0003-2697(74)90284-x. [DOI] [PubMed] [Google Scholar]
- 12.Pui CH, Evans WE. Treatment of acute lymphoblastic leukemia. N Engl J Med. 2006;354:166–178. doi: 10.1056/NEJMra052603. [DOI] [PubMed] [Google Scholar]
- 13.Ahlke E, Nowak-Göttl U, Schulze-Westhoff P, et al. Dose reduction of asparaginase under pharmacokinetic and pharmacodynamic control during induction therapy in children with acute lymphoblastic leukaemia. Br J Haematol. 1997;96:675–681. doi: 10.1046/j.1365-2141.1997.d01-2089.x. [DOI] [PubMed] [Google Scholar]
- 14.Avramis VI, Sencer S, Periclou AP, et al. A randomized comparison of native Escherichia coli asparaginase and polyethylene glycol conjugated asparaginase for treatment of children with newly diagnosed standard-risk acute lymphoblastic leukemia: A Children's Cancer Group study. Blood. 2002;99:1986–1994. doi: 10.1182/blood.v99.6.1986. [DOI] [PubMed] [Google Scholar]
- 15.Boos J, Werber G, Ahlke E, et al. Monitoring of asparaginase activity and asparagine levels in children on different asparaginase preparations. Eur J Cancer. 1996;32A:1544–1550. doi: 10.1016/0959-8049(96)00131-1. [DOI] [PubMed] [Google Scholar]
- 16.Riccardi R, Holcenberg JS, Glaubiger DL, et al. L-asparaginase pharmacokinetics and asparagine levels in cerebrospinal fluid of rhesus monkeys and humans. Cancer Res. 1981;41:4554–4558. [PubMed] [Google Scholar]
- 17.Klug Albertsen B, Schmiegelow K, Schrøder H, et al. Anti-Erwinia asparaginase antibodies during treatment of childhood acute lymphoblastic leukemia and their relationship to outcome: A case-control study. Cancer Chemother Pharmacol. 2002;50:117–120. doi: 10.1007/s00280-002-0466-y. [DOI] [PubMed] [Google Scholar]
- 18.Vieira Pinheiro JP, Ahlke E, Nowak-Göttl U, et al. Pharmacokinetic dose adjustment of Erwinia asparaginase in protocol II of the paediatric ALL/NHL-BFM treatment protocols. Br J Haematol. 1999;104:313–320. doi: 10.1046/j.1365-2141.1999.01192.x. [DOI] [PubMed] [Google Scholar]
- 19.Avramis VI, Panosyan EH. Pharmacokinetic/pharmacodynamic relationships of asparaginase formulations: The past, the present and recommendations for the future. Clin Pharmacokinet. 2005;44:367–393. doi: 10.2165/00003088-200544040-00003. [DOI] [PubMed] [Google Scholar]
- 20.Raetz EA, Devidas M, Carroll AJ, et al. Cytogenetic and early-response characteristics of adolescents and young adults with acute lymphoblastic leukemia (ALL): A Children's Oncology Group (COG) study. J Clin Oncol. 2010;28(suppl):680s. abstr 9509. [Google Scholar]
Associated Data
This section collects any data citations, data availability statements, or supplementary materials included in this article.