Abstract
Neuropeptide Y (NPY) is highly expressed in the hypothalamus, where it regulates feeding and energy homeostasis. Interestingly, NPY and its receptors are also expressed in peripheral tissues with roles in metabolism, including pancreatic islets. In islets, NPY is known to suppress insulin secretion acutely. In addition, the role of NPY in β-cell de-differentiation has been postulated recently. Therefore, we studied transgenic mice expressing NPY under rat insulin promoter (TG) to determine the effects of chronic up-regulation of NPY on islet morphology and function. NPY levels were 25 times higher in islets of TG mice compared with wild-type (WT) littermates, whereas no differences in NPY expression were noted in the brains of TG and WT mice. Islet NPY secretion was 2.3-fold higher in TG compared with WT mice. There were no significant changes in body weight, glucose tolerance, or insulin sensitivity in TG mice fed regular rodent diet or high-fat diet (HF). Islet β-cell area was comparable between TG and WT mice both on regular rodent and HF diets, indicating that NPY overexpression is insufficient to alter β-cell maturation or the compensatory increase of β-cell area on HF. One abnormality noted was that the glucose-stimulated insulin secretion in islets isolated from TG was reduced compared with those from WT mice on HF diet. Overall, an increase in islet NPY level has little impact on islet function and is insufficient to affect glucose homeostasis in mice.
Neuropeptide Y (NPY) is a 36-amino acid peptide of NPY receptor family along with pancreatic polypeptide and YY that signals through Y1 to Y6 G protein-coupled receptors (1). NPY is best known as an orexigenic peptide in the hypothalamus that increases food intake and reduces energy expenditure (2). However, expression of NPY and its receptors is also seen in peripheral tissues, such as pancreatic islets, bone, and adipose tissues, where it has a role in energy homeostasis (3–5). In islets, NPY is expressed in insulin as well as glucagon- and somatostatin-producing cells and negatively modulates insulin secretion (6–9). Acute exposure to NPY inhibits glucose-stimulated insulin secretion (GSIS) in human and rodent islets (10–12). Conversely, a neutralizing NPY antibody increases GSIS from rat islets (13), whereas basal and GSIS are increased in whole-body NPY knockout mice (4). These findings suggest that islet NPY may tonically suppress insulin secretion via autocrine and/or paracrine mechanisms.
Recently, an additional role of islet NPY in the maintenance of β-cell phenotypes has been described. The expression of NPY was increased when NeuroD, a key transcriptional regulator of insulin gene expression, was deleted using rat insulin promoter (RIP)-Cre. The resultant islets showed features of immature β-cells. GSIS was reduced, whereas basal insulin secretion, oxygen consumption, and expression of glycolytic genes were increased (14). In a partial pancreatectomy mouse model, there was an emergence of insulin-negative, SMAD family member 7-positive cells that appeared to be dedifferentiated β-cells based on lineage tracing (15). This cluster of dedifferentiated cells also expresses NPY receptor family of peptides, including NPY (15). Thus, the increased expression of NPY in islets may be a common feature of immature/dedifferentiated β-cells. However, it is unknown whether islet NPY alters the development or function of β-cells. We created mice that overexpress NPY in β-cells and examined the effects of chronic NPY exposure on islet morphology, insulin secretion, and glucose homeostasis.
Methods and Materials
Animal studies
Experiments were approved by Institutional Animal Care and Use Committee at Eastern Virginia Medical School. We generated 2 independent lines of transgenic mice (TG1 and TG2) in the C57BL6N background, expressing mouse npy cDNA under RIP. Male mice (except for Supplemental Figure 1A that included 2 female mice), age 4–16 weeks, were fed a regular chow (NC) diet containing 18 kcal% fat (Harlan 2018) or high-fat (HF) diet containing 45 kcal% fat (D124551; Research Diets) ad libitum. Blood glucose was measured in tail blood using a hand-held glucometer (4). Mice were euthanized by CO2 asphyxiation for tissue and serum collection. Whole brain was frozen with dry ice to excise hypothalamic and cortical tissues. Mouse islets were obtained via collagenase digestion and Ficoll density gradient separation as previously described (4).
RNA extraction and quantitative PCR
RNA from hypothalamus and cortex was extracted with TRIzol reagent (Invitrogen) and purified with RNeasy kit (QIAGEN) according to manufacturer protocols. RNA from islets was prepared with RNeasy kit as previously described (4). cDNA was synthesized from RNA with iScript cDNA synthesis kit (Bio-Rad) and analyzed by ABI TaqMan system (Applied Biosystems) using commercially available primers. β-Actin was used as a housekeeping gene for normalization of expression data.
NPY measurement by ELISA
Approximately 250 isolated islets were incubated in 0.1 mL of RPMI 1640 with 10% FBS and 10 mmol/L glucose at 37°C in 5% CO2 for 24 hours. After centrifugation, the supernatant was collected for NPY measurement (Phoenix Pharmaceuticals), and islet pellets were lysed in CelLytic M (Sigma) containing protease inhibitor cocktail (Sigma) to determine protein contents (Bio-Rad DC protein assay).
Glucose homeostasis
For glucose tolerance test (GTT), the overnight fasted mice received glucose ip at 1.5-mg glucose/g body weight (BW) for NC and at 1.0 mg/g BW for HF mice. For insulin tolerance test, the mice fasted for 4 hours in the morning received regular insulin ip at 0.75 mIU/g BW for NC and at 1.0 mU/g BW for HF mice. Tail blood glucose was measured at indicated time as above.
Immunofluorescent analyses
Paraffin-embedded pancreatic sections were incubated with primary antibodies followed by visualization using fluorescent secondary antibodies as previously published (4). Primary antibodies were mouse antiglucagon at 1:200 (clone K79bB10; Sigma), guinea pig antiinsulin at 1:800 (ab7842; Abcam), and rabbit anti-NPY at 1:500 (EMD Millipore). Secondary antibodies were Dylite 549 antimouse, cy2 antiguinea pig antibodies, and cy3 antirabbit antibodies all at 1:1000 from Jackson ImmunoResearch. Nuclei were visualized with 1-μg/mL 4′,6-diamidino-2-phenylindole (Life Technologies). Images of a pancreatic section cut through the maximum footprint of pancreas from each mouse were captured by AxioObserverZ.1 fluorescent microscope (Carl Zeiss), and a composite image covering an entire section was prepared using AxioVision Rel.4.7 (Carl Zeiss). A border of a pancreatic section was visually defined on a composite picture covering an entire section. Thereafter, pancreas area and insulin-positive area within a composite picture were measured using AxioVision Rel.4.7. Percentage of β-cell area was calculated as %(sum of insulin-positive area/total pancreas area). To obtain the ratio of insulin/glucagon-positive cells, 7–12 islets were randomly chosen from a pancreatic section of each mouse, and numbers of insulin and glucagon-positive cells were counted in each islet. Some of the sections were evaluated using a confocal microscope (LSM510; Carl Zeiss)
Glucose-stimulated insulin secretion
Krebs-Ringer buffer (KRB) for GSIS was published (4). For batch assays, islets freshly isolated from npy transgenic and wild-type (WT) mice were incubated in KRB without glucose for 1 hour at 37°C in 5% CO2. Thereafter, islets at a number indicated in figure legends was transferred to a v-bottom 96 well filled with 0.2 mL of KRB containing 3 or 20 mmol/L glucose and incubated for 1 hour at 37°C in 5% CO2 with occasional gentle shaking (n = 5–10 per mouse). After incubation, supernatant was collected for determination of insulin secretion by mouse insulin ELISA (Mercodia). Insulin from islet pellet was extracted with acidified ethanol as described to determine total insulin content of the islets (4). Stimulation index was calculated as (average insulin secretion at 20 mmol/L glucose)/(average insulin secretion at 3 mmol/L glucose) for each mouse. For perifusion assays, mouse islets cultured overnight in 0.1 mL of RPMI 1640 with 10% FBS and 10 mmol/L glucose at 37°C in 5% CO2 were perifused with KRB containing 3 mmol/L glucose for 45 minutes followed by 23 mmol/L glucose as published (16).
Statistics
Data are presented as mean ± SEM. Differences of numeric parameters between 2 groups were assessed with Student's t tests. GraphPad Prism 5 was used for two-way ANOVA to determine significance in GTT and insulin tolerance test. P < .05 was considered significant.
Results
β-Cell targeted expression of NPY increased NPY secretion from islets
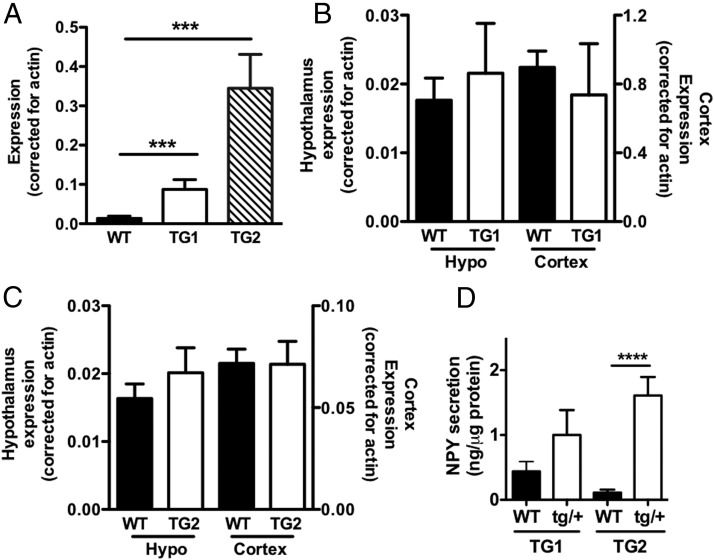
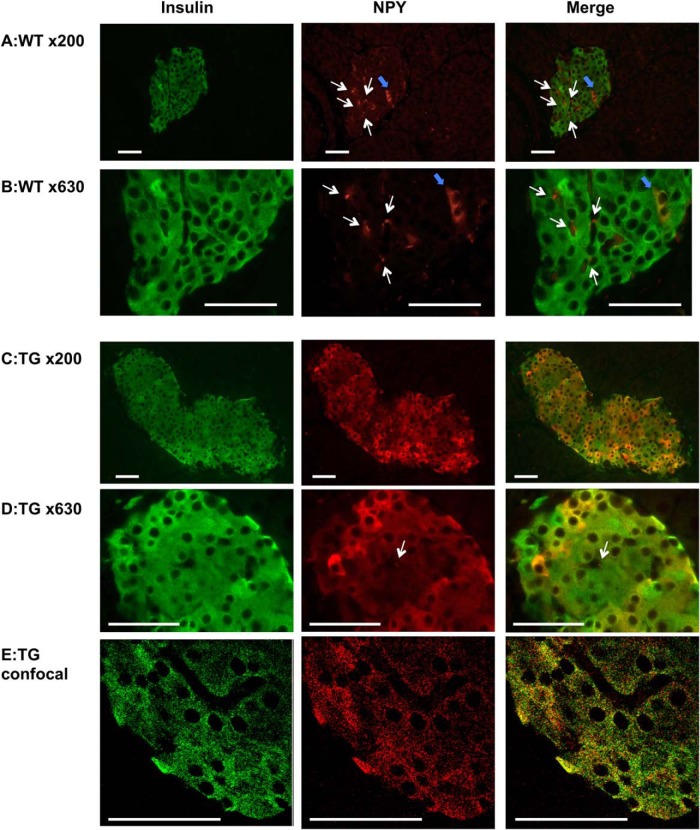
In 2 transgenic mouse lines, NPY expression in islets was increased 6-fold in TG1 and 25-fold in TG2 compared with WT mice (P < .001) (Figure 1A). Ectopic NPY transgene expression in hypothalamus or cortex was negligible, because NPY levels in these brain regions were similar among WT and transgenic (Figure 1, B and C) mice. NPY secretion from TG2 islets was significantly higher (P < .001) than controls. The NPY secretion from TG1 islets only showed trend of increase compared with WT islets (2.3-fold increase) (Figure 1D), which agrees with the lower NPY expression in TG1 than TG2 islets (Figure 1A). Although a sample size was limited, the expression of Y1 receptor, the NPY receptor in islets (4), was unchanged in TG2 compared with WT islets (Supplemental Figure 1A). Also, exogenous NPY reduced GSIS in TG2 islets, indicating that TG islets retain response to NPY (Supplemental Figure 1B). Immunofluorescence analysis confirmed that NPY is increased in β-cells of TG mice. WT islets (Figure 2, A and B) showed occasional cells strongly positive for NPY and dots like NPY staining similar to previously reported NPY-positive nerve fibers (11). TG islets showed increased expression of NPY in β-cells at variable intensity (Figure 2, C–E). Images of confocal microscopy indicated that NPY and insulin highly colocalize within β-cells (Figure 2E). This image is in agreement with the previous report that demonstrated NPY is targeted to secretory granules in β-cells (17).
Figure 1.
Transgenic mice expressing NPY in β-cells. A, NPY expression was measured with quantitative PCR in islets of male NPY TG1 and TG2 in comparison with WT male littermates (WT), n = 3–11. B and C, NPY expression in hypothalamus (hypo) and cortex was compared between male WT, TG1 (n = 3 per genotype) (B), and TG2 mice (n = 6–8 per genotype) (C). D, NPY secretion from islets of male WT and NPY transgenic mice (tg/+) was expressed per islet protein contents (n = 3–7). Data are mean ± SEM. ***, P < .001; ****, P < .0001.
Figure 2.
NPY expression in islets of transgenic mice and WT control. Immunofluorescent analysis of pancreata from male WT littermates (WT) (A and B) and NPY TG2 (C–E) for insulin (green) and NPY (red). An epifluorescent microscope Axiophot (A–D) or a confocal microscope LSM510 (E) was used to capture images. The white arrows indicate NPY staining of neuronal projections, and blue arrows indicates strongly positive for NPY staining in WT islets. Scale bar, 50 μm
β-Cell NPY transgenic mice maintains normal glucose homeostasis on NC
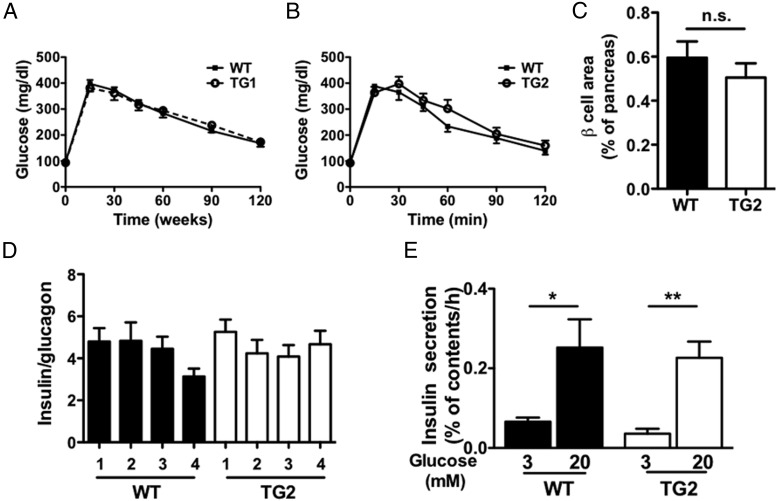
Neither TG1 nor TG2 mice on NC diet showed a difference in BW or blood glucose levels compared with WT mice (Supplemental Figure 1, C–F). The GTT was also similar between WT and the 2 TG lines (Figure 3, A and B). Because glucose levels were unaltered in both of transgenic lines fed NC diet, further studies were performed using TG2 that expresses NPY in β-cells at higher levels than TG1 (Figure 1A). β-Cell NPY transgenic expression did not affect insulin tolerance in TG2 compared with WT mice (Supplemental Figure 1G). Immunofluorescence studies showed that β-cell area was comparable between the 2 (Figure 3C and Supplemental Figure 1H) and that there was no reduction in the abundance of insulin-positive β-cells vs glucagon-positive α-cells between the 2 (Figure 3D). Basal and GSIS parameters were comparable between TG2 and WT mice (Figure 3E). Overall, overexpression of NPY in β-cells had little effects on glucose homeostasis, islet architecture, or GSIS in NC-fed mice.
Figure 3.
Glucose tolerance and β-cell area were similar between NPY transgenic mice and WT mice on NC diet. A and B, Glucose tolerance to 1.5-mg glucose per g BW injected ip was assessed in male TG1 (A), TG2 (B), and WT littermates (n = 4–9). C, β-Cell area was compared between male TG2 and WT mice (n = 4). D, The ratio of insulin and glucagon-positive cells was compared in male TG2 and WT mice (n = 4 per genotype; n = 10–12 islets per mouse). E, Insulin secretion from 5 islets per measurement in response to 3 or 20 mmol/L glucose expressed as % insulin contents of islets was compared between islets isolated from male TG2 and WT mice (n = 5 measurements per glucose concentration in each mouse). Data are mean ± SEM. n.s.. nonsignificant. *, P < .05; **, P < .01.
β-Cell NPY transgenic mice maintains normal glucose homeostasis on HF diet
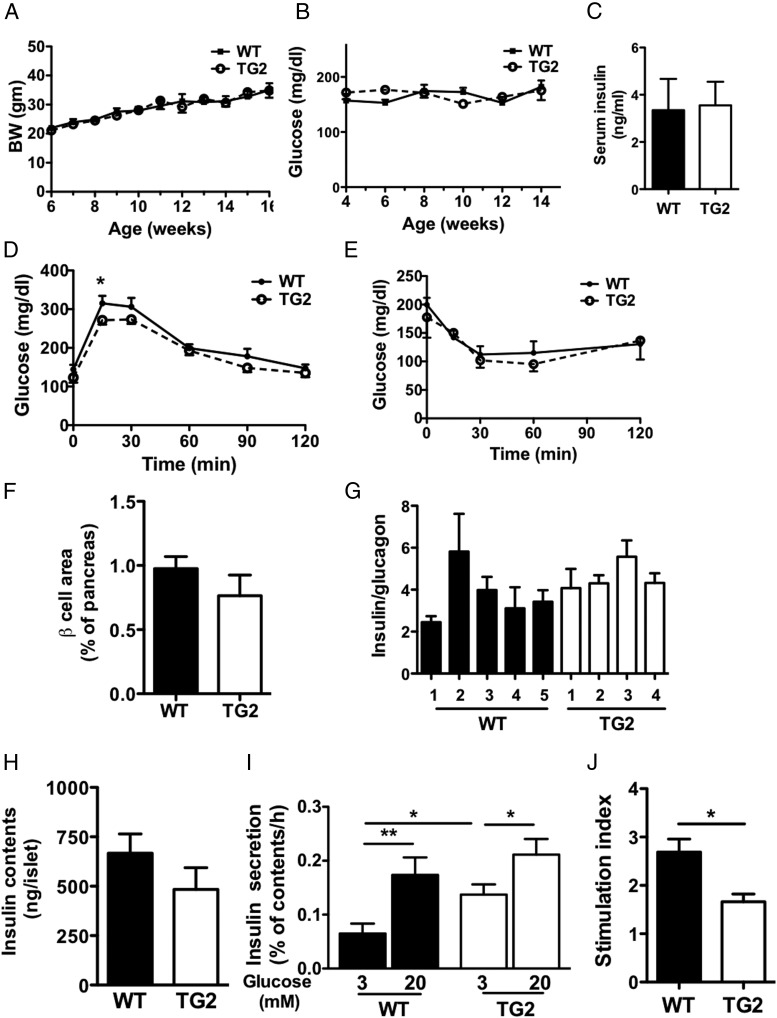
Previously, we observed that NPY expression in islets was reduced in diet-induced obese hyperinsulinemic mice (4). Along with increased islet mass in NPY-deficient mice (4), it is possible that the reduction of NPY in HF mice may aid islet compensation to HF diet. Thus, we tested the effects of a HF diet in TG2 mice. Weight gain during 3 months on HF diet was comparable between TG2 and WT mice (Figure 4A). Both TG2 and WT mice on HF diet maintained blood glucose levels similar to those at the initiation of the diet, indicating an appropriate adaptation to insulin resistance (Figure 4B). Serum insulin levels after 3 months of HF diet were similarly increased in TG and WT mice (Figure 4C). GTT was slightly improved at 15 minutes in TG2 mice (P < .05) but overall was not statistically different between the 2 (two-way ANOVA, P = .09) (Figure 4D). Likewise, insulin tolerance was comparable between the 2 (Figure 4E). Immunofluorescence of pancreata showed that NPY overexpression did not alter islet morphology in TG2 mice (Figure 4F). There was no significant difference in the β-cell area, or the ratio of insulin and glucagon-positive cells in TG2 and WT mice (Figure 4, F and G, and Supplemental Figure 1I). However, NPY overexpression decreased GSIS tested by batch assays in islets from TG2 on HF diet (Figure 4, H–J). GSIS at 20 mmol/L glucose was comparable between TG2 and WT islets from HF-fed mice (Figure 4, H and I). However, the basal insulin secretion at 3 mmol/L glucose was elevated in islets from TG2 compared with WT on HF diet (P < .05) (Figure 4I). Moreover, the stimulation index and GSIS expressed per islet were blunted in islets from TG2 compared with WT mice, indicating that TG2 islets on HF diet show impaired GSIS in spite of no change in glucose homeostasis in vivo (Figure 4J).
Figure 4.
Overexpression of NPY in β-cells did not impair adaptation to HF diet. A and B, BW (n = 11–13) (A) and tail blood glucose levels (n = 7–8) (B) were monitored in male TG2 and WT mice on HF diet. C, Serum insulin levels in male TG2 and WT mice (n = 5). D–E, Glucose tolerance to 1.0-mg/g BW glucose injected ip (n = 6) (D), and insulin tolerance to 1.0-mIU/g BW insulin injected ip (n = 4–3) (E) were compared between male TG2 and WT mice on HF diet. F, β-Cell area was compared in male TG2 and WT mice on HF diet (n = 5–6). G, The ratio of insulin and glucagon-positive cells was compared between 4 TG2 and 5 WT male mice on HF diet (n = 7 islets per mouse). H, Insulin contents were compared between islets from TG2 and WT male mice on HF diet (n = 5–6). I, Insulin secretion from a single islet per measurement in response to 3 or 20 mmol/L glucose expressed as % insulin contents of islets was compared between islets isolated from TG2 and WT male mice on HF diet (n = 7–10 measurements per glucose concentration in each mouse). J, Stimulation index (insulin secretion at 20 mmol/L glucose over 3 mmol/L glucose) was compared between islets isolated from TG2 and WT male mice on HF diet (n = 4–5). Data are mean ± SEM. *, P < .05; **, P < .01.
Discussion
In the present study, chronic overexpression of NPY in β-cells did not affect glucose homeostasis, GSIS, and β-cell area in TG mice on NC diet compared with WT mice. Overall, TG mice showed a normal adaptation to HF diet by increasing β-cell area and showed similar glucose tolerance as WT mice on HF diet. The major defect observed was a reduction in GSIS in islet batch assay in TG2 mice on HF diet. NPY acutely decreases GSIS from β-cells ex vivo (9–13) by reducing cAMP in β-cells through the activation of a Gi-coupled Y1 receptor (11, 18, 19). NPY has not been shown to reduce [Ca]I nor nicotinamide adenine dinucleotide phosphate-oxidase production in response to glucose in β-cells (20). In the current study, the suppressive effect of NPY on insulin was likely exacerbated by accumulation of NPY in the assay media throughout the assay duration. Because TG islets from mice on NC diet did not show blunting of GSIS, the combination of NPY accumulation and islet dysfunctions provoked by HF (16, 21, 22) may be needed to reduce GSIS. In an in vivo environment where islets are constantly perfused, significant overexpression of NPY observed in TG islets may not be sufficient to disrupt glucose homeostasis in mice fed NC or HF diets.
Despite the negative finding, the maintenance of β-cell areas and glucose homeostasis in TG mice overexpressing NPY in β-cells provides important information, because it strongly indicates that islet NPY alone is not sufficient to alter the proliferation and/or maturation of β-cells. Although the number of endocrine cells that expresses NPY at high levels is relatively limited in healthy adult islets (Figure 2A) (9), increased expression of NPY is recently reported in mouse islets with β-cell immaturation/dedifferentiation, such as NeuroD deletion through RIP-Cre (14) and partial pancreatectomy (15). However, our results suggest that the NPY expression in immature/dedifferentiated β-cells is a marker rather than an active contributor for the alteration of β-cell phenotypes.
Previously, a reduced expression of NPY and Y1 receptor in islets were noted in obese hyperinsulinemic mice (4). β-Cell area was increased in whole-body NPY-deficient mice, raising the question as to whether the reduction of NPY expression aids β-cell adaptation to insulin resistance on HF diet. Contrary to our prediction, our results demonstrate that high islet NPY expression does not overtly impair islet compensation to HF diet.
Our model has a limitation of chronic expression of NPY at the levels not seen physiologically in healthy adult islets that have limited NPY expression (9). Although there was not clear reduction in Y1 receptor expression in NPY transgenic islets, the down-regulation of postreceptor signaling pathways could underestimate NPY functions in the current study. Therefore, the limited phenotypes that we observed do not rule out regulatory roles of islet NPY in insulin secretion when NPY concentration is altered acutely in a physiological islet environment. Rather, our model will shed the light to the significance of NPY up-regulation recently noted in islets under stresses such as partial pancreatectomy and streptozotocin (15, 23) and aid to direct future efforts to determine the mechanisms involved in loss of β-cell phenotypes in islets under stresses.
Acknowledgments
This work was supported by National Institutes of Health Grants R03 DK081565 and K08 DK071536 (to Y.I.).
Disclosure Summary: The authors have nothing to disclose.
Footnotes
- BW
- body weight
- GSIS
- glucose-stimulated insulin secretion
- GTT
- glucose tolerance test
- HF
- high fat
- KRB
- Krebs-Ringer buffer
- NC
- regular chow
- NPY
- neuropeptide Y
- RIP
- rat insulin promoter
- WT
- wild type.
References
- 1. Michel MC, Beck-Sickinger A, Cox H, et al. XVI. International Union of Pharmacology recommendations for the nomenclature of neuropeptide Y, peptide YY, and pancreatic polypeptide receptors. Pharmacol Rev. 1998;50(1):143–150. [PubMed] [Google Scholar]
- 2. Mercer RE, Chee MJ, Colmers WF. The role of NPY in hypothalamic mediated food intake. Front Neuroendocrinol. 2011;32(4):398–415. [DOI] [PubMed] [Google Scholar]
- 3. Yang K, Guan H, Arany E, Hill DJ, Cao X. Neuropeptide Y is produced in visceral adipose tissue and promotes proliferation of adipocyte precursor cells via the Y1 receptor. FASEB J. 2008;22(7):2452–2464. [DOI] [PubMed] [Google Scholar]
- 4. Imai Y, Patel HR, Hawkins EJ, Doliba NM, Matschinsky FM, Ahima RS. Insulin secretion is increased in pancreatic islets of neuropeptide Y-deficient mice. Endocrinology. 2007;148(12):5716–5723. [DOI] [PubMed] [Google Scholar]
- 5. Franquinho F, Liz MA, Nunes AF, Neto E, Lamghari M, Sousa MM. Neuropeptide Y and osteoblast differentiation–the balance between the neuro-osteogenic network and local control. FEBS J. 2010;277(18):3664–3674. [DOI] [PubMed] [Google Scholar]
- 6. Myrsén U, Ahrén B, Sundler F. Neuropeptide Y is expressed in subpopulations of insulin- and non-insulin-producing islet cells in the rat after dexamethasone treatment: a combined immunocytochemical and in situ hybridisation study. Regul Pept. 1995;60(1):19–31. [DOI] [PubMed] [Google Scholar]
- 7. Ding WG, Kimura H, Fujimura M, Fujimiya M. Neuropeptide Y and peptide YY immunoreactivities in the pancreas of various vertebrates. Peptides. 1997;18(10):1523–1529. [DOI] [PubMed] [Google Scholar]
- 8. Teitelman G, Alpert S, Polak JM, Martinez A, Hanahan D. Precursor cells of mouse endocrine pancreas coexpress insulin, glucagon and the neuronal proteins tyrosine hydroxylase and neuropeptide Y, but not pancreatic polypeptide. Development. 1993;118(4):1031–1039. [DOI] [PubMed] [Google Scholar]
- 9. Whim MD. Pancreatic β cells synthesize neuropeptide Y and can rapidly release peptide co-transmitters. PLoS One. 2011;6(4):e19478. [DOI] [PMC free article] [PubMed] [Google Scholar]
- 10. Moltz JH, McDonald JK. Neuropeptide Y: direct and indirect action on insulin secretion in the rat. Peptides. 1985;6(6):1155–1159. [DOI] [PubMed] [Google Scholar]
- 11. Pettersson M, Ahrén B, Lundquist I, Böttcher G, Sundler F. Neuropeptide Y: intrapancreatic neuronal localization and effects on insulin secretion in the mouse. Cell Tissue Res. 1987;248(1):43–48. [DOI] [PubMed] [Google Scholar]
- 12. Bennet WM, Wang ZL, Jones PM, et al. Presence of neuropeptide Y and its messenger ribonucleic acid in human islets: evidence for a possible paracrine role. J Clin Endocrinol Metab. 1996;81(6):2117–2120. [DOI] [PubMed] [Google Scholar]
- 13. Wang ZL, Bennet WM, Wang RM, Ghatei MA, Bloom SR. Evidence of a paracrine role of neuropeptide-Y in the regulation of insulin release from pancreatic islets of normal and dexamethasone-treated rats. Endocrinology. 1994;135(1):200–206. [DOI] [PubMed] [Google Scholar]
- 14. Gu C, Stein GH, Pan N, et al. Pancreatic β cells require NeuroD to achieve and maintain functional maturity. Cell Metab. 2010;11(4):298–310. [DOI] [PMC free article] [PubMed] [Google Scholar]
- 15. El-Gohary Y, Tulachan S, Wiersch J, et al. A smad signaling network regulates islet cell proliferation. Diabetes. 2014;63(1):224–236. [DOI] [PMC free article] [PubMed] [Google Scholar]
- 16. Roat R, Rao V, Doliba NM, et al. Alterations of pancreatic islet structure, metabolism and gene expression in diet-induced obese C57BL/6J mice. PLoS One. 2014;9(2):e86815. [DOI] [PMC free article] [PubMed] [Google Scholar]
- 17. Tsuboi T, Rutter GA. Multiple forms of “kiss-and-run” exocytosis revealed by evanescent wave microscopy. Curr Biol. 2003;13(7):563–567. [DOI] [PubMed] [Google Scholar]
- 18. Skoglund G, Gross R, Ahrén B, Loubatières-Mariani MM. Different mechanisms are involved in neuropeptide Y-induced pancreatic vasoconstriction and inhibition of insulin secretion. Eur J Pharmacol. 1993;236(1):69–74. [DOI] [PubMed] [Google Scholar]
- 19. Morgan DG, Kulkarni RN, Hurley JD, et al. Inhibition of glucose stimulated insulin secretion by neuropeptide Y is mediated via the Y1 receptor and inhibition of adenylyl cyclase in RIN 5AH rat insulinoma cells. Diabetologia. 1998;41(12):1482–1491. [DOI] [PubMed] [Google Scholar]
- 20. Schwetz TA, Ustione A, Piston DW. Neuropeptide Y and somatostatin inhibit insulin secretion through different mechanisms. Am J Physiol Endocrinol Metab. 2013;304(2):E211–E221. [DOI] [PMC free article] [PubMed] [Google Scholar]
- 21. Collins SC, Hoppa MB, Walker JN, et al. Progression of diet-induced diabetes in C57BL6J mice involves functional dissociation of Ca2(+) channels from secretory vesicles. Diabetes. 2010;59(5):1192–1201. [DOI] [PMC free article] [PubMed] [Google Scholar]
- 22. Peyot ML, Pepin E, Lamontagne J, et al. β-Cell failure in diet-induced obese mice stratified according to body weight gain: secretory dysfunction and altered islet lipid metabolism without steatosis or reduced β-cell mass. Diabetes. 2010;59(9):2178–2187. [DOI] [PMC free article] [PubMed] [Google Scholar]
- 23. Ruipan Z, Xiangzhi M, Li L, et al. Differential expression and localization of neuropeptide Y peptide in pancreatic islet of diabetic and high fat fed rats. Peptides. 2014;54:33–38. [DOI] [PubMed] [Google Scholar]


