Abstract
We have derived new effective interactions that improve the description of ion-pairs in the OPEP coarse-grained force field without introducing explicit electrostatic terms. The iterative Boltzmann inversion method was used to extract these potentials from all atom simulations by targeting the radial distribution function of the distance between the center of mass of the side-chains. The new potentials have been tested on several systems that differ in structural properties, thermodynamic stabilities and number of ion-pairs. Our modeling, by refining the packing of the charged amino-acids, impacts the stability of secondary structure motifs and the population of intermediate states during temperature folding/unfolding; it also improves the aggregation propensity of peptides. The new version of the OPEP force field has the potentiality to describe more realistically a large spectrum of situations where salt-bridges are key interactions.
1 Introduction
Salt-bridges are considered key interactions for protein stability1. They act as structural clamps that rigidify the protein matrix and link the interface of multi-domain proteins2 or protein complexes3,4. Their role in amyloid fibril formation is also well documented5,6.
From the thermodynamic point of view, their contributions to the stability of the folded state depend on the magnitude of the desolvation penalty7,8. The latter is alleviated when the salt-bridge is formed in a polar environment that compensates for the vanished exposure of the charged side-chains to water. Therefore stabilizing salt-bridges are generally part of extended networks of electrostatic interactions9,10. The free energy contribution to stability has been estimated experimentally to be in the range of −0.5 to −5 Kcal/mol depending on the system and on the location of the pairs11-14. In addition, the local rigidity caused by the ion-pairing might tune the kinetic stability of the protein15.
The importance of salt-bridges has been specifically addressed in the context of thermophilic proteins8,16,17 that are stable and functional at extreme temperatures, up to 100° C18,19. In fact a common feature shared by these proteins with respect to their mesophilic homologues is the higher number of charged amino-acids and salt-bridges20. Theoretical calculations pointed out that at the high working temperature of thermophiles the desolvation penalty reduces because of the smaller value of water’s dielectric constant7 therefore making ion-pairs more stable. According to other investigations, the stability gain associated to salt-bridges derives from an intrinsic overall higher polarity of the thermophilic proteins21 or from the specific location of the ion-pairs8,16.
In silico modeling of ion-pairs and their stability is a challenging task. When charged amino-acids are buried in the interior of proteins it is not trivial to assess their protonation states and their consequent propensity to pair. In the framework of implicit solvent calculation the ion-pair energetics depends on the assumed dielectric response of the protein8, but the latter is shown to be not spatially uniform22,23. On the other hand in an explicit solvent representation, the local polarity of the solvent/protein interface where the majority of charged amino-acids localizes, it is probably dependent on the model used for the water. Polarizable force fields should cure these weaknesses, but at a computational cost.
The modeling is naturally more approximate in coarse-grained (CG) simulations of biomolecules where the leading philosophy is to accelerate the sampling by reducing the model accuracy to “essential” degrees of freedom or to targeted properties of the system. In Martini force field24, Unres25, Scorpion26 or Shea’s model27, the electrostatics is explicitly introduced by localized effective charges, therefore salt-bridges form as the direct consequence of attractive Coulombic forces. In this context environmental effects depend on how the solvent polarity is treated. In the Scorpion force field26 the polarity of the aqueous solution is described at a high level of theory by introducing a CG polarizable model for water. In the Unres force field the ion-pair interactions are described by specific analytical potentials28. These potentials are made of several physical terms, i.e. electrostatic, Van der Waals, polarization and cavity formation, whose constituent parameters are optimized to match the potential of mean force (PMF) of side-chain-like ions in water. For the same CG model an important effort has been undertaken toward the development of state-dependent interactions25 to account for the temperature dependence of ion-pair stability.
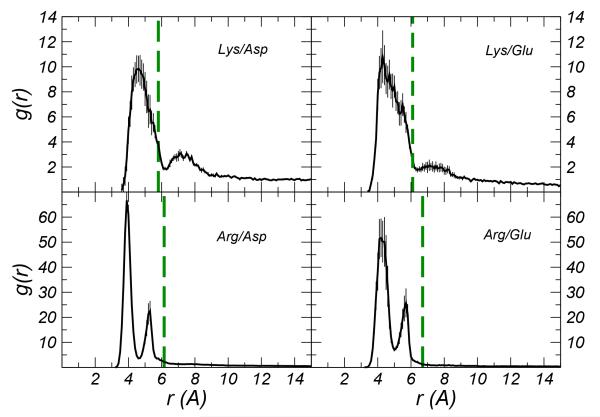
In other CG models electrostatic interactions are hidden in effective pair potentials29-32. In the OPEP force field (Optimized Potential for Efficient protein structure Prediction)33,34, that is the object of the present study, the potentials acting on opposite charged amino-acids are modeled with the Lennard-Jones-like function (LJ) used for other side-chain-side-chain interactions. As a consequence of this non-specific treatment, ion-pairs pack at a distance larger than that expected in real systems. For the four ion-pairs Arg/Asp, Arg/Glu, Lys/Asp and Lys/Glu we have compared the radial distribution functions of the distance between the side chains center of mass computed using all atom simulations and CG simulations based on the OPEP force field (see Figure 1). Using the OPEP CG model, the side-chains i) pack at larger distances, and ii) for pairs involving the arginine amino acid the doubly peaked structure of the distribution is lost.
Figure 1.
Radial distribution function g(r) between the center of mass of the side chains computed for the four ion-pairs considered in this work and obtained via all atom simulations at ambient conditions (black lines). The vertical dashed green lines report the value of the relative distance at which the side-chain grains of the ionic amino-acids of the same four pairs localize in the OPEP CG simulations; this value corresponds to the peak of the g(r). Error bars were estimated by block analysis.
In this work we have derived new effective interactions that improve the description of ion-pairs in the OPEP CG force field without introducing explicit electrostatic terms. The iterative Boltzmann inversion method35 was used to extract these potentials from all atom simulations by targeting the radial distribution function of the distance between the center of mass of the side-chains. The new potentials have been tested on several systems that differ in structural properties, thermodynamic stabilities and numbers of ion-pairs. The new model, that in future work will be referred to as OPEP v.5, by refining the packing of the charged amino-acids affects the stability of secondary structure motifs and the population of intermediate states during temperature folding/unfolding. Moreover it reduces the over-stabilization previously reported for OPEP v.336, and in the context of protein aggregation it eases inter-peptide contacts.
The remainder of this manuscript is organized as follows: In Section 2 we describe the modeling of ion-pair potentials following a bottom-up approach and in Section 3 we report the accurate testing for several study-cases; finally we conclude by highlighting the main finding of this work.
2 Methods
In this section we provide details of the methodology used to model the salt-bridge propensity in the CG OPEP force field v.4 for the following four amino-acid pairs: Arg/Asp, Arg/Glu, Lys/Asp, Lys/Glu. The parametrization is reserved for the side-chain-side-chain interactions of oppositely charged amino acids. In the simulations performed to validate our modeling other ionic interactions, such as like-charged amino acids or charged C- or N- terminals with charged side-chains, are modeled using the OPEP v.4 potentials as described in SI.
2.1 OPEP v.4
The OPEP CG model represents each amino-acid by six centers of force: the side-chain (Sc) is represented by a unique bead while atomistic resolution is reserved for the backbone that includes N,HN,Cα,C,O atoms. Exception is proline which is represented by all heavy atoms. The potential energy of the model is described in detail elsewhere33,34 and is briefly summarized in Supplemental Information (SI). As many force fields, the hamiltonian consists of short-range interactions for bond lengths, bond angles, improper torsions and rotations and long-range non-bonded interactions. In OPEP v.3 the van der Waals non-bonded interactions were originally described by either 6-12 or repulsive terms depending on the pairs of amino acids33 while in the version OPEP v.4 the Sc-Sc and Cα − Cα interactions are described by a new analytical form which limits the energy values at longer distances and optimizes the Sc-Sc interaction in α-helix34. Hydrogen bond propensity of backbone atoms is also accounted for via two-body and four-body potentials. Solvent effects are included implicitly by optimizing the torsion and non-bonded parameters. The previous versions of the model (v.3 and v.4) have been successfully applied to protein folding and structure prediction, amyloid formation and protein stability. OPEP has been used in combination with a broad range of simulation techniques such as the molecular dynamics (MD)37, Monte Carlo (MC)38, enhanced sampling methods (i.e. replica exchange MD (REMD), metadynamics, simulated tempering)36,39-42 and greedy algorithm43.
2.2 Iterative Boltzmann Inversion
In order to patch the OPEP force field we have derived the effective ion-pair potentials directly from atomistic simulations by applying the iterative Boltzmann inversion method (IBI)35. The four amino-acid pairs have been simulated using classical MD at ambient conditions, T = 300K and P = 1atm, using the OPLS force field44,45 for the amino-acids and the TIP3P model for water, see Figure 1. In order to avoid extra ionic interactions and mimic the environment along a poly-peptide chain the backbone terminals were kept in neutral form with NH2 and COOH groups (see SI). In our calculations we have simulated the pairs of entire amino-acids instead of side-chain-like ions28 in order to include side-chain length effects and the hydrophobic contributions stemming from the methyl groups CHxs. In order to improve the convergence of the procedure the radial distribution functions (RDF) between the center of mass of the amino-acid side chains extracted from the atomistic simulations have been first smoothed with a high order polynomial fit. Moreover, as Figure 1 shows, the RDFs involving the arginine amino-acid are characterized by two peaks. We have treated separately these two states by decomposing the RDFs in two parts; we will discuss later the microscopic origin of these two states and the strategy adopted for mixing the associated potentials. We anticipate here that in order to decompose the RDF, the tail of the first peak had to be smoothed to the asymptotic value of 1 using an exponential decay.
In the IBI procedure35,46 the effective potential Veff(r) to be used in the CG simulations is derived iteratively by targeting the atomistic RDF. At the nth step of the iteration the relationships at work are:
| (1) |
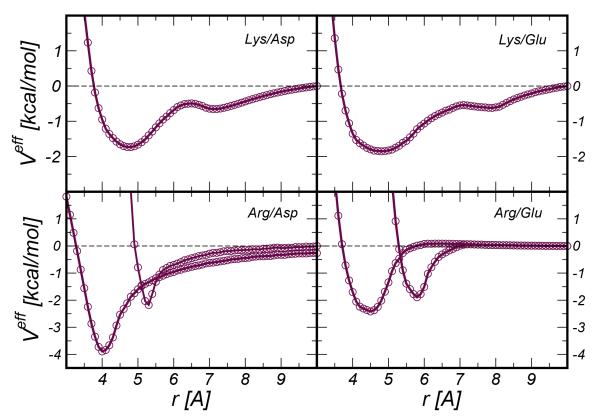
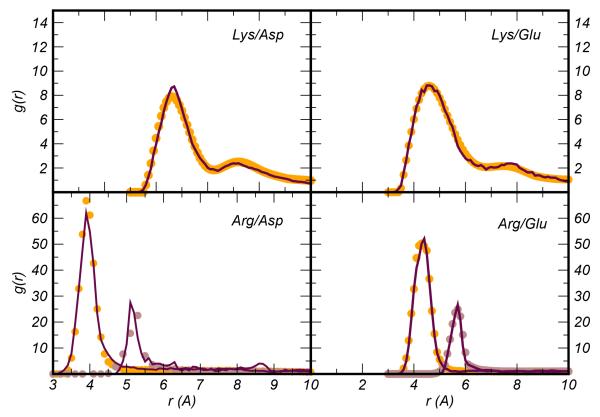
where the factor λ ∈ [0,1] is a coefficient that controls the numerical stability of the iteration and the term V(1) = −kbT ln(gref). In the formulae the dependence on the distance r is dropped to make notation light. The term gref denotes the RDF between the centers of force representing the effective particles (in our case the center of mass of the amino-acid side-chains) and is extracted from atomistic simulations. Our potential Veff was derived by applying triangular smoothing on a regular grid of spacing d=0.1 Å. For each iteration the CG simulation was run for 1.5 ns at T=300 K using a timestep of 1.5 fs. The amino-acid pair was confined in a sphere of radius 35 Å with reflecting boundary conditions and the temperature was kept constant by applying the Berendsen thermostat (τB=0.1 ps). A previous test of the OPEP v.3 FF reported a very weak effect of the thermostat (Berendsen vs Langevin) on the average structures and heat capacities of the simulated proteins47. Bonds were kept rigid using the SHAKE procedure48. The effective forces Feff = −▽Veff were calculated using linear interpolation. Each IBI procedure consisted of about 100-200 iterations even if the convergence could generally be attained with less effort (30-40 iterations), with saturating at 10−2. The resulting potentials were further polished by extrapolating the behavior at short distance via a LJ repulsion, r12, and modeling the tail at long distance either with an exponential function or a r−6 attractive part; the minima and desolvation peaks were also refined by polynomial smoothing46. The effect of this smoothing on two representative cases is shown in the SI Figure 1. The smoothing cleans the potentials at long-distance where the noise due to poor sampling is large. The Veff potentials and the associated RDFs compared to those obtained via all atom simulations are reported in Figure 2 and Figure 3, respectively. All the modeling was produced with in house developed codes interfacing the OPEP MD engine.
Figure 2.
Effective potential Veff for the four ion-pairs Lys/Asp, Lys/Glu,Arg/Asp,Arg/Glu. In the lower panels for each pair involving the Arg we distinguished the potentials for state 1 and state 2
Figure 3.
Radial distribution function g(r) between the center of mass of the side chains computed for the four ion-pairs considered in this work and obtained via all atom simulations (dotted black lines) and the converged CG simulations during the IBI procedure (solid maroon lines). The g(r) from all atom simulations have been smoothed before applying the IBI procedure. The smoothed curves are represented in orange and brown circles (see second state in Arg/x curves).
2.3 Two state model for Arg
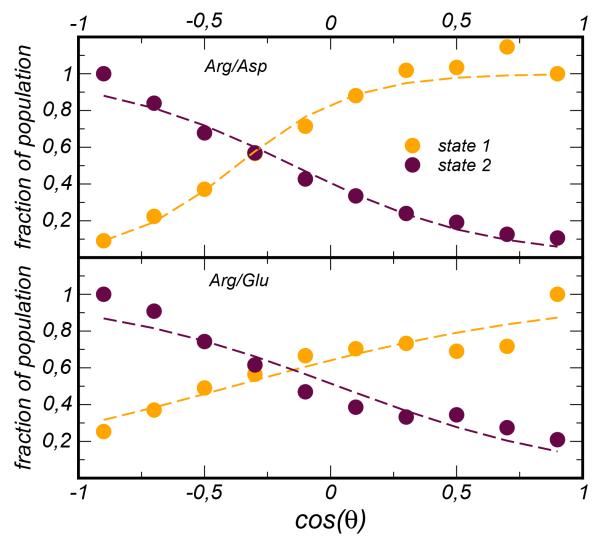
We discuss now how the two-state distribution associated with the arginine amino-acid was treated. These states correspond to two different HB patterns between the carboxylate CO2− group and the guanidinium group (NHC(NH2)2)+ (see the amino-acid structures represented in SI Figure 2). An effective intuitive order parameter that distinguishes them is the relative orientation of the side-chains, here defined as the scalar product between the rigid unit vector that connects the backbone Cα to the center of mass of the side-chain, cos(θ) = ni · nj. The 2D joint probability distribution p(r,cos(θ)) (see SI Figure 3) shows that approximately one state is associated to a head-to-head configuration while another to a parallel configuration. Instead of working with a 2D potential we have simplified the task by introducing a mixing rule:
| (2) |
where refers to the potential associated to state 1(2) for the interaction of Arg with the amino acid x=Asp,Glu, and the coefficients are weights that depend on the value of cos(θ). In order to determine the weights we have computed the population of states 1 and 2 as a function of cos(θ) and used a convenient sigmoid function to fit them, see Figure 4. In the present implementation the weights a1(2) are parameters and do not contribute directly to the force via their angular dependence.
Figure 4.
Fraction of population occupying the state 1 (yellow circles) and the state 2 (maroon circles) as a function of the order parameter cos(θ) and for the two ion-pairs Arg/Asp (top panel) and Arg/Glu (bottom panel). Data from all atom simulations are represented in circles, the fitting function, , is represented with dashed lines.
2.4 The energy scale
In the OPEP force field the interactions between the center of forces are all scaled with weighting factors (wx in SI) which are optimized to reproduce the energy spectra of folded, excited and unfolded configurations of a large set of peptides33 as well as the stability of selected proteins34. In the IBI procedure only isolated amino-acid ion-pairs have been considered, therefore the relative energy scale of the effective ion-pair potentials with respect to other side-chain interactions is a missing information. This has been tuned by a systematic testing on selected systems and discussed in Section 3. This scaling factor is indicated by f through the paper and is defined as the ratio between the energy at the minimum, ε0, calculated for the ion-pair Lys/Glu and the hydrophobic interaction Ile/Ile taken as reference value of the OPEP energy scale, . The term which includes its weighting factors is set to 4.46 Kcal/mol. In this work we used the version 4 of the OPEP force field34 and when the new potentials for ion-pairs are included the force field is referred to as OPEP/IP. In the limiting condition of f =0 no potential acts between the amino-acids of opposite charge.
2.5 The dependence on temperature
The effective potentials Veff, as CG models in general, are thermodynamically state dependent and their use in thermodynamic conditions different from the reference state could introduce artifacts49. However for many purposes CG models are routinely used to simulate systems in different temperature ranges, and often combined with enhanced sampling methods like REMD that fully exploit temperature excitation. In doing so one should pay attention to some aspects. Herein we have first investigated the response of the reference RDFs to temperature increase, see SI Figure 4. After Boltzmann inversion we noticed minor temperature changes (about 0.2 Kcal/mol) on the pairs involving the Lys amino-acid. On the contrary the temperature has a negligible effect for the pairs involving the Arg amino-acid. It was previously reported25 that Lys/Glu(Asp)-like interactions modeled by representative ions in water solution show a temperature dependence at the contact distance minimum, while the Arg/Asp(Glu) interactions are not affected by temperature changes. However, it is important to stress that for salt-bridges confined at biomolecular interfaces, like those in multi-domain proteins, the increase of the temperature could reduce the desolvation cost of an amount as large as −5 kcal/mol50, therefore making ion-pairs more stable in the high temperature regime.
Moreover when REMD method is used, as in the current work, the standard acceptance rate must be carefully re-derived to account for the dependence of the potential energy on the temperature. Given the set of replicas the probability for exchanging the copies i and j and generating the new set can be derived from the detailed balance conditions51. For a potential energy composed by a temperature independent (E(q)) and dependent part (Veff (q,T)) the swapping move is controlled by:
| (3) |
where the first contribution ΔβmnΔE = (βm − βn)(E(q(i))−E(q(j)) is that used in standard REMD, and the term Δveff is given by:
| (4) |
In this work all the REMD simulations were based on the . An accurate test of temperature dependent potentials is reserved for a future investigation.
3 Results
The derived potentials Veff have been tested against several systems comprising three short monomeric peptides, a dimeric peptide system, and a set of six proteins. These study-cases differ in structural properties, thermodynamic stabilities as well as the number of ion-pairs. In some cases all-atom simulations of the study-cases have been performed. In Table 1 the simulation details are summarized, while extra information concerning the protocols of the simulations are given in SI.
Table 1.
Coarse-grain and all-atom simulations performed in this work using different methodologies: standard Molecular Dynamics (MD), Replica Exchange MD (REMD), iterative Boltzmann inversion (IBI). For REMD simulations the number of replicas is reported in parenthesis. OPEP/IP indicates the OPEP force-field including the ion-pair interactions modeled in this work.
| System | Run Type | Time [ns] | Temperature [K] | Force Field |
|---|---|---|---|---|
|
| ||||
| AA pairs | MD | 200,600 | 300,360 | OPLS |
| AA pairs | IBI | 1.5 per step | 300 | OPEP v.4 |
|
| ||||
| RNase C-peptide RN24’ b | REMD (24) | 600 per replica | [300-475],[200-501]a | OPEP v.4/OPEP/IP |
| RNase C-peptide RN24’ b | REMD (48) | 50 per replica | [280-410] | OPLS |
|
| ||||
| RNase C-peptide WT | REMD (24) | 200 per replica | [300-475] | OPEP v.4/OPEP/IP |
|
| ||||
| β-hairpin | REMD (24) | 400,600 per replica | [300-475],[200-501]a | OPEP v.4,OPEP/IP |
| β-hairpin | REMD (48) | 70 per replica | [280-410] | OPLS/Amber99sb-ildn/Gromos |
| ccβ-p2 monomer | REMD (24) | 200 per replica | [200-501] | OPEP v.4,OPEP/IP |
| ccβ-p2 dimer | REMD (24) | 100,200 per replica | [200-501] | OPEP v.4,OPEP/IP |
|
| ||||
| 2DA1 | MD | 60 | 290 | OPEP/IP |
| 1CLB | MD | 30 | 290 | OPEP/IP |
| 1FCL | MD | 30 | 290 | OPEP/IP |
| 1E0L | MD | 60 | 290 | OPEP/IP |
| 1SHG | MD | 30 | 290 | OPEP/IP |
|
| ||||
| 1CM2 | MD | 60 | 300 | OPEP v.4/IP |
| 1CM2 | REMD (36) | 300 per replica | [220-536] | OPEP v.4,OPEP/IP |
| 1CM2 | MD | 100 | 300 | Charmm22 |
Range of temperature used for OPEP/IP and with a scaling factor f = 1.0 and f = 1.3.
Mutated system (K1A/E9L/M13A).
3.1 RNase C-peptide
The first system is the Ribonuclease A C-peptide that corresponds to the first 13 residues stretch at the N-terminal of the protein. First, we have considered the system with three single point mutations (K1A/E9L/M13A) → (AETAAAKFLRNHA), this peptide is indicated below as RN24’. This peptide capped with succinyl and NH2 groups (RN24)52, the wild type53 and other mutants54, have been well characterized experimentally by CD and NMR techniques as well as using computer simulations55. The RN24’ was already used as a test-case to assess the performance of the OPEP FF36. The C peptide is a representative model of α-helix and in the RN24 mutant the number of possible ion-pair combinations is only two (E2/K7 and E2/R10). The system RN24’ was simulated in its zwitterionic form by REMD. We used 24 copies of the system and the temperature range spanned by the replicas changed depending on the energy scaling factor f. Each individual replica was evolved using a timestep of 1.5 fs for an effective OPEP total time of 600 ns. For a selected energy scale ( f =1.3), we have also simulated the peptide without mutations (WT) for 200 ns per replica.
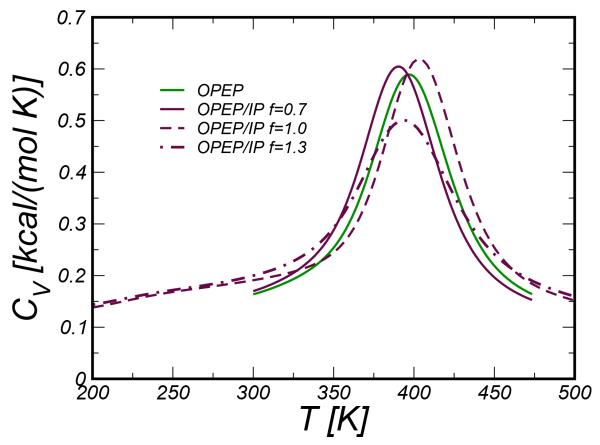
We have first monitored the stability of the RN24’ peptide and identified the melting temperature by computing the specific heat curve as a function of temperature. The specific heat is calculated from the fluctuation of the potential energy and its temperature dependence is handled by the PTWham algorithm56. The curves obtained for different values of the scaling factor f are plotted in Figure 5. The shape of the curves are rather similar, all showing a peak at about 390-400 K. The WT exhibits a quite similar behavior with Tm ≃410-420 K (data not shown). Experimentally the C-peptide was found to unfold above 303 K53, thus OPEP FFs over-stabilize these helical systems.
Figure 5.
Specific Heat CV curves for the RNase C-peptide system.
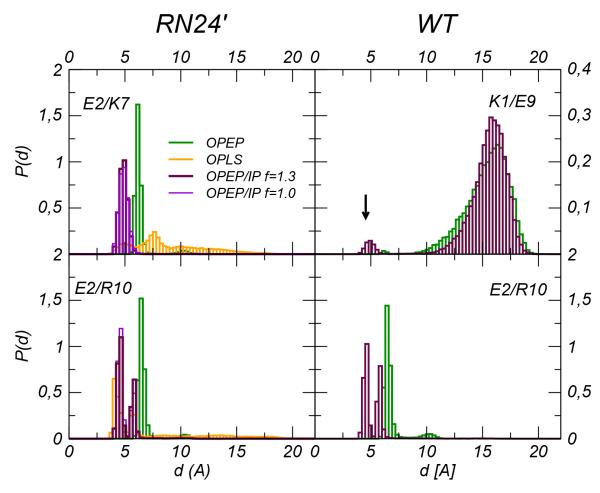
In the folded state, the peptide adopts an α-helix which is stabilized by intramolecular hydrogen bonds and salt-bridges. Experiments52,54 and simulations55 on the RN24 and other mutants have examined the role of the salt-bridge interaction Glu2-Arg10 on the helix stability. This ion-pair becomes key for the stability since the K1A/E9L mutations remove a competitive stronger ion-pair between Lys1 and Glu9. The Glu2-Arg10 ion-pair is well represented in the OPEP/IP with the two side chains interacting at about 4.5 Å while in the original OPEP the equilibrium distance is much larger, ~6 Å(see Figure 7). The close packing guided by the new potentials models well the experimental evidence of a direct HB between the two residues as it was suggested by NMR technique52,54 and as it was observed in the structures of the RNase protein. Moreover the OPEP/IP stabilizes this packing with minor fluctuations while in the original force field larger non-interacting distances, d > 10Å, are also sampled (6%).
Figure 7.
Peptide C. Left panels: Probability distribution of the distances between oppositely charged amino acids in the mutated C-peptide from OPEP v.4 (green) and OPEP/IP (maroon) and all atom OPLS (orange) REMD simulations. In the right panels distribution of the distances between the pair K1/E9 and E2/R10 in the WT C-peptide from OPEP v.4 (green) and OPEP/IP (maroon). Data refer to T=300K.
We have introduced an ad hoc parameter for counting the number of ion pairs formed during the simulation:
| (5) |
with d0=7 Å and i, j running over the Asp,Glu and Arg,Lys amino-acids, respectively.
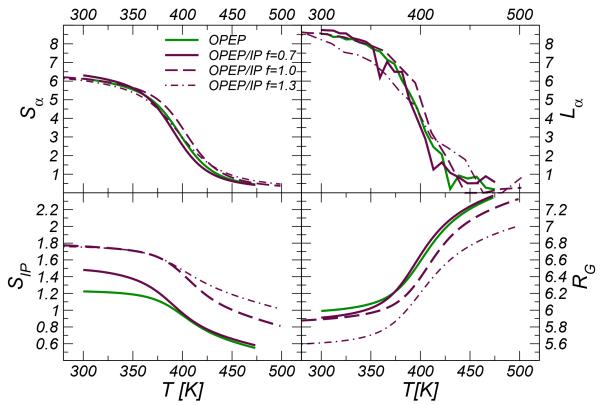
As shown in Figure 6 we find a higher value of SIP when the effective IP potentials are in use. The new potentials cause also a more extended/persistent and temperature resistant ion-pair network along the helix. In fact in the CG simulations a second pair is visible between Glu2-Lys7. REMD simulations have been carried out at the atomistic resolution for the same system confirming that a close arrangement of the side-chain center of mass of these two residues is probable (see the bottom-left panel of Figure 7). However this interaction does not represent a true ion-pair but mirrors instead the hydrophobic packing between the side-chains. The HB between the ionic groups of the amino-acids is formed rarely and occurs mainly in unfolded conformations. Upon unfolding and using the energy scaling factors f = 1.0 and 1.3, residual ion-pairings are still observed at high T, e.g. the bound states Glu2-Lys7 and Glu2-Arg10 are formed 70% and 50% of the simulation time at 420 K. Our finding suggests a stabilizing effect of these ion-pairs on the intermediate structures sampled during the helix folding. For sake of comparison we have calculated the distribution of the ion-pair distances in the WT system and inquired the propensity of the amino acids Lys1 and Glu9 to form a salt-bridge. Brooks et al. have shown using atomistic simulations55 that this pair competes with the Glu2-Arg10 salt bridge. Interestingly we note that even if with a low probability only the OPEP/IP potentials predict a bound state for the pair Lys1-Glu9, see the top-right panel in Figure 7.
Figure 6.
Average value of the hydrogen bond number (Sα), gyration radius (RG), number of ion-pairs (SIP) and α-helix length (Lα) formed along the RNase C-peptide as a function of temperature. Averages for all parameter but Lα are calculated using the PTwham algorithm56.
Intramolecular backbone HBs (Sα) 1 , gyration radius (Rg) and α-helix length (lα) 2 of the mutated system take very similar values at ambient temperature and their thermal disruption follows the same trend in both force fields, see Figure 6. It is worth noting that in our simulations at ambient condition the average helix lengths of the WT and RN24’ are comparable and encompass both about 7-8 residues, ~54-62% of the peptide length. In both peptides the helix starts at the level of the residue Ala4, and the last three residues of the N-terminus are not structured in agreement with the results from NMR52 and previous calculations36,55.
Overall on this system because of the small content of ionic interactions the refined potentials did not impacted the global stability compared to the original force field; however they improved the relative packing of ionic amino-acids.
3.2 β-hairpin
The second study-case is the GB1 β-hairpin (GEWTYDDATKTPTVTE) corresponding to the fragment 41-56 in the C-terminal of the GB1 immunoglobulin binding protein. For this system an increased number of ion-pairs is expected to form in folded and unfolded states. Again we used REMD with 24 copies and we tested several combinations of the scaling factor f. The peptide was simulated in zwitterionic form. Each individual replica was evolved for an effective OPEP time of 400-600 ns depending on the scaling factor and using a timestep of 1.5 fs.
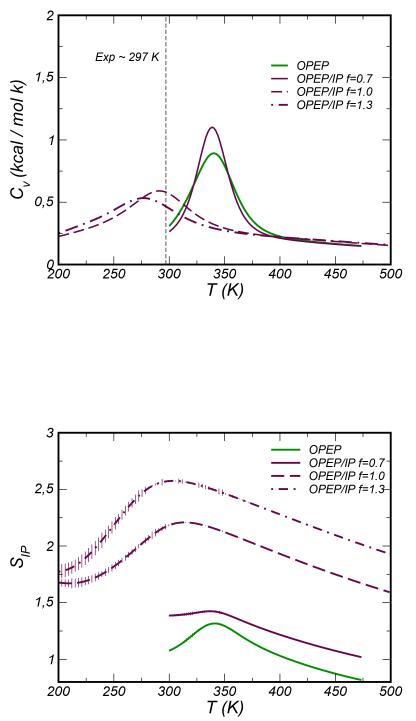
The specific heat curves obtained with OPEP and OPEP/IP using f = 0.7 are very similar with a peak at the melting temperature TM≃340 K. Increasing the energy scaling factor to f =1.0 and f = 1.3 the melting temperature downshifts to 280-290 K, values very close to that measured experimentally , see Figure 8. When folded, the stability of the β-sheet is ensured by inter-backbone HBs, hydrophobic packing of side-chains and by a very stable salt-bridge formed at the turn region (Asp7-Lys10)59. This pairing is very well described by OPEP/IP that enforces the CG beads to pack at the correct distance (see SI Figure 5). In the CG simulations we note that a conformational change of the turn region makes also favorable the interaction between Asp6 and Lys10. The frequency of this interaction and the packing distance distribution depend on the scaling factor f. We have checked whether this interaction is reproduced in REMD atomistic simulations and this is not the case for the commonly used force fields, i.e. Amber99sb-ildn, OPLS and Gromos. For these atomistic simulations we have reported in SI Figure 5 the distributions of the distances between the center of mass of opposite charged amino acids. Since Asp6-Lys10 packing is detected also using the original OPEP even if at a larger distance (~ 6 Å, see SI Figure 5 ), we deduce that this liaison did not derive from the specific form of the non-bonded interactions. It is mainly caused by the fluctuations of the torsional angles in the backbone and/or by the reduced resolution of the side-chains in the CG model. The former aspect has an impact on the accessible conformations of the turn region and the latter could remove both steric clashes and screening effects. On the other hand, it is worth noting that the residue Asp6 forms a stable interaction with the residue Thr1, and this bonding has been observed in previous atomistic simulations59 and pointed as an essential key for the stability of the folded state.
Figure 8.
Top Panel. Specific Heat CV curves for the β-hairpin system. Bottom Panel. Average number of Ion-Pairs computed for β-hairpin as a function of the temperature and using the PTwham algorithm56.
For all values of the scaling factor f the number of ion pairs counted according to Eq. (5) is non-monotonic with temperature as it is shown in the bottom panel of Figure 8, it first increases across the melting temperature because partially unfolded conformations allow long-range ion-pairing between the terminal acidic residues Glu2 and Glu16 and the basic residue Lys10. These conformations are characterized by a transition of the turn region toward an α-helix. The over-pairing smoothly disappears at higher temperatures. It is worth noting that in a recent study60 some microstates characterized by partial α-helix content have been observed to act as gateways for the folding of the β strand. The presence of helical structures in the unfolded peptide is a long-standing issue since they were detected in computer simulations, see discussion in refs60,61, but not in experiments58,62. The conflict might originate from some deficiencies of the atomistic force fields. In our study we observe a bell-like distribution of the helix content57 as a function of temperature. When the OPEP/IP FF is used the distribution has a peak around the TM, and at the peak the percentage to find an α-helix is 30 and 40% for f = 1.0 and 1.3, respectively.
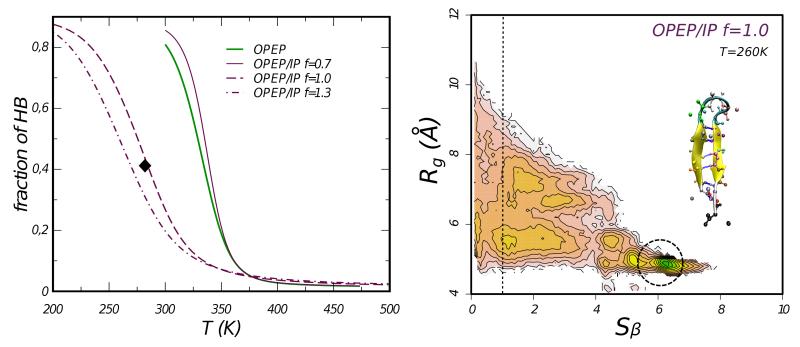
The folded state of the β-hairpin is effectively described by counting the number of HB formed across the backbone, or Sβ. The order parameter Sβ is defined using the same filtering as in the Eq. (5) but now considering the distance between the backbone amide hydrogens and carbonyl oxygens of residues i, j with j > i + 4; and by setting d0 = 3 Å. Sβ decreases with temperature according to a two-state model in agreement with experiment58 and previous computations60,61,63, see left panel of Figure 9. At the temperature T=282 K the OPEP/IP f =1.0 predicts a percentage of HBs of 43%, in excellent agreement with the estimate from NMR at the same T (42%)62.
Figure 9.
Left Panel. Fraction of HBs vs T. The black diamond indicates the experimental value62. Right Panel. 2D free energy surface (FES) of the β-hairpin computed at T=260K for the OPEP/IP model and using a scaling factor f = 1.0. Equi-surface lines at 1.5 kbT. A representative configuration of the folded state with root-mean-square-displacement of about 0.8 Å with respect to the native configuration extracted from the crystallographic structure pdbcode 1GB1.
A more global view of the conformational properties of the system is obtained by projecting the free energy landscape on a set of collective variables. For the β-hairpin the number of formed HB (Sβ) was used in combination with the gyration radius of the hydrophobic core of the peptide (Rg)36,61. The hydrophobic core is calculated including the heavy atoms and the side-chain beads of the residues Trp3, Tyr5, Phe12 and Val14. The free energy surfaces (FES) were computed using the PTwham algorithm56. In Figure 9 we report the landscape for OPEP/IP f = 1.0 at T=260K. The overall shape of the FESs obtained using OPEP and OPEP/IP looks similar below, close and above the associated TM (data not shown), and compares fairly well to what reported from atomistic simulations in ref36.
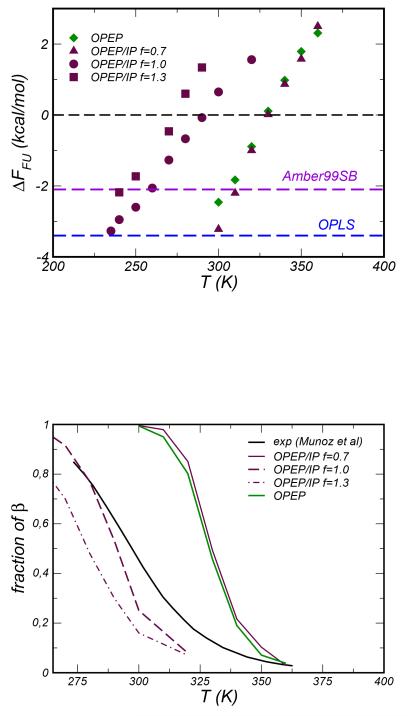
We have computed the free energy of unfolding, , by considering the probability distribution of the parameter Sβ and defining a convenient two-state dividing surface36: the folded conformations correspond to values of Sβ> 1 and the unfolded ones to values of Sβ< 1. In Figure 10 we report ΔFFU as a function of temperature. We notice a shift in the melting temperature (here defined at ΔFFU=0) and a different linear dependency of ΔFFU vsT upon increasing the factor f. The magnitude of the unfolding free energy compares fairly well with the estimates from atomistic simulations performed at T=300K and based on the OPLS and Amber99sb FFs, see data in36, these values are reported as dashed lines in the top panel of Figure 10. Finally, in the bottom panel of Figure 10 we compared the temperature variation of the folded population calculated in our simulations to that deduced experimentally from tryptophan fluorescence technique58. There is a good agreement below the melting temperature (293 K) when f =1.0; on the contrary the stronger energy scale f =1.3 compromises the stability of the peptide and the β conformation becomes readily unfavorable.
Figure 10.
Top Panel. Unfolding free energy as a function of the temperature for the β-hairpin system. The probability distribution of the number of HBs (P(Sβ)) is used to compute the population of the folded ((Sβ > 1)) and unfolded (Sβ < 1) states. Colored dashed lines indicate the value of ΔFFU reported in ref36 and estimated using atomistic simulations at T=300K by combined parallel tempering and metadynamics. Bottom Panel: fraction of β population estimated using the Sβ parameter and compared to experimental data from Munoz et al.58
For the β-hairpin the optimal scaling factor f = 1.0 allows to reproduce the experimental melting temperature as well as the number of HB and the content of β conformations in the folded state.
3.3 The ccβ-p2 switch peptide
The ccβ-p2 switch peptide is a repeat of alternate polar and hydrophobic residues, Ac-SREELEAKIRELELRIG-NH2 64. This peptide was designed to fold as a α-helix, but increasing temperature and in concentrated solution it forms irreversibly amyloid fibril. At low temperature coiled-coil structures stabilized by intra- and intermolecular salt-bridges are expected.
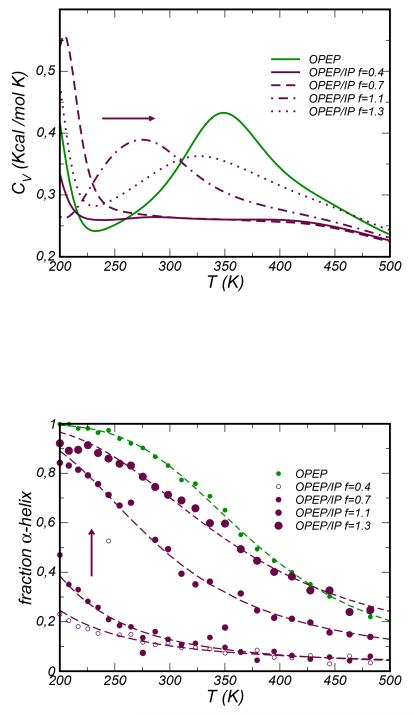
We first focus on the monomeric state. The original OPEP predicts a quite high melting temperature, TM=360 K (see Figure 11). Introducing the IP effective interactions the stability of the peptide strongly depends on the scaling factor f. The melting temperature shifts to very lower values for low f. For higher scaling factors f = 1.1 and 1.3, the TM increases to 270 and 330 K, respectively. We show below that these values stabilize the α-helix in the folded state in agreement with experiments64. The population of the α structure (pα) with respect to the total ensemble of sampled conformations is reported as a function of temperature in the lower panel of Figure 11 (the secondary structure prediction was based on the STRIDE algorithm57). Using the original OPEP the peptide fully occupies the α-helix state at low temperature (pα ~ 100% at T=200 K) and increasing the temperature it unfolds transforming into a random-coil. The population p(α) decreases as a function of temperature according to as predicted by a two-state model. This feature is reproduced by OPEP/IP only with a high value of the scaling factor. In particular the values f =1.1 and f = 1.3 produce pα ~ 80% and ~ 90% at T=200 K; on the contrary for smaller values of f the peptide samples solely the unfolded conformtions. We have estimated the unfolding enthalpy (ΔH) and entropy (ΔS) by fitting the temperature decay of p(α), and deduced that the achieved stability associated to high scaling factors f is purely enthalpic with a negligible entropic contribution. When formed, the α-helix covers about 65 – 70% (OPEP/IP f =1.1-1.3) and 70% (OPEP) of the peptide’s total length in very good agreement to what was reported in the original work by Kammerer and Steinmetz64 by applying the AGADIR algorithm65(70%). It is worth noting that the original OPEP does not make favorable the β structure, while introducing the effective IP potentials this motif becomes accessible even if not dominant. For example with OPEP/IP f = 1.1 the probability to occupy a pure β state at low temperature is pβ ~ 10%, and the motif extends to about 45% of the peptide.
Figure 11.
Top Panel. Specific Heat CV curves for the ccβ-p2 monomer system. Bottom Panel. Population of the pure α-helix state computed for the monomer ccβ-p2 as a function of temperatures and for several energy scales f. The population decay is fitted by a sigmoid function deriving from a two-state model.
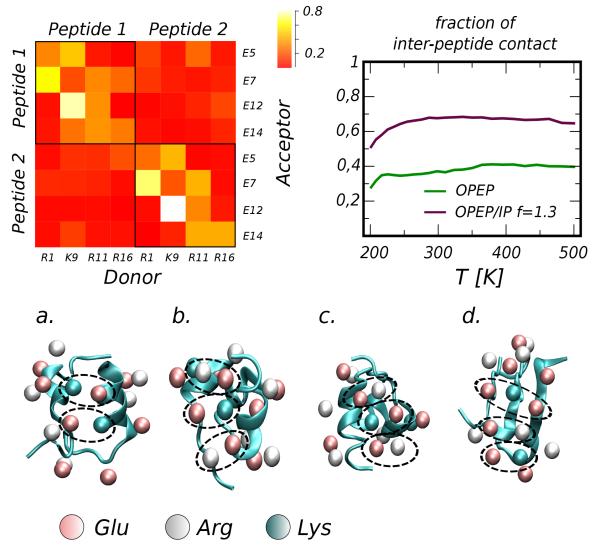
We turn our attention to the dimeric state. The two peptides are expected to form a coiled-coil aggregate at low T. Using the original OPEP force field we observe that in the low temperature regime (T=200-270 K) the pure α-helix structure is favored (pα ≃ 70%) but pure β structures can be also accessed (pβ ≃ 25%). The effective potential in OPEP/IP reverses the α/β populations when f =1.1, with the pure β structure being slightly more favorable (45%) than pure α (25%). Further increase of the scaling factor, f =1.3, makes the α-helix dominant in the folded state, pα ~ 60%, hence favoring the coiled-coil pairing. Moreover the refined ion-pair potentials increase the propensity to aggregate as shown in the right top panel of Figure 12. This is a long-range effect controlled by the tail of the new potentials that substantially differ from the previous modeling that was specifically constructed to be short range in nature34. In this regard, a comparison of the two models is provided in SI Figure 1. Several ion-pair patterns link the two peptides (see the frequency matrix in Figure 12) with a variety of relative orientations and not an unique parallel orientation as predicted by the designers64. It is worth mentioning here a previous work by Missimer and coworkers66 on the ccβ-p peptide. Using all-atom simulations of the aggregated trimeric state of the peptide in water solution66 they investigated the role of inter-helical ion-pairs on the stability of the coiled coil and it was noticed that at high temperature the network of possible inter-helical ion-pairs can accommodate stochastically the disorder induced by high-temperature.
Figure 12.
Top Panels. On the left: Frequency matrix of intra- and inter-peptide ion-pairs. On the right: Fraction of states in which the peptides are in contact and number of inter-peptide ion-pairs vs temperature (SIP). Lower panels. Representative aggregation states extracted from the simulation using OPEP/IP f =1.1: a-c) are representatives of coil-coiled states while d) is a β-sheet aggregate. We have highlighted several connectivity patterns and the underlying secondary structure of the two peptides: in panel a) the formed ion-pairs are E(1)7/K(2)9 and K(1)9/E(2)5; in b) and c) E(1)12/R(2)16,K(1)9/E(2)14 and E(1)5/R(2)11; in d) E(2)7/K(1)9/E(1)14 and R(2)1/E(1)7/R(1)16.
In both force fields and for all tested scaling factors f we do not see dominant β structures at high temperature (even if rarely sampled, see Figure 12) as experimentally observed; this is because in our dimeric system there is no reservoir of peptides for nucleating the growth of fibrils.
In conclusion, for the switch peptide, when the scaling factor is correctly tuned (f=1.1 and 1.3), the OPEP/IP potentials provide a stability of the helical conformation close to the original OPEP in agreement with the experiments but also improve the propensity to aggregate and make accessible the β conformers as expected by the designers64.
3.4 Protein stability
We turn our attention to larger systems. We have selected five proteins with size between 37 and 75 residues. These proteins (PDB codes: 2DA1, 1CLB, 1FCL, 1E0L, 1SHG) already served as test-cases to assess the protein stability with the OPEP v.4 FF, see34. We have performed MD simulations with the new OPEP/IP potentials and various scaling factors f. The systems were first equilibrated with harmonic restrains on Cα atoms, then the trajectory was evolved for 30 ns for each system and value of f. The Cα RMSD calculated on the protein rigid-cores are reported in Table 2. For the lowest value f=0.9 all proteins but one (1SHG) exhibit a remarkable stability on the explored time-scale; at a higher value f =1.0 two systems (1FCL and 1SHG) experience a larger deviation with respect to the experimental crystal structure, a signature of a minor structural distortion. By visual inspection we observed that for these proteins the long-range nature of the new-potentials favors some local pairings that are not present in the X-ray configuration and that distort the relative orientation of secondary structures. The highest scaling factor f =1.3 enhances even more this behavior. For the well behaving proteins 2DA1 and 1E0L we have have verified the stability on a longer time-scale (f =0.9 and tsim=60 ns) and found comparable Cα-RMSD, see data in parenthesis in Table 2, respectively. Finally, for 2DA1 we have monitored the effect of the thermostat on the structural stability by performing an extra simulation of 10 ns where temperature was controlled by the Langevin thermostat: On the same timescale the difference between the average Cα-RMSD is as small as 0.1 Å, (2.9±0.7 vs 2.8±0.3 Å).
Table 2.
Cα RMSD.(*) The data for 2DA1, 1CLB, 1FCL, 1E0L and 1SHG are taken from34. For sake of comparison with34 these systems were simulated at 290K. For the HPr system we report two RMSD values, one calculated after 30 ns of simulation and a second one in parenthesis after 60 ns.
| System | size | rigid-core | aa−/aa+ | v.5 f=0.9 | v.5 f=1.0 | v.5 f=1.3 | v.4* |
|---|---|---|---|---|---|---|---|
|
| |||||||
| 2DA1 | 60 | 16-63 | 8/13 | 2.9±0.5(3.2) | 3.4±0.6 | 3.8±0.5 | 3.2±0.2 |
| 1CLB | 75 | 3-14,20-39,47-53,60-73 | 17/10 | 3.3±0.3 | 3.2±0.3 | 5.0±0.3 | 2.9±0.2 |
| 1FCL | 56 | 3-55 | 10/6 | 3.7±0.9 | 4.3±0.8 | 8.6±0.4 | 2.8±0.2 |
| 1E0L | 37 | 7-33 | 6/5 | 3.1±0.3 (3.1) | 3.1±0.3 | 5.4±0.2 | 2.1±0.5 |
| 1SHG | 57 | 8-11,29-61 | 9/11 | 4.3±0.5 | 5.0±0.8 | 8.2±0.7 | 2.4±0.3 |
|
| |||||||
| 1CM2 | 85 | 2-9, 15-28,31-52, 58-84 | 11/8 | 5.3±0.6(5.9) | 5.0±0.5(4.9) | 4.3±0.4(4.6) | 4.2±0.4(4.3) |
The final test is performed on a protein of larger size (85 residues): the histidine-containing protein (HPr) from E. coli. Its fold owns both α-helices and β-sheets. The number of charged amino acids is 19, of which 8 are basic and 11 acidic. Experimentally the protein is stable up to the melting temperature TM=336 K and has optimal stability at 290 K67. The protein was simulated with the single point mutation H15A (Pdbcode 1CM2).
We have first investigated the stability of the secondary structure of the protein as compared to what was observed in atomistic simulations at the same thermodynamic conditions. The CG trajectories were evolved at T=300 K for about 60 ns using a timestep of 1.5 fs and several values of the scaling factor f. The original OPEP force field preserves quite well the overall structure of the protein as mirrored by the rmsd with respect to the crystallographic structure that fluctuates steadily around the value of 4 Å. However a major deficiency is manifested when looking at the stability of the secondary structure. The short α-helix Ser46-Thr52 unfolds shortly after the equilibration phase. This instability is cured by OPEP/IP with a scaling factor f =1.3. However on longer time scale, as also observed for 1FCL and 1SHG proteins, a too strong ion-paring causes instability in another part of the protein, the helix-1 (Thr16-Glu25).
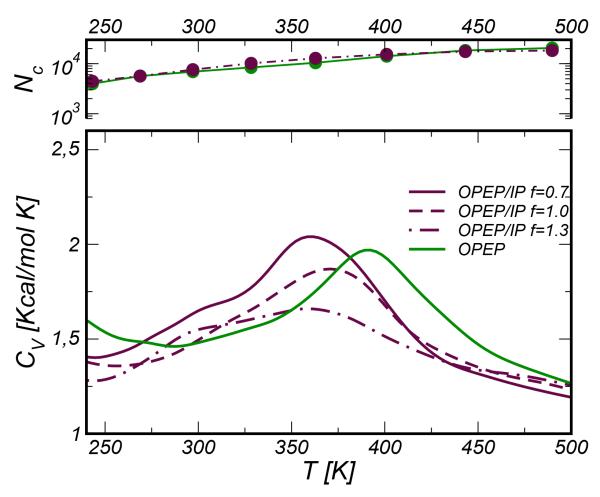
The response to temperature was examined via REMD with 24 replicas spanning the range 220-530 K. Each replica has been simulated for 300 ns. The melting temperature derived from the OPEP simulations Tm=400 K is rather high compared to the experimental value of 336 K, see Figure 13. However, as already observed for β-hairpin, when the IP potentials are switched on TM shifts down approaching a more realistic value, TM ≃ 360 K. It is worth noting that even classical all-atom force-fields generally overestimate the melting temperature of proteins with a shift of about 30-40 K68. The relative occupation of the folded state as a function of selected temperatures is reported in SI Figure 6.
Figure 13.
Specific heat curve for the HPr protein. In the inset graph the Sβ parameter is reported. Top panel: number of conformational states visited by the protein as a function of the temperature.
In the temperature window 300-400 K the number of sub-states visited by the protein in OPEP/IP simulation ( f = 1.3) is about 20% larger than with OPEP. This has been quantified by computing the number of clusters formed at a selected temperature with Cα-rmsd as metric and a cutoff of 5 Å, see top panel in Figure 13. This finding suggests, as previously noted for the β-hairpin, that a refined description of ion-pairing impacts not only the folded conformations but also the possible intermediates toward the unfolded state. It is however important to stress that in CG simulations the over-pairing and the preserved local-structures in partially unfolded conformers could be in principle favored by the lack of an explicit representation of the solvent and hence of its competitive solvation forces.
4 Conclusion
In this work we have introduced ad hoc potentials for describing ion-pair interactions in the OPEP force field33,34 without including electrostatics explicitly. The potentials have been derived according to a bottom-up procedure using the iterative Boltzmann inversion method that targets the radial distribution function between the side-chain centers of mass of ionic amino-acid pairs. The targeted RDFs are extracted from atomistic simulations with explicit solvent at ambient conditions. The force field including these effective interactions has been tested against a large set of study-cases. An optimal range of values for the energy scale of the ion-pair interactions with respect to the other force field terms has been determined, f = 0.9 − 1.0. These values ensure the optimal stability of small size proteins on the time-scale of tenths of nanoseconds; moreover for the β-hairpin and HPr proteins they allow to calculate melting temperatures which are closer to the experimental estimates. In some cases, higher values of f performed better as we observed for the ccβ-p2 switch-peptide. However, we believe to be a general safe protocol, for any new system, to perform preliminary tests and assess the best scaling factor.
We observed that the new potentials, by refining the relative packing of ion-pairs, have an impact on the stability of the folded conformations and on the population of intermediate states. They have also important effect on peptide aggregation. Moreover they reduce the over-stabilization previously reported for the OPEP force field36. In short, the new version of OPEP that from now will be referred to as version 5 has the potentiality to describe more realistically a large spectrum of situations where salt-bridges are key interactions. In future work we will explicitly deal with the temperature dependence of these interactions and how simplified solvent effects can be introduced at the level of a hydrodynamics description69.
Supplementary Material
Acknowledgement
FS and MK: The research leading to these results has received funding from the European Research Council under the European Community’s Seventh Framework Programme (FP7/2007-2013) Grant Agreement no.258748. We are grateful to CINES HPC for allocated computational time in Jade (DARI 2012 c2012086818). We acknowledge the financial support for infrastructures from ANR-11-LABX-0011-01.
Footnotes
For counting the hydrogen bonds we have defined the parameter Sα in the same spirit of Eq. (5) and monitoring the distance between the amide hydrogens and the carbonyl oxygens in the backbone (d0 is set to 3 Å and we consider only (i,i+4) interactions with i indicating the residue index)
Secondary structures were predicted using the STRIDE algorithm57
References
- (1).Kumar S, Nussinov R. J. Mol. Biol. 1999;293:1241–1255. doi: 10.1006/jmbi.1999.3218. [DOI] [PubMed] [Google Scholar]
- (2).Zhang X, Meining W, Fischer M, Bacher A, Ladenstein R. J. Mol. Biol. 2001;306:1099–1114. doi: 10.1006/jmbi.2000.4435. [DOI] [PubMed] [Google Scholar]
- (3).Sheinerman FB, Honig B. J. Mol. Biol. 2002;318:161–177. doi: 10.1016/S0022-2836(02)00030-X. [DOI] [PubMed] [Google Scholar]
- (4).Salari R, Chong LT. J. Phys. Chem. Lett. 2010;1:2844–2848. doi: 10.1021/jz1010863. [DOI] [PMC free article] [PubMed] [Google Scholar]
- (5).López de la Paz M, Goldie K, Zurdo J, Lacroix E, Dobson CM, Hoenger A, Serrano L. Proc. Natl. Acad. Sci. USA. 2002;99:16052–16057. doi: 10.1073/pnas.252340199. [DOI] [PMC free article] [PubMed] [Google Scholar]
- (6).Speare JO, Rush TS, Bloom ME, Caughey B. J. Biol. Chem. 2003;278:12522–12529. doi: 10.1074/jbc.M211599200. [DOI] [PubMed] [Google Scholar]
- (7).Elcock AH. J. Mol. Biol. 1998;284:489–502. doi: 10.1006/jmbi.1998.2159. [DOI] [PubMed] [Google Scholar]
- (8).Xiao L, Honig B. J. Mol. Biol. 1999;289:1435–44. doi: 10.1006/jmbi.1999.2810. [DOI] [PubMed] [Google Scholar]
- (9).A.G. G, Gribenko AV, Makhatadze GI. Protein Sci. 2008;17:1285–1290. doi: 10.1110/ps.034975.108. [DOI] [PMC free article] [PubMed] [Google Scholar]
- (10).Donald JE, Kulp DW, DeGrado WF. Proteins. 2011;79:898–915. doi: 10.1002/prot.22927. [DOI] [PMC free article] [PubMed] [Google Scholar]
- (11).Tissot AC, Vuilleumier S, Fersht AR. Biochemistry. 1996;35:6786–6794. doi: 10.1021/bi952930e. [DOI] [PubMed] [Google Scholar]
- (12).Strop P, Mayo SL. Biochemistry. 2000;39:1251–1255. doi: 10.1021/bi992257j. [DOI] [PubMed] [Google Scholar]
- (13).Luisi DL, Snow CD, Lin J-J, Hendsch ZS, Tidor B, Raleigh DP. Biochemistry. 2003;42:7050–7060. doi: 10.1021/bi027202n. [DOI] [PubMed] [Google Scholar]
- (14).Makhatadze GI, Loladze VV, Ermolenko DN, Chen X, Thomas ST. J. Mol. Biol. 2003;327:1135–1148. doi: 10.1016/s0022-2836(03)00233-x. [DOI] [PubMed] [Google Scholar]
- (15).Gruia AD, Fischer S, Smith JC. Chem. Phys. Lett. 2004;385:337–340. [Google Scholar]
- (16).Kumar S, Ma B, Tsai CJ, Nussinov R. Proteins. 2000;38:368–83. doi: 10.1002/(sici)1097-0134(20000301)38:4<368::aid-prot3>3.0.co;2-r. [DOI] [PubMed] [Google Scholar]
- (17).Thomas AS, Elcock AH. J. Am. Chem. Soc. 2004;126:2208–14. doi: 10.1021/ja039159c. [DOI] [PubMed] [Google Scholar]
- (18).Vieille C, Zeikus GJ. Microbiol. Mol. Biol. Rev. 2001;65:1–43. doi: 10.1128/MMBR.65.1.1-43.2001. [DOI] [PMC free article] [PubMed] [Google Scholar]
- (19).Sterpone F, Melchionna S. Chem. Soc. Rev. 2012;41:1665–1676. doi: 10.1039/c1cs15199a. [DOI] [PMC free article] [PubMed] [Google Scholar]
- (20).Karshikoff A, Ladenstein R. Trends Biochem. Sci. 2001;26:550–6. doi: 10.1016/s0968-0004(01)01918-1. [DOI] [PubMed] [Google Scholar]
- (21).Dominy BN, Minoux H, Brooks CL., 3rd Proteins. 2004;57:128–41. doi: 10.1002/prot.20190. [DOI] [PubMed] [Google Scholar]
- (22).Simonson T, Perahia D. Proc. Natl. Acad. Sci. USA. 1995;92:1082–1086. doi: 10.1073/pnas.92.4.1082. [DOI] [PMC free article] [PubMed] [Google Scholar]
- (23).Guest WC, Cashmanb NR, Plotkin SS. Phys. Chem. Chem. Phys. 2011;13:6286–6295. doi: 10.1039/c0cp02061c. [DOI] [PubMed] [Google Scholar]
- (24).de Jong DH, Singh G, Bennett WFD, Arnarez C, Wassenaar TA, Schäfer LV, Periole X, Tieleman DP, Marrink SJ. J. Chem. Theory Comput. 2013;9:687–697. doi: 10.1021/ct300646g. [DOI] [PubMed] [Google Scholar]
- (25).Sobolewski E, Oldziej S, Wiśniewska M, Liwo A, Makowski M. J. Phys. Chem. B. 2012;116:6844–6853. doi: 10.1021/jp212593h. [DOI] [PMC free article] [PubMed] [Google Scholar]
- (26).Basdevant N, Borgis D, Ha-Duong T. J. Chem. Theory Comput. 2013;9:803–813. doi: 10.1021/ct300943w. [DOI] [PubMed] [Google Scholar]
- (27).Bellesia G, Shea J-E. J. Chem. Phys. 2009;130:145103. doi: 10.1063/1.3108461. [DOI] [PubMed] [Google Scholar]
- (28).Makowski M, Liwo A, Scheraga HA. J. Phys. Chem. B. 2011;115:6130–6137. doi: 10.1021/jp111259e. [DOI] [PMC free article] [PubMed] [Google Scholar]
- (29).Betancourt MR, T. D. Protein Sci. 1999;8 doi: 10.1110/ps.8.2.361. [DOI] [PMC free article] [PubMed] [Google Scholar]
- (30).Ding F, Buldyrev SV, Dokholyan NV. Biophys. J. 2005;88:147–155. doi: 10.1529/biophysj.104.046375. [DOI] [PMC free article] [PubMed] [Google Scholar]
- (31).Májek P, Elber R. Proteins. 2009;76:822–836. doi: 10.1002/prot.22388. [DOI] [PMC free article] [PubMed] [Google Scholar]
- (32).Cheon M, Chang I, Hall CK. Proteins. 2010;78:2950–2960. doi: 10.1002/prot.22817. [DOI] [PMC free article] [PubMed] [Google Scholar]
- (33).Maupetit J, Tuffery P, Derreumaux P. Proteins. 2007;69:394–408. doi: 10.1002/prot.21505. [DOI] [PubMed] [Google Scholar]
- (34).Chebaro Y, Pasquali S, Derreumaux P. J. Phys. Chem. B. 2012;116:8741–8752. doi: 10.1021/jp301665f. [DOI] [PubMed] [Google Scholar]
- (35).Pütz DRM, Müller-Plathe F. J. Comput. Chem. 2003;24:1624–1636. doi: 10.1002/jcc.10307. [DOI] [PubMed] [Google Scholar]
- (36).Barducci A, Bonomi M, Derreumaux P. J. Chem. Theory Comput. 2011;7:1928–1934. doi: 10.1021/ct100646f. [DOI] [PubMed] [Google Scholar]
- (37).Derreumaux P, Mousseau N. J. Chem. Phys. 2007;126:025101. doi: 10.1063/1.2408414. [DOI] [PubMed] [Google Scholar]
- (38).Derreumaux P. Phys. Rev. Lett. 2000;85:206–209. doi: 10.1103/PhysRevLett.85.206. [DOI] [PubMed] [Google Scholar]
- (39).Wei G, Derreumaux P, Mousseau N. J. Chem. Phys. 2003;119:6403. [Google Scholar]
- (40).Nasica-Labouze J, Meli M, Derreumaux P, Colombo G, Mousseau N. PLoS Comput. Biol. 2011;7:e1002051. doi: 10.1371/journal.pcbi.1002051. [DOI] [PMC free article] [PubMed] [Google Scholar]
- (41).Chebaro Y, Jiang P, Zang T, Mu Y, Nguyen PH, Mousseau N, Derreumaux P. J. Phys. Chem. B. 2012;116:8412–8422. doi: 10.1021/jp2118778. [DOI] [PubMed] [Google Scholar]
- (42).Nguyen PH, Okamoto Y, Derreumaux P. J. Chem. Phys. 2013;138 doi: 10.1063/1.4792046. [DOI] [PubMed] [Google Scholar]
- (43).Thévenet P, Shen Y, Guyon JMF, Derreumaux P, Tufféry P. Nucleic Acids Res. 2012;40:W288–93. doi: 10.1093/nar/gks419. [DOI] [PMC free article] [PubMed] [Google Scholar]
- (44).Jorgensen WL, Tirado-Rives J. J. Am. Chem. Soc. 1988;110:1657–1666. doi: 10.1021/ja00214a001. [DOI] [PubMed] [Google Scholar]
- (45).Kaminski GA, Friesner RA, Tirado-Rives J, Jorgensen WL. J. Phys. Chem. B. 2001;105:6474–6487. [Google Scholar]
- (46).Rühle V, Junghans C, Lukyanov A, Kremer K, K., Andrienko D. J. Chem. Theory Comput. 2009;5:3211–3223. doi: 10.1021/ct900369w. [DOI] [PubMed] [Google Scholar]
- (47).Spill YG, Pasquali S, Derreumaux P. J. Chem. Theory Comput. 2011;7:1502–1510. doi: 10.1021/ct100619p. [DOI] [PubMed] [Google Scholar]
- (48).Ryckaert J-P, Ciccotti G, HJC HB. J. Comput. Phys. 1977;23:327–341. [Google Scholar]
- (49).D’Adamo G, Pelissetto A, Pierleoni C. arXiv:1211.2694 [cond-mat.stat-mech]
- (50).Salari R, Chong LT. J. Phys. Chem. B. 2012;116:2561–2567. doi: 10.1021/jp210172b. [DOI] [PubMed] [Google Scholar]
- (51).Mitsutake A, Sugita Y, Okamoto Y. Biopolymers. 2001;60:96–123. doi: 10.1002/1097-0282(2001)60:2<96::AID-BIP1007>3.0.CO;2-F. [DOI] [PubMed] [Google Scholar]
- (52).Osterhout JJ, Baldwin RL, York EJ, Stewart JM, Dyson HJ, Wright PE. Biochemistry. 1989;28:7059–7064. doi: 10.1021/bi00443a042. [DOI] [PubMed] [Google Scholar]
- (53).Bierzynski A, Kim PS, Baldwin RL. Proc. Natl. Acad. Sci. USA. 1982;79:2470–2474. doi: 10.1073/pnas.79.8.2470. [DOI] [PMC free article] [PubMed] [Google Scholar]
- (54).Fairman R, Shoemaker KR, York EJ, Stewart JM, Baldwin RL. Biophys Chem. 1990;37:107–119. doi: 10.1016/0301-4622(90)88012-h. [DOI] [PubMed] [Google Scholar]
- (55).Khandogin J, Chen J, Brooks CL. Proc. Natl. Acad. Sci. USA. 2006;103:18546–18550. doi: 10.1073/pnas.0605216103. [DOI] [PMC free article] [PubMed] [Google Scholar]
- (56).Chodera JD, Swope WC, Pitera JW, Seok C, Dill KA. J. Chem. Theory Comput. 2007;3:26–41. doi: 10.1021/ct0502864. [DOI] [PubMed] [Google Scholar]
- (57).Frishman D, Argos P. Proteins. 1995;23:566–579. doi: 10.1002/prot.340230412. [DOI] [PubMed] [Google Scholar]
- (58).Munoz V, Thompson PA, Hofrichter J, Eaton WA. Nature. 1997;390:196–199. doi: 10.1038/36626. [DOI] [PubMed] [Google Scholar]
- (59).Tsai J, Levitt M. Biophys. Chem. 2002;101:187–201. doi: 10.1016/s0301-4622(02)00198-9. [DOI] [PubMed] [Google Scholar]
- (60).De Sancho D, Mittal J, Best RB. J. Chem. Theory Comput. 2013;9:1743–1753. doi: 10.1021/ct301033r. [DOI] [PubMed] [Google Scholar]
- (61).Zhou R, Berne BJ, Germain R. Proc. Natl. Acad. Sci. USA. 2001;98:14931–14936. doi: 10.1073/pnas.201543998. [DOI] [PMC free article] [PubMed] [Google Scholar]
- (62).Blanco FJ, Rivas G, Serrano L. Nat. Struct. Mol. Biol. 1994;1:584–590. doi: 10.1038/nsb0994-584. [DOI] [PubMed] [Google Scholar]
- (63).Nguyen PH, Stock G, Mittag E, Hu C-K, Li MS. Proteins: Structure, Function, and Bioinformatics. 2005;61:795–808. doi: 10.1002/prot.20696. [DOI] [PubMed] [Google Scholar]
- (64).Kammerer RA, Steimetz MO. J. Struct. Biol. 2006;155:146–153. doi: 10.1016/j.jsb.2006.01.017. [DOI] [PubMed] [Google Scholar]
- (65).Lacroix E, Viguera A, Serrano L. J. Mol. Biol. 1998;284 doi: 10.1006/jmbi.1998.2145. [DOI] [PubMed] [Google Scholar]
- (66).Missimer JH, Steinmetz MO, Baron R, Winkler FK, Kammerer RA, Daura X, van Gunsteren WF. Protein Sci. 2007;16:1349–59. doi: 10.1110/ps.062542907. [DOI] [PMC free article] [PubMed] [Google Scholar]
- (67).Nicholson EM, Scholtz JM. Biochemistry. 1996;35:11369–11378. doi: 10.1021/bi960863y. [DOI] [PubMed] [Google Scholar]
- (68).Lindorff-Larsen K, Piana S, Dror R, Shaw D. Science. 2011;334:517–520. doi: 10.1126/science.1208351. [DOI] [PubMed] [Google Scholar]
- (69).Fyta M, Kaxiras E, Melchionna S, Succi S. Comput. Sci. Eng. 2008;10:10–19. [Google Scholar]
Associated Data
This section collects any data citations, data availability statements, or supplementary materials included in this article.


