

Highlights
-
•
Liver thioredoxin and its reductase are decreased after consuming a high-fat diet.
-
•
S-acylation may mediate the negative effect of a high-fat diet on these proteins.
-
•
High-fat diet also elevates 4-hydroxynonenal, another inhibitor of these proteins.
-
•
Dysfunction of these proteins is associated with insulin resistance.
Abbreviations: ASK-1, apoptosis signal-regulating kinase-1; HFD, high-fat diet; 4-HNE, 4-hydroxynonenal; IRS-1, insulin receptor substrate-1; ITT, insulin tolerance test; Gpx, glutathione peroxidase; OGTT, oral glucose tolerance test; PTP-1B, protein-tyrosine phophatase-1B; Trx, thioredoxin; TrxR, thioredoxin reductase
Keywords: High-fat diet, Insulin resistance, S-acylation, Thioredoxin, Thioredoxin reductase
Abstract
High-fat diet (HFD) can induce oxidative stress. Thioredoxin (Trx) and thioredoxin reductase (TrxR) are critical antioxidant proteins but how they are affected by HFD remains unclear. Using HFD-induced insulin-resistant mouse model, we show here that liver Trx and TrxR are significantly decreased, but, remarkably, the degree of their S-acylation is increased after consuming HFD. These HFD-induced changes in Trx/TrxR may reflect abnormalities of lipid metabolism and insulin signaling transduction. HFD-driven accumulation of 4-hydroxynonenal is another potential mechanism behind inactivation and decreased expression of Trx/TrxR. Thus, we propose HFD-induced impairment of liver Trx/TrxR as major contributor to oxidative stress and as a novel feature of insulin resistance.
1. Introduction
Oxidative stress results from an imbalance between the generation of reactive oxygen species (ROS) and cellular antioxidant capacities. After consuming high-fat diet (HFD), ROS production in rat liver was increased dramatically [1], which preceded the onset of insulin resistance [2], the key etiological defect that defines type 2 diabetes. There are a number of reported causes for HFD to induce oxidative stress. However, it remains unknown how thioredoxin (Trx) system, a critical antioxidant system, changes under HFD feeding conditions.
Trx system, consisting of Trx, thioredoxin reductase (TrxR) and NADP(H), is present in all living cells. TrxR catalyzes the reduction of Trx by NADPH. Mammalian TrxR is a selenoprotein with ROS scavenging ability [3]. The reduced form of Trx has diverse biological functions. For example, it acts as an electron donor for glutathione peroxidase [4] and Trx peroxidase [5] to remove H2O2 and organic peroxides; or serves as a direct inhibitor of apoptosis signal-regulating kinase-1 (ASK-1) against apoptosis [6]. The initial landmark observation in the relationship between Trx and redox state of insulin was made by Arne Holmgren [7], who showed the reduction of insulin disulfide by reduced Trx. Later studies demonstrated that Trx system could denitrosylate and trans-S-nitrosylate target proteins [8], which again links this system to insulin-related events because S-nitrosylation may influence insulin signaling pathway via regulating the activity of protein-tyrosine phophatase-1B (PTP-1B), a negative regulator of insulin signal transduction [9], or other insulin-signaling proteins [10]. However, it is somewhat puzzling that TrxR was reported to participate in the counter-regulation of insulin signaling by increasing liver PTP-1B activity [11]; in type 2 diabetes patients, the level of serum Trx was significantly higher than that in healthy controls [12]; whereas oxidants are overabundant in mammalian skeletal muscle under insulin-resistant conditions [13], similar etiologic events also occur in the liver [14]. Given that extracellular compartments are maintained at much more oxidizing potentials than cellular redox environment, the redox status of intracellular Trx system differs dramatically from that of extracellular (including serum) one, and this system is involved in different events depending on location, we therefore speculated that the change of Trx/TrxR in organs might be different from that in serum under insulin-resistant conditions. As liver has a supreme role in the onset of insulin resistance syndrome [15], in this study we examined how liver Trx and TrxR change in HFD-induced insulin-resistant mice.
2. Materials and methods
2.1. Animals and diets
All animal experiments were approved by the Animal Care and Use Committee of Beijing, China. 4-week-old male C57BL/6J mice were obtained from Animal Center of the Institute of Laboratory Animal Sciences, Chinese Academy of Medical Sciences & Peking Union Medical College. The animals were housed under conditions of controlled temperature (21–23 °C), humidity (40–60%), 12 h lighting (06:00–18:00)/dark (18:00–06:00) cycle. They were allowed ad libitum access to water and fed either with standard laboratory chows (composed of 12% fat, 62% carbohydrate and 26% protein based on caloric content for control group) or high-fat diets (composed of 50% fat, 36% carbohydrate and 14% protein based on caloric content for HFD group) for 13 weeks.
2.2. Characterization of insulin resistance
For oral glucose tolerance test (OGTT) and insulin tolerance test (ITT), the mice were fasted for 2 h before oral administration of glucose (2 g/kg) or before subcutaneous injection of insulin (0.26 U/kg). Blood samples were collected from the tail vein at 0, 30, 60 and 120 min, respectively, after glucose load or insulin load, and used to determine glucose concentrations. Area under the glucose concentration versus time curve (AUC) was calculated.
For hyperinsulinemic-euglycemic clamp test, the mice were fasted for 4–5 h, and then anesthetized with sodium pentobarbital (80 mg/kg i.p.) and given heparin (1 U/kg i.v.). The left internal jugular vein was catheterized for infusing insulin or glucose. The right internal jugular artery was catheterized for blood sampling. Blood (10 μl) was collected at 10 min interval to immediately measure plasma glucose concentrations. Afterwards, mice received a prime-continuous infusion of human insulin (Lilly, USA) at a rate 60 pmol/kg min using a Programmable Syringe Pump (Cole Parmer, USA). Blood glucose was clamped at the basal level (95 ± 5 mg/dl) with a variable rate infusion of 10% glucose using a Low-flow High-accuracy Pump (IPC, ISMATEC, Switzerland), to keep blood glucose levels stable. After at least 20 min, blood samples were taken to measure glucose infusion rate (GIR). The experiments were repeated three times and data were averaged.
Hepatic insulin-dependent glucose uptake was evaluated by injecting 2-(N-(7-nitrobenz-2-oxa-1,3-diazol-4-yl) amino)-2-deoxyglucose (2-NBDG, a fluorescent indicator for measuring glucose uptake) (250 μg/mice). After 60 min, the mice were killed by exsanguinations, and liver was immediately collected for preparing homogenate. Protein content and 2-NBDG fluorescence in liver homogenate were determined. Uptake of 2-NBDG was expressed as mg 2-NBDG/g protein.
Modified Folch’s method was used to extract total lipids from the livers. The level of triglyceride (TG) was determined using TG Assay Kit (BioSino Bio-technology and Science Inc., China).
2.3. Blood sample collection and protein extraction from mouse liver
Blood samples were collected from the orbital sinus of the mice that were food deprived overnight, followed by centrifugation at 3500 rpm/min for 10 min to obtain supernatants. After mice were sacrificed, livers were collected and snap frozen in liquid nitrogen, and then stored at −80 °C until used.
The frozen livers were pulverized, and then suspended in appropriate volumes of lysis buffer [containing 8 M urea, 2 M thiourea, 0.5% (w:v) CHAPS, 2% (w:v) ampholyte, 1% DTT, 1 mM PMSF, 50 μg/ml DNaseI, 50 μg/ml Rnase]. Sonication was operated on ice using an ultrasonic probe, which was set for 20 cycles: 15 s sonication “ON” and 30 s sonication “OFF”, followed by centrifugation for 30 min at 14,000 rpm/min, 4 °C. The resulting supernatant was used as liver protein extracts. Protein concentration was determined using a Bradford protein assay kit.
2.4. Assay of liver Trx/TrxR
Trx/TrxR activity was determined using the modified method of super-insulin assay [16]. An assay mixture contained 0.25 M phosphate buffer, pH 7.5, 10 mM EDTA, 2 mM NADPH, 1.07 mM bovine insulin, and 40 μl TrxR (for measuring Trx) or Trx (for measuring TrxR). The working solution of Trx or TrxR had been standardized through diluting its stock solution with 50 mM potassium phosphate buffer, pH 7.5 containing 1 mM EDTA (PE buffer), to give a final TrxR activity of Δ150 mA 412 nm/min or a final Trx activity of Δ10 mA 340 nm/min in 100 μl reaction volume. The reaction was started by mixing 20 μl of liver extract with 40 μl assay mixture, and incubated at room temperature for 30 min. The reaction was terminated by adding 150 μl of 0.1 mM DTNB-8 M Gua·HCl in 0.2 M phosphate buffer, pH 7.5. Trx/TrxR activity was measured by following an increase in absorbance at 412 nm due to Trx/TrxR-dependent reduction of DTNB to TNB−, and expressed as ΔA412 nm/mg protein·min. A value of control reaction, in which the liver extract was not added until the termination of the reaction, was determined to correct for non Trx/TrxR-dependent reduction of DTNB. Protein levels of Trx/TrxR were determined by Western blotting.
Total tissue RNA was extracted from the livers of mice using Trizol reagent (Invitrogen, USA). The mRNA (1 μg) was first reverse-transcribed into cDNA with cDNA reverse transcriptase (Promega, USA). RealTime (RT)-PCR was performed using 2 μl of ten-times diluted cDNA in a 25 μl reaction volume with an ABI GeneAmp 5700 Sequence Detection System and QuantiTect SYBR Green PCR Master Mix (Toyobo, Japan). The sequence of the primers were: Trx1 forward, 5′-CGT GGT GGA CTT CTC TGC TAC GTG GTG-3′; Trx1 reverse, 5′-GGT CGG CAT GCA TTT GAC TTC ACA GTC-3′; TrxR1 forward, 5′-GGC CAA CAA AAT CGG TGA ACA CAT GGA AG-3′; TrxR1 reverse, 5′-CGC CAG CAA CAC TGT GTT AAA TTC GCC CT-3′; β-action forward, 5′-AGC CAT GTA CGT AGC CAT CC-3′; β-action reverse, 5′-CTC TCA GCT GTG GTG GTG AA-3′. The mRNA levels of Trx1 and TrxR1 were normalized to the internal control β-actin as a housekeeping gene. Thermal cycle conditions were as follows: incubation at 95 °C for 5 min followed by 40 cycles of denaturation at 95 °C for 15 s, annealing at 60 °C for 15 s and extension at 72 °C for 45 s. Relative expression of Trx1 and TrxR1 genes was analyzed through comparison to the reference gene (β-actin) expression using ABI GeneAmp 5700 SDS software.
2.5. Analysis of liver Trx1/TrxR1 S-acylation
Acyl-Biotin Exchange assay [17] was used with slight modification. Briefly, mouse livers were homogenated in lysis buffer containing 100 mM Tris–HCl, 2 mM EDTA, 2.5% SDS, 0.5% Triton and 1 mM PMSF, followed by ultrasonication and centrifugation to obtain supernatant and determine the content of total proteins. Then, the supernatant was mixed with 50 mM iodoacetamide (IAM), and stayed at 37 °C for 5 h in the dark, followed by dialysis against 100 mM Tris–HCl, 2 mM EDTA, pH 7.5 to remove the excess IAM. The resulting sample was mixed with 50 mM NH2OH and incubated at 37 °C for another 5 h, then divided into two equal parts. One part was mixed with 40 μl of reaction buffer containing 50 mM Tris–HCl, 5 mM EDTA, pH 8.3, which was used as control. The other part (test sample) was mixed with 40 μl of 25 mg/ml EZ-Link iodoacetyl-PEG2-Biotin (Pierce Biotechnology, Rockford, IL, USA). The both were incubated at 37 °C for 5 h. After removing the excess EZ-Link iodoacetyl-PEG2-Biotin by dialysis, streptavidin agarose beads (Invitrogen, Dynal AS, Oslo, Norway) was added either into the control or test samples, respectively, followed by incubation at 4 °C for 12 h. The beads were collected via centrifugation, washed for 5 times, and re-suspended by 1 × SDS sample buffer, which were boiled for 10 min. The eluted proteins were subjected to SDS–PAGE and Western blotting analysis.
2.6. Western blotting
For determining protein levels of Trx/TrxR, the liver extract (120 μg of total protein per lane) was separated on a 12% SDS–PAGE. For detecting 4-HNE-protein adducts, the liver extract (60 μg of total protein per lane) was separated on a 10% SDS–PAGE gel. The resolved proteins were then electroblotted onto polyvinyldifluoride membranes (Novex, America). The target proteins were detected by using monoclonal antibody of TrxR1 (1:1000 dilution), Trx1 (1:1000 dilution), GADPH (1:10,000 dilution) or polyclonal antibody of 4-HNE (1:5000 dilution) (Calbiochem, USA), respectively. The bound antibodies were detected by horseradish peroxidase-labeled secondary antibody (1:1000 dilution). Protein bands were visualized using an enhanced chemiluminescence detection system (ECL) according to the instruction given by the manufacturer. The experiments were performed in triplicate.
2.7. Two-dimensional gel electrophoresis (2-DE) of liver extracts
2-DE analysis was made on three mice in each group. Isoelectric focusing (IEF) was conducted on pH 3–10 or pH 5–8 17-cm immobilized pH gradient (IPG) strips, respectively, in Multiphor II electrophoresis apparatus (Amersham, America). First, precast IPG strips (Bio-Rad, America) were removed from refrigerator and rehydrated with swelling buffer (8 M urea, 2 M thiourea, 0.5% CHAPS, 0.52% ampholyte, 0.02% bromophenol blue, 1% DTT) for 12 h. The total protein (1 mg) was loaded on each analytical gel. The electric focusing was carried out at 20 °C in five steps: (1) 0–500 V gradient for 500 Volt h (Vh); (2) a constant potential of 500 V for 2500 Vh; (3) 500–3500 V gradient for 10,000 Vh; (4) a constant potential of 3500 V for 50,000 Vh and (5) 3500–500 V gradient for 8000 Vh. Afterwards, the strips were equilibrated in buffer I (50 mM Tris–HCl, pH 6.8, 6 M urea, 30% glycerol, 2% SDS, 2% DTT and 0.02% bromophenol blue) for 15 min, followed by treatment with equilibration buffer II (50 mM Tris–HCl, pH 6.8, 6 M urea, 30% glycerol, 2% SDS, 2.5% IAA and 0.02% bromophenol blue) for 15 min. The IPG strips were then electrophoresed on 12% SDS–polyacrylamide gel at 250 V for about 5 h in a Protean II XL system (Bio-Rad, America) using Tris–glycine buffer.
2.8. Gel staining, image acquisition and mass spectrometry analysis
The 2-DE gels were stained with Coomassie Brilliant Blue (10% ammonium sulfate, 10% phosphoric acid, 0.12% G250 and 20% methanol). The stained gels were then scanned at 300 dpi with a PowerLook 2100XL scanner system (UMAX, America) to obtain images, which were then analyzed using PDQuest7.3.0 software (Bio-Rad). All protein spots with statistically significant difference (≧1.4-fold) in intensity between control and HFD groups were excised.
The excised spots were cut into 1 mm3 pieces, which were washed three times with water, then destained in 50% (v/v) acetonitrile (ACN) (Fisher, America)/100 μl of 25 mM pH 8.0 ammonium bicarbonate (Fluka, America) for 15 min, repeating 3 times. The gel pieces were dehydrated in 30 μl of 100% ACN for 5 min, and then digested with 8 μl of 0.1 mg/ml trypsin in 25 mM NH4HCO3 (Promega, America) at 37 °C overnight. An aliquot of the digestion solution was mixed with an aliquot of a-cyano-4-hydroxycinnamic acid (Fluka, America). This mixture was deposited onto an Anchor Chip MALDI probe, allowed to dry at room temperature, and was identified by LC–MS–MS using 4700 Proteomics Analyzer (ABI) with 4000 Series software. The instrument was operated with a laser intensity 3200, which can detect molecular mass spectra 700–4000 Da. Protein identification was performed by searching against NCB-Inr, SWISS-PROT and IPI database using GPS Explorer™ v3.5 software. The search parameters were as follows: precursor fragment mass tolerance of ±0.1 Da; the number of missed cleavage allowed was 1; carbamidomethylation of Cys residues as fixed modifications; oxidized amino acids as variable modifications.
2.9. Enzyme-linked immunosorbent assay (ELISA)
To determine expression levels of serum leptin, liver leptin receptor, PTP-1B and PPARα/γ, ELISA was performed using the protein-specific monoclonal antibody. Proteins in the samples were diluted to reach the concentration within the range of standard curve. Other procedures followed instructions for ELISA kit (ADL, America).
2.10. Statistical analysis
T-test was used to compare the mean values between two groups. Statistical analyses were performed using Excel. A P-value less than 0.05 was considered statistically significant.
3. Results and discussion
3.1. Characteristics of HFD-induced insulin resistance
To build the mouse model of insulin resistance, mice were divided into HFD and control groups, receiving a HFD or a standard diet, respectively. After 13 weeks of HFD feeding, glucose tolerance was significantly impaired. At 15, 60 or 120 min after glucose load, blood glucose levels in HFD group were 44%, 83%, or 90% higher than those in control group, respectively (Fig. 1A); AUC value in HFD group was about 1.6-fold higher than that in control group (Fig. 1B). Meanwhile, the sensitivity to insulin was decreased as well after consuming HFD. At 30 min after insulin administration, blood glucose levels were decreased by 45% in control group and by 8% in HFD group, as compared to those before insulin injections (Fig. 1C); AUC value in HFD group was about 1.5-fold higher than that in control group (Fig. 1D). In addition, glucose-infusion rate (GIR) was decreased by 7.8-fold in HFD group (Fig. 1E), and the hepatic insulin-dependent glucose uptake was decreased by 1.8-fold in HFD group (Fig. 1F), as compared with those in control group. These results confirm the occurrence of HFD-induced hepatic and systemic insulin resistance.
Fig. 1.
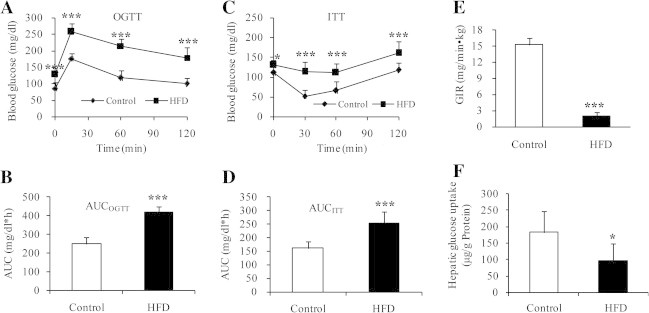
Insulin resistance occurred in the mice fed on HFD for 13 weeks. (A and B) OGTT in HFD and control groups. The mice in HFD group operated at lower ability to metabolize glucose (Fig. 1A, upper curve) compared with control group (Fig. 1A, lower curve) (n = 8). (C and D) ITT in HFD and control groups. (C) The mice in HFD group were less sensitive to insulin (Fig. 1C, upper curve) than controls (Fig. 1C, lower curve) (n = 8). (E) Whole body glucose utilization (clamp glucose infusion rate, GIR) and (F) hepatic insulin-dependent glucose uptake, analyzed by hyperinsulinemic euglycemic-clamp (n = 6). Values are mean ± SD. ∗P < 0.05; ∗∗P < 0.01; ∗∗∗P < 0.001.
3.2. Effect of HFD on liver Trx/TrxR activity and expression
Using this mouse model, we examined the changes in liver Trx/TrxR. The activity of total Trx or TrxR in HFD group was reduced by 70% or 56%, respectively, relative to control group (Fig. 2A, n = 8). To test if the expression levels of Trx/TrxR also go down, three samples from each group were chosen at random for Western blot analysis. As shown in upper panel of Fig. 2B, the protein levels of cytosolic Trx and TrxR (referred to as Trx1/TrxR1) were generally lower in HFD group than those in control group. The decrease in the average amount of Trx1 or TrxR1 protein in HFD group was about 70% or 38% relative to control group (n = 3) (lower panel of Fig. 2B). Consistent with these changes, HFD group showed significantly lower mRNA level of Trx1 (51% reduction) or TrxR1 (37% reduction) as compared with control (Fig. 2C, n = 6). These results suggest that reduction of hepatic Trx/TrxR is a previously unrecognized aspect of insulin resistance. HFD-induced decrease in Trx1/TrxR1 expression seems to be a major contributor to reduction of total Trx/TrxR activity. However, activity reduction of TrxR was more profound than protein reduction, suggesting that dysfunction of TrxR by posttranslational modification(s) cannot be excluded.
Fig. 2.
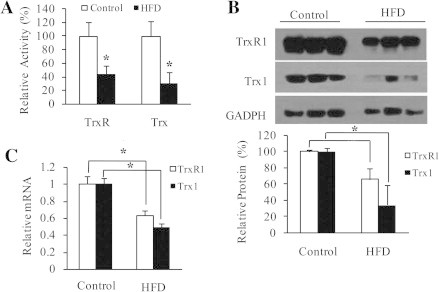
HFD-induced decrease in liver Trx/TrxR. (A) Specific activity of total TrxR and Trx, determined by super-insulin assay (n = 8). (B) Upper panel: protein levels of TrxR1 and Trx1, detected by Western blotting with anti-TrxR1 or anti-Trx1 monoclonal antibody. GADPH as an internal reference (n = 3). Lower panel: density quantification of TrxR1 and Trx1 immunoblots. (C) mRNA levels of TrxR1 and Trx1, determined by quantitative RT-PCR (n = 6). All values are means ± SD. ∗P < 0.05.
3.3. Effect of HFD on liver Trx1/TrxR1 S-acylation
One of TrxR1 variants has been reported to be modified by fatty acid at its N-terminal MGC motif [18]. Protein S-acylation is a common post-translational modification of proteins [19]. To address a potential relationship between lipid accumulation and Trx1/TrxR1 S-acylation, we further analyzed this mouse model. In HFD group, liver TG content was 1.9-fold higher relative to control (Fig. 3A). We next examined Trx1/TrxR1 S-acylation using a modified Acyl-Biotin Exchange assay, the method is commonly used to quantitatively assess protein palmitoylation [17]. Free thiol groups in the liver extracts were first blocked by IAM, and then treated with NH2OH to selectively cleave thioester bonds and generate nascent thiols. The latter were labeled by thiol-reactive biotinylation reagent (EZ-Link iodoacety1-PEG2-Biotin). The biotin labeled proteins were then captured via streptavidin agarose, from which the bound proteins were eluted, and subjected to Western blot analysis using monoclonal anti-Trx1 or anti-TrxR1 primary antibody. This result revealed that the biotin-labeled-proteins included Trx1 and TrxR1. To further control for possible false-positive identification, the eluates from streptavidin agarose incubated with the liver extracts that had not been treated with EZ-Link iodoacety1-PEG2-Biotin were analyzed in parallel by Western blotting in each experiment. Trx1 and TrxR1 were not detected in the absence of EZ-Link iodoacety1-PEG2-Biotin. These findings are consistent with the presence of S-acylation not only in TrxR1 but also in Trx1. The extent of Trx1/TrxR1 S-acylation appeared to be enhanced in HFD group (upper panel of Fig. 3B). The average extent of Trx1 S-acylation or TrxR1 S-acylation was about 1.5-fold or 1.7-fold higher in HFD group than in control group, respectively (lower panel of Fig. 3B). This suggests that S-acylation may mediate the negative effect of HFD on Trx1/TrxR1. The detailed mechanism for Trx1/TrxR1 inhibition by S/Se-acylation is under investigation. As all isoforms of mammalian Trx/TrxR contain the conserved active-site Cys/Sec residues, S/Se-acylation of mitochondrial Trx/TrxR is also possible. Given that modification of Trx-Cys residue(s) may stimulate ASK1-mediated apoptosis [20], the enhanced S-acylation of Trx1 is most likely another potential mechanism behind lipid accumulation-induced apoptosis in liver cells [21].
Fig. 3.
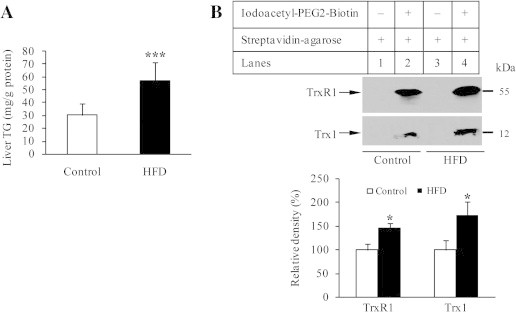
TG content and Trx/TrxR S-acylation. (A) TG levels in mice livers (n = 6). (B) Upper panel: S-acylated TrxR1/hTrx1 were separated from liver extracts of either control or HFD group using Acyl-Biotin Exchange assay protocol, followed by Western blotting with anti-TrxR1/hTrx1 monoclonal antibodies. Methods are detailed under Materials and Methods. Lanes 1 and 3, no acylated TrxR1/hTrx1 bound to streptavidin-agarose. Lanes 2 and 4, S-acylated TrxR1/hTrx1 detected in streptavidin-enriched biotin-labeled proteins. Lower panel: density quantification of TrxR1/hTrx1 immunoblots. Data represent mean ± SD from three mice per group. ∗P < 0.05, and ∗∗∗P < 0.001.
3.4. HFD-induced decrease in liver Trx/TrxR as a marker of abnormal lipid metabolism
A variety of proteins have been described to participate in lipid metabolism. For instance, activation of peroxisome proliferator-activated receptor (PPAR)γ can increase uptake of fatty acid in brown fat, but decrease uptake and utilization of fatty acid in liver [22]; PPARα activation favors fatty acid oxidation in liver [23]; leptin negatively regulates PPARγ gene expression [24]; inhibition of protein tyrosine phosphatase-1B (PTP-1B) reduces TG accumulation in addition to improving insulin sensitivity [25]. Using ELISA, we observed that HFD group had a significant decrease in hepatic PPARγ (Fig. 4A) and a decreased trend of hepatic PPARα (Fig. 4B), while showed a significant increase in PTP-1B (Fig. 4C), serum leptin (Fig. 4D) and a rising trend of hepatic leptin receptor (Fig. 4E). It is likely that TG accumulation, due to HFD-induced dysfunction of lipid metabolism including down-regulated PPARγ/α in parallel with up-regulated PTP-1B and leptin/leptin receptor, leads to increased level of saturated fatty acid (FA) that in turn promotes modification of Trx/TrxR by S-acylation, as observed in HFD group (Figs. 3 and 7).
Fig. 4.
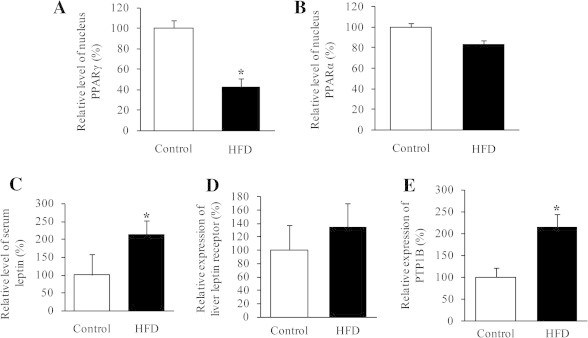
Altered proteins detected by ELISA. (A) PPARγ and (B) PPARα levels in the nuclear protein extracts from frozen mice livers. (C) Serum leptin levels. (D) Leptin receptor level and (E) PTP-1B level in the liver protein extracts. Data represent mean ± SD from eight mice per group. All experiments were done in triplicate. ∗P < 0.05.
Fig. 7.
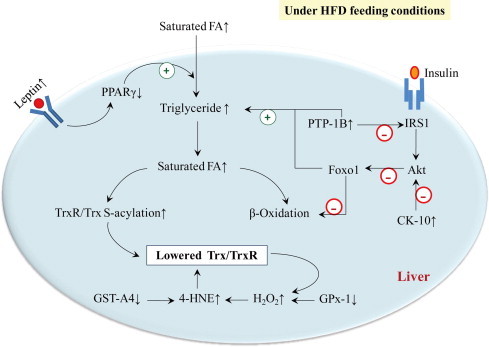
Molecular mechanism of HFD-induced decrease in liver Trx/TrxR. HFD results in decrease of liver Trx/TrxR, owing to increased degree of Trx/TrxR S-acylation and increased accumulation of 4-HNE. The use of proteomic analysis and ELISA has allowed the validation of involved proteins in lipid metabolism and insulin signaling, which mediate the effect of HFD on Trx/TrxR.
3.5. HFD-induced decrease in liver Trx/TrxR as an indicator of abnormal insulin signaling
In the liver, insulin actions include activation of insulin receptor substrate (IRS)-1-dependent phosphoinositide 3-kinase (PI 3-kinase), protein kinase B/Akt [26] and forkhead box O1 (Foxo1), in which a major role of hepatic Akt is to restrain the activity of Foxo1 [27]. Decrease in Trx/TrxR is associated with insulin resistance, suggesting potential role of insulin signaling in mediating this process. To examine the possible involvement of Akt and related proteins, we examined HFD-induced liver proteomic changes. Protein extracts either from HFD group or from control group were separated by 2-DE, respectively. Protein spots were visualized by staining with Coomassie Brilliant Blue. Using wide-range (pI 3–10) 2-DE gels for the protein separation, two proteins were found to be significantly elevated in HFD group than those in control, but proteins were not well separated (lower pane of Fig. 5). High resolution for the protein separation was attained in pH range 5–8 (upper panel of Fig. 5). The protein spots distributed between pH 5–8 were approximately 1000. Thirty-four protein spots were differentially expressed by more than 1.4-fold in HFD group versus control group, which were excised from the 2-DE gels and identified by MALDI-TOF-MS analysis. Twenty-two spots were successfully identified. The identified proteins are grouped according to their functions and shown in Table 1.
Fig. 5.
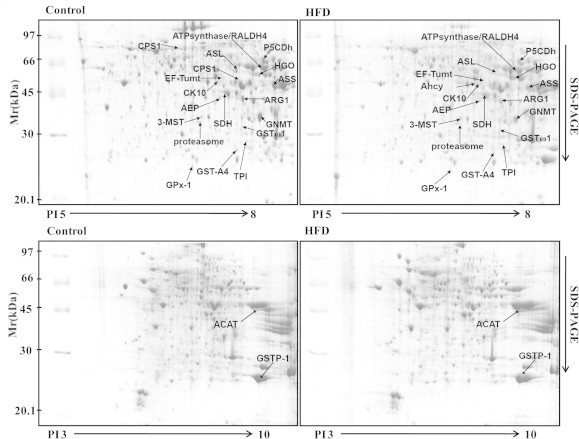
Representative examples of the liver proteins separated on 2-DE gels. The liver extracts either from control group or from HFD group (n = 3) were separated by 2-DE, respectively. The indicated protein spots have been identified by mass spectrometry. The images were analyzed using PDQuest7.3.0 software.
Table 1.
HFD-induced alterations in mouse liver proteins.
| Protein accession number | E.C. number | Protein identity | Associated function | HFD vs. Controla |
|
|---|---|---|---|---|---|
| Fold change | P-value | ||||
| gi|84871986 | EC1.11.1.9 | Glutathione peroxidase-1 | Anti-oxidation | −3.3b | <0.01 |
| sp|P19157 | EC2.5.1.18 | Glutathione S-transferase P 1 | +1.6 | <0.05 | |
| IPI00323911 | EC2.5.1.18 | Glutathione S-transferase A4 | −2.4 | <0.05 | |
| sp|O09131 | EC2.5.1.18 | Glutathione S-transferase ω 1 | −1.8 | <0.05 | |
| sp|P17751 | EC5.3.1.1 | Triosephosphate isomerase | Glucose metabolism | −1.4 | <0.05 |
| gi|22128627 | EC1.1.1.14 | Sorbitol dehydrogenase | −1.8 | <0.05 | |
| sp|Q8K157 | EC5.1.3.3 | Aldose 1-epimerase | +1.4 | <0.05 | |
| gi|21450129 | EC2.3.1.9 | Acetyl-CoA acetyltransferase 2 | Cholesterol synthesis | +2.8 | <0.05 |
| IPI:IPI00894663 | EC6.3.4.16 | Carbamoyl-phosphate synthetase 1 | Urea cycle | Present only in control | |
| gi|25453414 | EC6.3.4.5 | Argininosuccinate synthase | −2.7 | <0.05 | |
| sp|Q91YI0 | EC4.3.2.1 | Arginosuccinase | −3.2 | <0.01 | |
| sp|Q61176 | EC3.5.3.1 | Arginase-1 | −1.8 | <0.05 | |
| sp|Q29555 | EC2.1.1.20 | Glycine N-methyltransferase | Amino acid metabolism | −3.0 | <0.01 |
| IPI00230440 | EC3.3.1.1 | Adenosylhomocysteinase | Present only in HFD | ||
| sp|P97532 | EC2.8.1.2 | 3-Mercaptopyruvate sulfurtransferase | +1.6 | <0.05 | |
| sp|O09173 | EC1.13.11.5 | Homogentisate 1,2-dioxygenase | +1.7 | <0.05 | |
| sp|P0C2X9 | EC1.5.1.12 | Delta-1-pyrroline-5-carboxylate dehydrogenase | −2.0 | <0.05 | |
| sp|Q8BH00 | EC1.2.1.− | Retinal dehydrogenase 4 | Vitamin A metabolism | −1.8 | <0.05 |
| IPI00857439 | –c | ATP synthase α-subunit | Mitochondria ATP production | −1.8 | <0.05 |
| sp|Q8BFR5 | – | Elongation factor Tu | Mitochondria translation | +1.4 | <0.05 |
| sp|O42265 | EC3.4.25.1 | Proteasome α-type subunit | Protein degradation | +1.6 | <0.05 |
| sp|P13645 | – | Cytokeratin-10 | Cytoskeleton | +1.4 | <0.05 |
Patterns of liver proteins from HFD and control groups were examined by comparative proteomic analysis.
“HFD vs. Control” means protein changes in HFD group compared with control.
“−” means a decrease of spot intensity and “+” means an increase of spot intensity.
Means without E.C. number.
Among them, expression of cytokeratin-10 (CK-10), also known as keratin-10 (K10), was significantly up-regulated in liver from HFD group. CK-10 has been reported to inhibit Akt [28]. Thus, CK-10 and PTP-1B play synergistic effect on Akt. PTP-1B dephosphorylates insulin receptor [29] and insulin receptor substrate-1 (IRS-1) [30], which leads to decrease in PI 3-kinase-dependent activation of Akt [31,32]. The defect in Akt has been shown to correlate with the activation of Foxo1 [27], the latter causes increased TG accumulation and decreased fatty acid oxidation [33] (Fig. 7). Consequently, saturated fatty acids (FA) were higher in HFD group relative to control, and have considerable influence on Trx/TrxR by S-acylation.
3.6. 4-HNE-mediated effect of HFD on liver Trx/TrxR
In addition, certain end products of lipid peroxidation, such as 4-hydroxynonenal (4-HNE), can inhibit Trx/TrxR activity [34]. We showed that accumulation of 4-HNE adducts was driven by HFD (Fig. 6A). To investigate the effect of 4-HNE on Trx/TrxR expression, we treated hepatic cells with 50 μM 4-HNE. This treatment led to a significant decrease in Trx1 protein and a clear decreasing trend of TrxR1 protein (Fig. 6B). As revealed by proteomic analysis, the mice fed on HFD had a significant decrease in glutathione S-transferase (GST)-A4 and glutathione peroxidase 1 (GPx-1) (Table 1). GST-A4 is central to 4-HNE detoxification and metabolism [35]. GPx-1 enzymatically reduces hydrogen peroxide to water to limit its harmful effects because hydrogen peroxide may induce lipid peroxidation of cell membranes, generating 4-HNE [36]. Accordingly, the negative effect of HFD on Trx/TrxR through 4-HNE is best rationalized in terms of forming 4-HNE-Trx/TrxR adducts or suppressing Trx/TrxR synthesis. Meanwhile, decrease in Trx/TrxR sets up a vicious cycle that augments oxidative stress (Fig. 7).
Fig. 6.
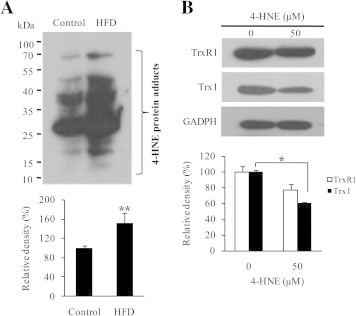
4-HNE-mediated effect of HFD on Trx/TrxR. (A) Upper panel: a representative of 4-HNE levels in liver extracts from control and HFD groups examined by Western blot. Lower panel: average levels of 4-HNE detected by Western blot assays, representing mean ± SD from three mice per group. (B) Upper panel: a representative of TrxR1 and Trx1 expression in the presence or absence of 50 μM 4-HNE. Lower panel: average levels of TrxR1/Trx1 detected by Western blot assays. Values are means ± SD (n = 3). ∗P < 0.05; ∗∗P < 0.01.
In summary, the identification of HFD-induced impairment in liver Trx/TrxR provides a novel framework to understand the molecular mechanism behind liver oxidative stress under insulin-resistant conditions. As Trx and TrxR have a broad range of substrates [37], sorting out the major roles of Trx/TrxR in the pathogenesis of liver insulin resistance is crucial for designing new strategies to cope with insulin resistance and relevant diseases.
Acknowledgements
We are grateful to Tianjin Biochip Corporation, China for technique support of 2-DE and mass spectrometry. This work was supported by grants from Ministry of Science and Technology of the Peoplés Republic of China (2009ZX09103-432, 2012ZX09103-101-063) and from National Natural Science Foundation of China (Grants No. 31170764, 31470790).
Contributor Information
Fei Ye, Email: yefei@imm.ac.cn.
Liangwei Zhong, Email: liazho@ucas.ac.cn.
References
- 1.Vial G. Effects of a high-fat diet on energy metabolism and ROS production in rat liver. J. Hepatol. 2011;54:348–356. doi: 10.1016/j.jhep.2010.06.044. [DOI] [PubMed] [Google Scholar]
- 2.Matsuzawa-Nagata N. Increased oxidative stress precedes the onset of high-fat diet-induced insulin resistance and obesity. Metabolism. 2008;57:1071–1077. doi: 10.1016/j.metabol.2008.03.010. [DOI] [PubMed] [Google Scholar]
- 3.Zhong L., Holmgren A. Essential role of selenium in the catalytic activities of mammalian thioredoxin reductase revealed by characterization of recombinant enzymes with selenocysteine mutations. J. Biol. Chem. 2000;275:18121–18128. doi: 10.1074/jbc.M000690200. [DOI] [PubMed] [Google Scholar]
- 4.Bjornstedt M., Xue J., Huang W., Akesson B., Holmgren A. The thioredoxin and glutaredoxin systems are efficient electron donors to human plasma glutathione peroxidase. J. Biol. Chem. 1994;269:29382–29384. [PubMed] [Google Scholar]
- 5.Cha M.K., Kim I.H. Thioredoxin-linked peroxidase from human red blood cell: evidence for the existence of thioredoxin and thioredoxin reductase in human red blood cell. Biochem. Biophys. Res. Commun. 1995;217:900–907. doi: 10.1006/bbrc.1995.2856. [DOI] [PubMed] [Google Scholar]
- 6.Saitoh M. Mammalian thioredoxin is a direct inhibitor of apoptosis signal-regulating kinase (ASK) 1. EMBO J. 1998;17:2596–2606. doi: 10.1093/emboj/17.9.2596. [DOI] [PMC free article] [PubMed] [Google Scholar]
- 7.Holmgren A. Thioredoxin catalyzes the reduction of insulin disulfides by dithiothreitol and dihydrolipoamide. J. Biol. Chem. 1979;254:9627–9632. [PubMed] [Google Scholar]
- 8.Sengupta R., Holmgren A. The role of thioredoxin in the regulation of cellular processes by S-nitrosylation. Biochim. Biophys. Acta. 2012;1820:689–700. doi: 10.1016/j.bbagen.2011.08.012. [DOI] [PubMed] [Google Scholar]
- 9.Chen Y.Y., Chu H.M., Pan K.T., Teng C.H., Wang D.L., Wang A.H., Khoo K.H., Meng T.C. Cysteine S-nitrosylation protects protein-tyrosine phosphatase 1B against oxidation-induced permanent inactivation. J. Biol. Chem. 2008;283:35265–35272. doi: 10.1074/jbc.M805287200. [DOI] [PMC free article] [PubMed] [Google Scholar]
- 10.Ovadia H., Haim Y., Nov O., Almog O., Kovsan J., Bashan N., Benhar M., Rudich A. Increased adipocyte S-nitrosylation targets anti-lipolytic action of insulin: relevance to adipose tissue dysfunction in obesity. J. Biol. Chem. 2011;286:30433–30443. doi: 10.1074/jbc.M111.235945. [DOI] [PMC free article] [PubMed] [Google Scholar]
- 11.Mueller A.S. Redox regulation of protein tyrosine phosphatase 1B by manipulation of dietary selenium affects the triglyceride concentration in rat liver. J. Nutr. 2008;138:2328–2336. doi: 10.3945/jn.108.089482. [DOI] [PubMed] [Google Scholar]
- 12.Kakisaka Y., Nakashima T., Sumida Y., Yoh T., Nakamura H., Yodoi J., Senmaru H. Elevation of serum thioredoxin levels in patients with type 2 diabetes. Horm. Metab. Res. 2002;34:160–164. doi: 10.1055/s-2002-23201. [DOI] [PubMed] [Google Scholar]
- 13.Henriksen E.J., Diamond-Stanic M.K., Marchionne E.M. Oxidative stress and the etiology of insulin resistance and type 2 diabetes. Free Radic. Biol. Med. 2011;51:993–999. doi: 10.1016/j.freeradbiomed.2010.12.005. [DOI] [PMC free article] [PubMed] [Google Scholar]
- 14.Videla L.A. Oxidative stress signaling underlying liver disease and hepatoprotective mechanisms. World J. Hepatol. 2009;1:72–78. doi: 10.4254/wjh.v1.i1.72. [DOI] [PMC free article] [PubMed] [Google Scholar]
- 15.Bugianesi E., Moscatiello S., Ciaravella M.F., Marchesini G. Insulin resistance in nonalcoholic fatty liver disease. Curr. Pharm. Des. 2010;16:1941–1951. doi: 10.2174/138161210791208875. [DOI] [PubMed] [Google Scholar]
- 16.Wu Y., Yang L., Zhong L. Decreased serum levels of thioredoxin in patients with coronary artery disease plus hyperhomocysteinemia is strongly associated with the disease severity. Atherosclerosis. 2010;212:351–355. doi: 10.1016/j.atherosclerosis.2010.06.002. [DOI] [PubMed] [Google Scholar]
- 17.Drisdel R.C., Green W.N. Labeling and quantifying sites of protein palmitoylation. Biotechniques. 2004;36:276–285. doi: 10.2144/04362RR02. [DOI] [PubMed] [Google Scholar]
- 18.Cebula M., Moolla N., Capovilla A., Arner E.S. The rare TXNRD1_v3 (“v3”) splice variant of human thioredoxin reductase 1 protein is targeted to membrane rafts by N-acylation and induces filopodia independently of its redox active site integrity. J. Biol. Chem. 2013;288:10002–10011. doi: 10.1074/jbc.M112.445932. [DOI] [PMC free article] [PubMed] [Google Scholar]
- 19.Linder M.E., Deschenes R.J. Palmitoylation: policing protein stability and traffic. Nat. Rev. Mol. Cell Biol. 2007;8:74–84. doi: 10.1038/nrm2084. [DOI] [PubMed] [Google Scholar]
- 20.Shinkai Y., Iwamoto N., Miura T., Ishii T., Cho A.K., Kumagai Y. Redox cycling of 1,2-naphthoquinone by thioredoxin1 through Cys32 and Cys35 causes inhibition of its catalytic activity and activation of ASK1/p38 signaling. Chem. Res. Toxicol. 2012;25:1222–1230. doi: 10.1021/tx300069r. [DOI] [PubMed] [Google Scholar]
- 21.Wei Y., Wang D., Topczewski F., Pagliassotti M.J. Saturated fatty acids induce endoplasmic reticulum stress and apoptosis independently of ceramide in liver cells. Am. J. Physiol. Endocrinol. Metab. 2006;291:275–281. doi: 10.1152/ajpendo.00644.2005. [DOI] [PubMed] [Google Scholar]
- 22.Nemanich S., Rani S., Shoghi K. In vivo multi-tissue efficacy of peroxisome proliferator-activated receptor-gamma therapy on glucose and fatty acid metabolism in obese type 2 diabetic rats. Obesity (Silver Spring) 2013;21:2522–2529. doi: 10.1002/oby.20378. [DOI] [PMC free article] [PubMed] [Google Scholar]
- 23.Ferre P. The biology of peroxisome proliferator-activated receptors: relationship with lipid metabolism and insulin sensitivity. Diabetes. 2004;53(Suppl 1):43–50. doi: 10.2337/diabetes.53.2007.s43. [DOI] [PubMed] [Google Scholar]
- 24.Zhou Y., Jia X., Wang G., Wang X., Liu J. PI-3 K/AKT and ERK signaling pathways mediate leptin-induced inhibition of PPARgamma gene expression in primary rat hepatic stellate cells. Mol. Cell. Biochem. 2009;325:131–139. doi: 10.1007/s11010-009-0027-3. [DOI] [PubMed] [Google Scholar]
- 25.Swarbrick M.M. Inhibition of protein tyrosine phosphatase-1B with antisense oligonucleotides improves insulin sensitivity and increases adiponectin concentrations in monkeys. Endocrinology. 2009;150:1670–1679. doi: 10.1210/en.2008-0885. [DOI] [PMC free article] [PubMed] [Google Scholar]
- 26.Ortmeyer H.K. Insulin signaling and insulin sensitizing in muscle and liver of obese monkeys: peroxisome proliferator-activated receptor gamma agonist improves defective activation of atypical protein kinase C. Antioxid. Redox Signal. 2011;14:207–219. doi: 10.1089/ars.2010.3234. [DOI] [PMC free article] [PubMed] [Google Scholar]
- 27.Lu M. Insulin regulates liver metabolism in vivo in the absence of hepatic Akt and Foxo1. Nat. Med. 2012;18:388–395. doi: 10.1038/nm.2686. [DOI] [PMC free article] [PubMed] [Google Scholar]
- 28.Paramio J.M., Segrelles C., Ruiz S., Jorcano J.L. Inhibition of protein kinase B (PKB) and PKCzeta mediates keratin K10-induced cell cycle arrest. Mol. Cell. Biol. 2001;21:7449–7459. doi: 10.1128/MCB.21.21.7449-7459.2001. [DOI] [PMC free article] [PubMed] [Google Scholar]
- 29.Dube N., Tremblay M.L. Involvement of the small protein tyrosine phosphatases TC-PTP and PTP1B in signal transduction and diseases: from diabetes, obesity to cell cycle, and cancer. Biochim. Biophys. Acta. 2005;1754:108–117. doi: 10.1016/j.bbapap.2005.07.030. [DOI] [PubMed] [Google Scholar]
- 30.Calera M.R., Vallega G., Pilch P.F. Dynamics of protein-tyrosine phosphatases in rat adipocytes. J. Biol. Chem. 2000;275:6308–6312. doi: 10.1074/jbc.275.9.6308. [DOI] [PubMed] [Google Scholar]
- 31.Kerouz N.J., Horsch D., Pons S., Kahn C.R. Differential regulation of insulin receptor substrates-1 and -2 (IRS-1 and IRS-2) and phosphatidylinositol 3-kinase isoforms in liver and muscle of the obese diabetic (ob/ob) mouse. J. Clin. Invest. 1997;100:3164–3172. doi: 10.1172/JCI119872. [DOI] [PMC free article] [PubMed] [Google Scholar]
- 32.Matsumoto M., Ogawa W., Teshigawara K., Inoue H., Miyake K., Sakaue H., Kasuga M. Role of the insulin receptor substrate 1 and phosphatidylinositol 3-kinase signaling pathway in insulin-induced expression of sterol regulatory element binding protein 1c and glucokinase genes in rat hepatocytes. Diabetes. 2002;51:1672–1680. doi: 10.2337/diabetes.51.6.1672. [DOI] [PubMed] [Google Scholar]
- 33.Matsumoto M., Han S., Kitamura T., Accili D. Dual role of transcription factor FoxO1 in controlling hepatic insulin sensitivity and lipid metabolism. J. Clin. Invest. 2006;116:2464–2472. doi: 10.1172/JCI27047. [DOI] [PMC free article] [PubMed] [Google Scholar]
- 34.Fang J., Holmgren A. Inhibition of thioredoxin and thioredoxin reductase by 4-hydroxy-2-nonenal in vitro and in vivo. J. Am. Chem. Soc. 2006;128:1879–1885. doi: 10.1021/ja057358l. [DOI] [PubMed] [Google Scholar]
- 35.Bruns C.M., Hubatsch I., Ridderstrom M., Mannervik B., Tainer J.A. Human glutathione transferase A4-4 crystal structures and mutagenesis reveal the basis of high catalytic efficiency with toxic lipid peroxidation products. J. Mol. Biol. 1999;288:427–439. doi: 10.1006/jmbi.1999.2697. [DOI] [PubMed] [Google Scholar]
- 36.Sheridan A.M., Fitzpatrick S., Wang C., Wheeler D.C., Lieberthal W. Lipid peroxidation contributes to hydrogen peroxide induced cytotoxicity in renal epithelial cells. Kidney Int. 1996;49:88–93. doi: 10.1038/ki.1996.12. [DOI] [PubMed] [Google Scholar]
- 37.Arner E.S., Holmgren A. Physiological functions of thioredoxin and thioredoxin reductase. Eur. J. Biochem. 2000;267:6102–6109. doi: 10.1046/j.1432-1327.2000.01701.x. [DOI] [PubMed] [Google Scholar]