

Abstract
We provide a review of proteomic techniques used to characterize the bronchoalveolar lavage fluid (BALF) proteome of normal healthy subjects. Bronchoalveolar lavage (BAL) is the most common technique for sampling the components of the alveolar space. The proteomic techniques used to study normal BALF include protein separation by 2D gel electrophoresis whereby proteins were identified by comparison to a reference gel as well as high pressure liquid chromatography (HPLC)-tandem mass spectrometry technique, also known as shotgun proteomics. We summarize recent progress using shotgun MS technologies to define the normal BALF proteome. Surprisingly, we find that despite advances in shotgun proteomic technologies over the course of the last ten years, which have resulted in greater numbers of proteins being identified, the functional landscape of normal BALF proteome was similarly described by all methods examined.
Keywords: Bronchoalveolar lavage fluid, Epithelial lining fluid, Mass spectrometry, Proteomics
1 Introduction
The lung is the body’s first line of immune defense against inhaled foreign antigens. The lung is a highly complex organ comprised of many cells types including epithelial cells, immune cells, fibroblasts, and endothelial cells—and as a consequence, its proteome is comprised of a multifaceted group of proteins in constant flux as a result of the dynamic contact with environmental compounds [1]. Bronchoalveolar lavage (BAL) proteins are derived from a variety of sources including resident cells or from diffusion both passively and actively through the alveolar-capillary barrier [2]. A better understanding of the normal constituents of the lung proteome is vital in assessing alterations that occur when respiratory diseases disrupt normal lung physiology.
The airways and alveoli are covered with a thin layer of epithelial lining fluid (ELF) composed of soluble components of the lung that are responsible for structural integrity of airspaces, maintaining gas-exchange, and providing immune protection. The protein composition of ELF is affected by external factors and/or diseases affecting the lung; this proteome has been demonstrated to be important in early diagnosis and has provided insight into pathogenesis for a range of lung diseases including idiopathic pulmonary fibrosis, cystic fibrosis, chronic obstructive pulmonary disease and acute respiratory distress syndrome [3]. Various external factors (i.e., inhaled particles, airborne pollutants, pathogens, and infectious agents) and lung diseases induce detectable biochemical modifications in ELF [4]. Techniques used to sample ELF include bronchoalveolar lavage (BAL) [4], nasal lavage [5], breath condensates collection [6], and the induction of sputum with hypertonic saline [7]. While the last three techniques are non-invasive, the fluids acquired represent a limited subset of the lung proteome likely to contain proteins from sources other than the airspaces. Currently, the most comprehensive sampling of lung proteins can be gained by examination of BAL fluid (BALF) which is acquired by fiberoptic bronchoscopy and represents ELF from the airspaces and small airways.
Proteomic analysis of BALF, therefore, represents a practical approach to understanding the expressed lung proteome [8–11]. Proteomic analysis of BALF has been studied with the intent to identify biomarkers of disease and discern biochemical mechanisms responsible for a range of lung diseases, including idiopathic pulmonary fibrosis [12], cystic fibrosis [13], sarcoidosis [3], chronic obstructive pulmonary disease (COPD) [14, 15], and acute respiratory distress syndrome (ARDS) [16–18]. There are a number of studies that have applied proteomic analysis to lung disease. Here we focus our review on existing literature describing the proteomic methodologies, specifically the shotgun MS approach, and their reported results in defining the normal lung BALF proteome from non-smokers.
2 Bronchoalveolar Lavage Fluid
Collection
The European Respiratory Society has drafted guidelines on the methods for performing BAL in an effort to standardize the procedure and produce results that are reproducible for comparative analysis [10, 19]. In order to obtain BALF, selected lobes of the lung are washed five times with 20 ml of sterile saline (0.9% w/v) during fiberoptic bronchoscopy [20]. The fluid is then centrifuged to remove cellular debris resulting in a cell-free supernatant that is referred to as BALF.
Composition
BALF is a complex mixture of soluble components such as phospholipids, neutral lipids, nucleic acids, peptides, and proteins derived from resident cells or diffusion (passive and/or active) through the alveolar-capillary barrier [2]. The most abundant proteins detected in BALF are plasma proteins (e.g., albumin, transferrin, alpha 1-antitrypsin, immunoglobulin A and G) that may originate from diffusion (passive and/or active) across the blood-air barrier [21]. Human serum albumin has been reported to account for as much as 90% of total proteins in BALF [22]. Most interstitial lung diseases are characterized by enrichment of plasma proteins in BALF as a consequence of increased barrier permeability due to chronic injury and inflammation [18, 23].
Surfactant-associated proteins (SP-A, SP-B, SP-D) [24, 25]; Clara cell protein (CC-16, CC-10) [26–28]; and mucin-associated antigens are mainly, if not exclusively, secreted by airway and alveolar epithelial cells [29]. They are also present in trace amounts in serum, most likely by diffusion (passive and/or active) across the air-blood barrier. Abnormal detection of these proteins in serum can implicate changes in epithelial cell function and be used to assess the integrity of the alveolar-capillary barrier.
3 Mass spectrometry-based proteomics overview
The dynamic range of protein abundance in BALF is estimated to be on the order of 1010 [1], yet the resolving power of mass spectrometry (MS)-based proteomic platforms is limited to 102–104 [30]. As a result of this 6-order of magnitude discrepancy, it has been very difficult to profile all proteins present in BALF. Currently, two main techniques are used to define proteomes using mass spectrometry (Figure 1). The first is a 2-step process involving two-dimensional gel electrophoresis (2DE) to separate proteins followed by tandem MS to identify peptides produced by proteolysis of proteins. The 2DE approach first separates proteins in a polyacrylamide gel by isoelectric focusing in a pH gradient where proteins migrate in the gel to their isoelectric point (pI) [31].). The second dimension of separation in a polyacrylamide gel is based on molecular weight. The combined separations result in an ability to separate approximately 1000 protein forms. The separated proteins are visualized by various staining methods, such as Coomassie Brilliant Blue or silver stain. Proteins visualized as stained “spots” are identified by excision of the gel piece containing the protein, which is followed by enzymatic digestion and mass spectrometric analysis (MS). Often this MS step is a combination of high performance liquid chromatography (HLPC) and tandem mass spectrometry (MS/MS).
Figure 1.
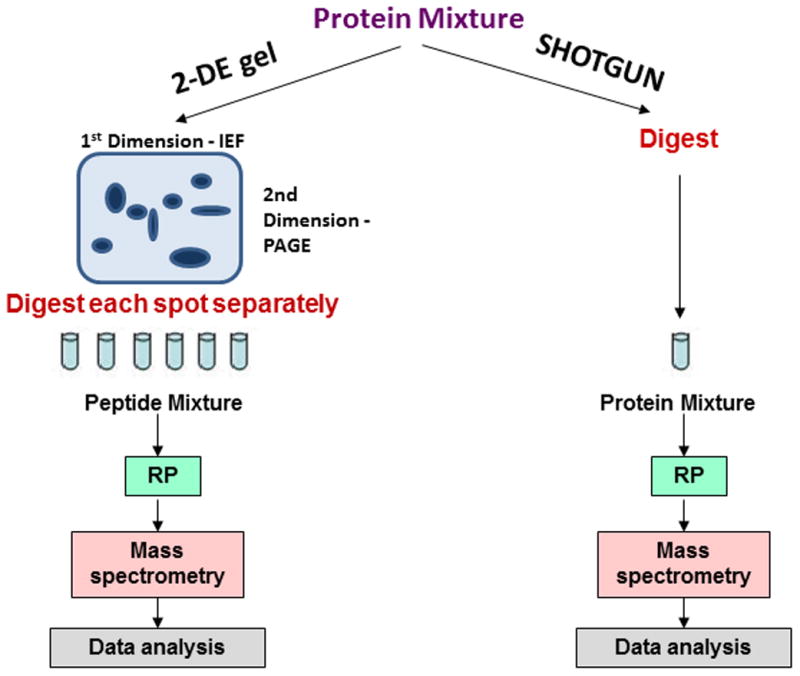
General workflow of MS-based proteomic approaches. Sample preparation and data analysis of 2-DE gel (left) and shotgun (right) proteomic MS approaches are represented. IEF: Isoelectric focusing; PAGE: Polyacrylamide gel electrophoresis; RP: Reverse Phase chromatography.
Although the 2DE gel method is capable of separating sequence isoforms and post-translational modifications of proteins, it has many drawbacks. These include its labor intensive nature, difficulty in reproducing the separations, the need for a label such as fluorescent tags followed by densitometry to quantify protein levels, and poor recovery of proteins from the gel for MS identification [32].
The second, and recently more popular, approach involves the enzymatic digestion of unfractionated BALF followed by separation and analysis using the same HPLC-MS/MS method that was also coupled to the 2DE method to identify proteins in individual “spots”. This second method, referred to as shotgun proteomics, has several advantages over the 2DE-MS coupled method including speed since the sample’s proteome is interrogated in a single run instead of hundreds of individual runs. Additional advantages include ease of automation and the ability to quantify proteins in a label free manner [33].
Regardless of whether one uses the 2DE-MS or shotgun proteomic approach, each approach typically utilizes HPLC-MS/MS for peptide sequence identification. This involves electrospray ionization to transfer peptides from the HPLC to the mass spectrometer and automated computer driven routines for control of MS operation, thereby allowing unattended selection of peptides for collision induced dissociation (CID). This automated selection of peptides for fragmentation is often referred to as a data-dependent acquisition (DDA) because ion selection for fragmentation by CID is based on precursor ion intensity in the precursor ion mass spectrum (or MS1 scan). After fragmentation, the resulting tandem mass spectra (or MS2 scans) are searched using a computer search engine against a theoretical sequence database. The process produces matches between peptide sequences in the database and the acquired tandem mass spectra that are ranked statistically using various scoring methods that vary between search engines such as MASCOT [34], Phenyx [35], and SEQUEST [36]. The end result is a list of the most likely protein candidates inferred to be present in the sample by detection of peptides. For the purpose of further discussion we will only consider details of the scoring system for the search engine SEQUEST because the majority of normal BALF proteins have been identified by this method.
Briefly, SEQUEST uses three scores to rank the identified peptides and proteins. These scores include: 1) cross-correlation value (Xcorr) based on how similar the acquired tandem mass spectrum is to a theoretical tandem mass spectrum produced from a database of sequence; 2) a Delta-correlation (ΔCn) that represents how far the top Xcorr is from the next highest Xcorr score matched to other theoretical tandem mass spectra; and 3) a preliminary score (Sp) based on the number of experimental ions that matched to identical values of the theoretical peptides for a protein. It is important to note that each tandem mass spectrum has a best fit sequence match out of hundreds of possible matches present in a sequence database. In an attempt to bring clarity to the process of identifying proteins from peptide tandem mass spectra, various statistical tools have been developed to aid interpretation. For use with SEQUEST two software programs, PeptideProphet [37] and ProteinProphet [38], were developed at the Institute for Systems Biology (Seattle, WA). Together they offer a mechanism to assign objectively a score to the best matching peptide sequence and importantly a statistical model to estimate the likelihood that a peptide is derived from a given parent protein where, as is often the case, a peptide may be matched to multiple parent proteins. These details may seem esoteric, but in fact play an important role in creation of the resulting list of proteins that are claimed to be “identified” in any given experiment.
While the end result of any proteomic experiment is often a library of proteins found in the sample, another level of information may be inferred. Specifically, the relatively unbiased and comprehensive nature of shotgun proteomics data sets allows for higher-level functional analysis of identified proteins. Thus, rather than solely identifying single proteins, it is common to provide information on the biochemical functions of identified proteins found to be statistically relevant by comparison to the entire human proteome in order to represent pathways populating the BALF proteome. One common tool for enrichment analysis is Database for Annotation, Visualization and Integrated Discovery (DAVID) [39], which functionally annotates the identified proteins based on the Gene Ontology (GO) database (http://www.geneontology.org) [40].
4 Normal BALF proteome
2DE-MS proteomic methods
Prior to the advent of mass spectrometry for protein identification and coining of the term proteomics, 2DE methods were used to characterize proteomes [41–45]. In fact a manuscript published in 1979 described the analysis of BALF samples from normal volunteers and patients with pulmonary alveolar proteinosis [46]. Serum samples were also collected and analyzed in parallel. BALF proteins that co-migrated (i.e. had the same pI and molecular weight) on the 2DE gel with known serum proteins on a separate gel were identified by inference using monospecific antibodies. This comparison of unknown BALF proteins to previously characterized serum proteins on a 2D-PAGE gel indicated that the majority of proteins in unfractionated BALF were in fact serum derived. While 37 proteins were visualized as dye-stained protein spots, only 19 proteins were confidently identified by inference to migration of standards on identical gels demonstrating the need for better protein identification methods.
The implementation of peptide mass fingerprinting (PMF) [41–45] in the early 1990’s as a means to identify proteins directly from polyacrylamide gels yielded a “high-throughput” strategy that resulted in an increase in the number of identified BALF proteins [47]. The PMF method of identifying proteins was often coupled to the 2DE separation of proteins. In this combined 2DE-PMF approach each stained protein spot, which is assumed to be pure for the purpose of PMF identification, is isolated, digested with a protease and analyzed using single stage mass spectrometry that became known simply as 2DE-MS. With PMF, proteins are identified by comparison of the measured peptide masses to a database of protein sequences theoretically digested with the same protease. Each set of detectable peptide masses represents a unique barcode for a given parent protein with confidence increasing as the number of peptide masses measured increases. The most recent reference gel representing BALF proteomics using this method comprised >900 stained protein spots. Of those 900, 78 of the spots were identified as specific proteins using the 2DE-MS with PMF technique [48]. Over 50% of the proteins identified in that study were serum-derived while the other 50% were proteins involved in anti-oxidation, tissue repair, immunological response, inflammation, lipid metabolism, and cytoskeletal functions. The fact that 50% of the identified proteins were classified as serum in origin represents a common conundrum in BALF proteomics. These serum-classified proteins may be present in BALF due to either active or passive transport across the alveoli or they could potentially be produced in the lungs. However, it’s also possible that having first been classified as serum in origin, they are thus considered serum proteins by name with no a priori method available to determine their actual origin. Regardless, these early studies demonstrate that the BALF proteome contains numerous different protein classes reflecting the diversity of their cellular origins and functions.
Shotgun proteomic methods
An increasingly popular method for proteome characterization is an approach known as shotgun proteomics. Shotgun proteomic analysis may be coupled to the 2DE separation of protein analysis (Figure 1). For example, Wu et al. in 2005 reported 1,500 distinct protein identifications utilizing shotgun proteomic analysis coupled to 2DE protein separation in the BALF of four asthmatic and three normal subjects. The false discovery rate (FDR) for protein identification was set to <4%, a 4-fold less stringent criteria compared to the typical FDR <1% [22]. Typically this 2DE separation step is bypassed and complex protein mixtures are first enzymatically digested into peptides, separated by high performance liquid chromatography, and ionized directly into a tandem mass spectrometer to identify proteins. The method has become popular because of the ease of use and a typical 2-fold increase in proteins identified compared to 2DE methods[49]. Another reason for its popularity over the 2DE-MS approach is that the shotgun method has a much wider detectable dynamic range than gel-based methods. This is in part true because it is difficult to detect proteins on a gel with molecular weights outside the 10–150kDa range, insoluble hydrophobic proteins, and/or proteins with high pI values [50]. The detection of low abundant proteins may also be hampered by close proximity on the gel to a higher abundant protein with similar size and charge.
Studies using shotgun proteomics
We next review five studies that used different shotgun proteomics approaches to define the normal BALF proteome. First, the work of Gharib et al. in 2009 used multidimensional protein identification technology (MudPIT) to separate peptides instead of the 2DE approach to protein separation[51]. The MudPIT method uses 2D-HPLC coupled directly to tandem mass spectrometry to identify proteins. In addition to the reversed phase separation of peptides standardly used in the basic shotgun proteomic method described above, peptides are first separated on a strong cation-exchange (SCX) support after which they are directly analyzed using a reversed-phase C18 column [52, 53] and then CID. In this study, BALF from four normal subjects was analyzed in parallel to BALF from eight cystic fibrosis (CF) patients on a Finnigan LCQ Deca ProteomeX ion trap mass spectrometer [51]. Peptide tandem mass spectra were searched against the Human IPI database (version 3.01). The criterion for protein identification was that peptide tandem mass spectra should have a peptide probability ≥ 0.9 and a protein probability ≥ 0.96, with at least three unique peptides in one sample. These probabilities are built into the tools contained in the trans proteomic pipeline (TPP) available from the Institute for Systems Biology [54, 55] that was mentioned earlier. From this MudPIT analysis 304 proteins were identified in the normal BALF proteome. The top three most abundant proteins according to spectral counting—a semi-quantitative method for determining relative abundances by counting peptide tandem mass spectra—were albumin, complement 3, and transferrin [51].
The next four reports of proteins detected in normal BALF were conducted using an abbreviated form of shotgun proteomics that avoided sample fractionation by SCX, using only C18-based reverse phase chromatography coupled to MS/MS analysis. In the first of these four reports, Plymoth et al. analyzed BALF from 18 normal subjects to 30 asymptomatic smokers in triplicate to address the impact of smoking on the normal proteome on a linear ion trap quadropole (LTQ) mass spectrometer (Thermoelectron, San Jose, CA) [56]. Tandem mass spectra were searched against the nonredundant National Center for Biotechnology Information protein database (TaxonomyID=9606, available at www.ncbi.nlm.nih.gov) with the criteria for matching a tandem mass spectrum to a peptide sequence being more than one unique tryptic peptide to identify a given protein using the Sequest algorithm incorporated in the BioWorks™ software (Ver3.1 from Thermoelectron). No minimum score criteria or threshold to judge the certainty of identification was used. Tandem mass spectra that matched to ranked peptide sequences in the database ranged from 1-585 (1 being the top rank peptide sequence related to probability of the match) and the sum of the unique ion scores ranged from 10.1–9440. Protein identifications ranged from 45–250 for individual BALF samples and 268 from pooling all 18 samples [56].
The protein profiles obtained with pooled samples (total protein concentration of 50μg) were then compared to BALF samples (2 μg) from individuals. Plymoth et al. reported that the profiles for the pooled samples produced more protein annotations than any individuals, mirrored the entire group of individuals, and that no evidence of skewed results due to the contribution of single individuals was observed.
Chen et al. in 2008 analyzed BALF from six normal subjects in quadruplicate on a linear ion trap (LTQ) hybrid Fourier transform-ion cylclotron resonance (ICR) mass spectrometer (i.e. LTQ-FT produced by ThermoFinnigan, CA) [49]. Tandem mass spectra were searched against the Human IPI database (version 2.31) with the criteria for matching a tandem mass spectrum to a peptide sequence being: Xcorr ≥ 1.9 for charge state 1+, Xcorr ≥ 2.2 for charge state 2+, and Xcorr ≥ 3.75 for charge state 3+ all having a ΔCn ≥ 0.1. Tandem mass spectra passing these criteria were considered matched to the top ranked peptide sequence in the database using SEQUEST. However, further criteria were implemented including a ProteinProphet probability score ≥ 0.8 and requiring more than one unique tryptic peptide to identify a given protein. Using these criteria over 100 proteins were identified in each individual, 167 unique proteins altogether, and 42 common proteins among all four participants [49].
The work of Chen et al. also examined three different semi-quantitative methods to assess relative intra- and inter-subject proteome variability. These included: 1) simple protein-sequence coverage, 2) peptide spectral counting which is based on statistical ranking of the number of times a given peptide is selected for CID and produces a spectrum of high enough quality for a database match, and 3) the classic area under the curve (AUC) method that used extracted peptide ion current traces referred to as peptide ion current areas (PICA). All these methods were used to evaluate both intra- and inter-subject variability in the rank order of proteins detected. For the 42 common proteins, they found that inter-sample variability ranged between 1- to 6-fold demonstrating a large degree of heterogeneity among different normal human subjects. This shotgun proteomic report identified over a two-fold increase in protein identifications compared to the previously discussed 2DE-MS [57, 58] approach and provided quantitative assessments of intra- and inter-subject variability.
While there was variation in specific proteins identified in each subject, with only 42 proteins being common to all, there was consistency in the highly enriched functional processes in all six subjects, as determined by DAVID. These functional classifications confirmed known lung functions including immune response, regulation of liquid surface tension, inflammatory response, and response to pathogen, but also identified carbohydrate binding/metabolism as being associated with normal lung function.
The third paper we review is from the same group as Chen et al., but added gas phase fractionation (GPF) [59] to the basic shotgun proteomic approach. This report analyzed pooled BALF from four normal human subjects and six mice on the same LTQ-FT mass spectrometer used in the prior report (i.e. LTQ-FT ThermoFinnigan, CA) [59]. By fractionating samples in the MS rather than in solution [60], GPF takes advantage of the fact that the mass spectrometer is a very sensitive device with a large dynamic range of 5 x 10⁴ on a standard peptide mixture [61]. As with all shotgun proteomic methods discussed so far, the mass spectrometer is operated in a data-dependent mode where the most intense precursor ions are sequentially isolated and subjected to CID in a series of narrow m/z ranges during HPLC-MS/MS analysis. By limiting the m/z range for DDA selection of ions to a narrow subset of all available ions, precursor ions of lower intensity which are masked in a wide m/z range experiment by higher intensity precursor ions, are readily selected thus expanding detectable dynamic range and the number of proteins identified.
To achieve full coverage of the available m/z range of the LTQ-FT instrument (350–2,000) the samples were iteratively injected using the following m/z ranges for GPF: 350–550, 500–700, 650–850, 800–1,000, 950–1,500 and 1,450–2000. The criteria for a valid protein identification and functional annotation were the same as reported by Gharib et al [51]. In this GPF-based study, 91 unique proteins were identified in the pooled human BALF and 117 unique proteins were identified in the mouse BALF. Notable from this study was that functional analysis between human and murine BALF proteomes revealed enrichment in several pathways including oxidative stress proteins in the mouse compared to the human samples. The authors concluded that using murine models to study human lung function should be undertaken with an understanding of potentially significant differences between their respective BALF proteomes.
In a recent report, Nguyen et al. reported an examination of the BALF proteomes from five normal subjects each analyzed in triplicate on a new generation, hybrid LTQ Velos mass spectrometer (Thermo Fisher, San Jose, CA) [62]. Unlike the prior version of the LTQ, the LTQ Velos linear ion trap mass spectrometer used in this study incorporated an S-lens ion optic guide and a dual-pressure linear ion trap [63] that together increased the amount of data acquired in the same amount of time over the LTQ-FT. In fact, the rate of CID acquisition in the LTQ Velos is roughly twice that of the prior LTQ ion trap because of the new ion optics. Additionally, the use of a dual ion trap provides some improvement in data quality. Specifically, the first cell is held at a higher pressure (~5 x 10⁻³ Torr) which improves ion trapping, isolation, and fragmentation efficiencies while the second cell is held at lower pressure (4 x 10⁻⁴ Torr), allowing attainment of higher mass resolution for a given scan rate. The practical result for proteomics is that approximately twice as many scans may be acquired per second of chromatographic time than in the prior generation LTQ ion traps discussed above [63].
Thus, a combination of the LTQ Velos (Thermo Fisher, San Jose, CA) and genome-based GPF was used by Nguyen et al. to examine BALF from five normal human subjects in triplicate [[49, 62] using the following three m/z ranges: 400–559, 559–846, 846–2000 that were predicted based on the theoretical human tryptic peptide proteome. This genome-based GPF approach produced m/z ranges with approximately equal ion densities based on theoretical distributions of tryptic peptides for the human genome [64], which should in theory produce more efficient data acquisition for each m/z range. The resulting tandem mass spectra were searched against Human IPI database (version 3.53) with criteria for a valid protein identification and functional annotation being the same as above (section 3.3a) with a further criterion requiring a protein to be detected in 50% of the patient population prior to functional classification. This led to 251 unique proteins identified in the normal BALF proteome. Functional classification of these 251 proteins confirmed the known lung function matching previous results [65] that included inflammatory response, response to wounding, immune response, and carbohydrate binding/metabolism with the most abundant proteins again being albumin, complement 3, and mucin.
5 Re-analysis of prior data
While the studies described above used different technologies and bioinformatic methods to report BALF proteins and spanned over a ten year period, we wanted to assess if these various approaches made any difference in the proteins identified or the enrichment of functional categories they belonged to. Detailed information from three of the five data sets was available and could be re-examined; note that the three available data sets were all from the authors of this review or their collaborators. Unfortunately, the proteomic data was not publically available from the studies by Gharib et al. and Plymoth et al. to allow re-analysis.
To remove differences due to varied database search strategies, we re-analyzed data from the following reports: 1) straight DDA without GPF, 2) GPF, and 3) genome-based GPF of individuals. Tandem mass spectra were searched against the Human IPI database (version 3.53). In contrast to the original reports, all search criteria for matching a tandem mass spectrum to a peptide sequence were the same, specifically Xcorr ≥ 1.9 with charge state 1+, Xcorr ≥ 2.2 with charge state 2+, or Xcorr ≥ 3.75 with charge state 3+, as well as ΔCn ≥ 0.1. Tandem mass spectra passing these criteria were entered into ProteinProphet; a protein was considered identified only if a ProteinProphet probability ≥ 0.8 was achieved and only if more than one unique tryptic peptide was found for each protein. In order to compare the three non-MudDPIT reports to the MudPIT method, the SEQUEST scores used were identical to those in the MudPIT report for protein identification. The Plymoth data was not re-examined due to the lack of score criteria and the unavailability of the protein list associated with the normal BALF proteome. Interestingly, when the three non-MudPIT data sets were re-analyzed using identical search parameters for matching tandem mass spectra to peptide sequence and criteria for considering protein identification valid, the protein identifications were drastically different from the original report (Table 1) (See Supplemental Table 1 for protein identifications of re-analysis of the three non-MudPIT methods). Our reanalysis found that the genome-based GPF method detected twice as many proteins as the original MudPIT results. This result was mainly due to the removal of the requirement that a protein be detected in 50% of the patient population in the original report using genome-based GPF that was not applied to the other shotgun proteomic approaches. Furthermore, the pooled samples using a standard GPF method reported more than twice the number of proteins after re-analysis in comparison to the original identified proteins. While the data from the straight DDA shotgun proteomic method (no GPF) after re-analysis reported fewer proteins, this was due to the removal of redundant proteins when running SEQUEST against a newer database. These trends were also observed when the three non-MudPIT data were re-analyzed using the same criteria in the MudPIT analysis (Supplemental Table 1). The outcomes emphasize the necessity for guidelines when reporting the number of proteins since varying MS constraints may significantly alter the output of proteins identified.
Table 1.
Conditions and protein identifications for four “shotgun” proteomic approaches.
| 3.3a MUDPIT Gharib et al. in 2009 | 3.3b No GPF Chen et al. in 2008 | 3.3c GPF Gharib et al. in 2010 | 3.3d Genome-based GPF Nguyen et al. in 2012 | |
|---|---|---|---|---|
| # of subjects | 4 | 6 | 4 pooled | 5 |
| Instrument | Finnigan LCQ Deca ProteomeX IT | LTQ-FT ThermoFinnigan | LTQ-FT ThermoFinnigan | Hybrid LTQ-Velos |
| GPF range | None | None | 350–550, 500–700, 650–850, 800–1000, 950–1500, 1450–2000 | 400–559, 559–846, 846–2000 |
| Proteins Identified | 304 | 167 | 91 | 251 |
| Replicates | 2 | 4 | 0 | 3 |
| Database | IPI 3.01 | IPI 2.31 | IPI 2.31 | IPI 3.53 |
| minimum peptides | 3 | 2 | 2 | 2 |
| Proteins Identified (Reanalysis Criteria) | N/A | 123 | 205 | 598 |
| Proteins Identified (Reanalysis with MUDPIT Criteria) | 304 | 99 | 199 | 869 |
GPF: Gas phase fractionation.
We then reanalyzed the functional enrichment of the normal BALF proteome relative to the entire human proteome using Gene Ontology (GO) annotation and the DAVID software [40]. Functional categories were deemed significantly “enriched” using a variant of the one-tailed Fisher exact probability [66] using a false discovery rate (FDR) cutoff of 1%. Despite differences in the specific proteins identified, the top seven biological responses were identical in all four shotgun proteomic data sets regardless of the initial technology used to generate the data. (Figure 2) (See Supplemental Table 2 for additional information). Many of these processes are consistent with the lung’s known multi-faceted functions such as response to wounding, inflammatory and immune responses. Despite inter-individual heterogeneity and the low identification of common homologous proteins between all shotgun proteomic methods, key processes involved in immunity and inflammatory processes in the normal BALF proteome were tightly preserved across patients, time, and technology.
Figure 2.

Functional annotation of the top 10 biological processes of the normal BALF proteome as defined by four different “shotgun” proteomic approaches
6 Limitations
Considerable progress has been made in proteomic analysis of the normal BALF proteome over the last 33 years since Bell and Hook’s 2DE study in 1979. Since then improvements have occurred in protein separation that increased resolving power, data acquisition strategies that increased detectable dynamic range, and instrumentation that provided more tandem mass spectra. In addition, standardization of BALF collection has aided our current knowledge of the proteomic profile of BALF and led to inferences about the biology of the airways and airspaces. Still there are defined limits to our understanding that are framed by the technology used to describe the BALF proteome of normal individuals. For example, protein identifications obtained by mass spectrometry are dependent on the methods of separation, the data acquisition process, the version (i.e. content and annotation) of database used, statistical data analysis tools used to assign confident identifications, and of course the mass spectrometry technology employed. Hence, it is crucial to understand both the biological and the methodological contexts around which data are produced in order to carry out valid comparisons between data sets. Currently, efforts are underway to provide advice on contextualizing ‘metadata’ (i.e. data about the data) known as the “minimum information about a proteomics experiment” (MIAPE) guidelines [67, 68], making explicit both where samples came from and how analyses were performed [48]. These efforts are still ongoing and to date there is no defined “minimal description of the experiment” or “validation criteria.” Here we attempted to standardize the “validation criteria” for protein identifications among three shotgun MS data from the BALF proteome of normal volunteers. The results drastically differed from the original published results when the validation criteria were adjusted, reaffirming the necessity of a MIAPE guideline. All these efforts will increase confidence in MS-based comparative proteomic investigation, which in turn will provide important insights to mediators and pathways indicative of lung disease.
The BALF proteome is a very complex mixture and high molecular weight plasma proteins were over-represented in all four data sets examined with albumin and immunoglobin proteins being the most abundant. While immunodepletion is one accepted solution to improving proteomic coverage (i.e. extending detectable dynamic range), the methodology was not used in any of the examined studies because each sought to characterize the native normal BALF proteome. As such the data reviewed here represent an array of proteins, biased toward high abundant ones like albumin, that are found in human BALF and serum. The end result of circumventing depletion of high abundant proteins in these studies produced a normal BALF proteome that lacks proteins such as soluble triggering receptor expressed on myeloid cells 1 (sTREM-1), cytokines and growth factors that are detectable using other methods such as ELISAs [69, 70]. Detection of these lower abundance and lower molecular weight proteins will only be possible with enrichment strategies or novel proteomic technologies.
7 Future Directions
Presently, all shotgun MS data on normal BALF was generated using what is termed a “bottom-up” proteomic approach. In this method, proteins were digested into peptides that were subsequently fragmented and from which protein identifications are inferred using statistical analysis of the tandem mass spectra of the fragmented peptides. Although “bottom-up” proteomic approaches are capable of providing a great amount of information on the proteins present in a sample and their quantities, limitations remain. For example, the coverage of the proteome is biased towards high molecular weight proteins that produce a greater number of proteolytic peptides that are in turn more readily detected over smaller proteins. This is why one of the promising next phases of proteomics involves whole protein analysis in what is referred to as “top-down” proteomics in the efforts to also identify lower abundance and lower molecular weight proteins [71, 72], where the enzymatic digestion step is excluded and whole intact proteins are introduced into the mass spectrometer for fragmentation.
8 Summary
Herein we have reviewed progress in characterizing the normal human BALF proteome. To date this work included various methods spanning > 30 years including: 2DE with antibodies, 2DE-MS with PMF and shotgun proteomic analysis. The first proteomic study, identifying proteins by inference on gels using antibodies, revealed that many of the proteins identified in BALF are plasma proteins [46]. These plasma proteins most likely originated from passive diffusion through the air-blood barrier. More recent proteomic studies, utilizing 2DE-MS with PMF, further implicated proteins involved in tissue repair and proliferation, cytoskeleton, antioxidant, immunological and inflammation responses, and lipid metabolism [48].
We reanalyzed five different shotgun proteomic approaches that bypassed the 2DE separation step. Each study had variations on peptide separation technologies, data acquisition, MS instrumentation, and search/database criteria. In the original studies sample separation with multidimensional liquid chromatography using the MudPIT method reported the most comprehensive normal BALF proteome while the study of pooled BALF samples using GPF produced the least number of proteins identified using stringent score criteria for a validated protein identification. Fractionation, whether performed in liquid phase by MudPIT or in the gas phase by GPF, increased protein identifications. While advancements in databases, techniques and instrumentation increased the number of proteins identified, similar functional groups of proteins were identified in all of the shotgun proteomic data. This indicates that the normal BALF proteome, defined by standard shotgun proteomic approaches, has provided what now may be considered to be a well-established data set of BALF proteins in the normal lung. This collective data set, while biased toward high abundant proteins, then should serve as a reliable reference when performing future comparative analyses in various lung disease states.
Supplementary Material
Acknowledgments
This work was supported by a National Institutes of Health (NIH) UL1RR025014 Institute of Translational Health Sciences award (SAG), American Heart Association grant-in-aid (LMS), Washington State Life Sciences Discovery Fund to the Center for Intracellular Drug Delivery Grant 2496490, NIH HL083481 (LMS), K24HL068796 (LMS), NIH 1U54 447 AI57141 (DRG), and National Center for Research Resources Grant 1S10RR-449017262 (DRG).
Abbreviations
- BALF
Bronchoalveolar lavage fluid
- ELF
epithelial lining fluid
- GPF
gas phase fractionation
- 2DE-MS
two-dimensional gel electrophoresis mass spectrometry
- HPLC
high pressure liquid chromatography
- LTQ
linear ion trap
Footnotes
The authors have declared no conflict of interest
References
- 1.Hirsch J, et al. Proteomics: current techniques and potential applications to lung disease. Am J Physiol Lung Cell Mol Physiol. 2004;287(1):L1–23. doi: 10.1152/ajplung.00301.2003. [DOI] [PubMed] [Google Scholar]
- 2.Murray JF, NJA . Murray and Nadel’s textbook of respiratory medicine. 4. Philadelphia, Pennslyvania: Saunders; 2005. [Google Scholar]
- 3.Griese M. Pulmonary surfactant in health and human lung diseases: state of the art. Eur Respir J. 1999;13(6):1455–76. doi: 10.1183/09031936.99.13614779. [DOI] [PubMed] [Google Scholar]
- 4.Reynolds HY. Use of bronchoalveolar lavage in humans--past necessity and future imperative. Lung. 2000;178(5):271–93. doi: 10.1007/s004080000032. [DOI] [PMC free article] [PubMed] [Google Scholar]
- 5.Lindahl M, Stahlbom B, Tagesson C. Newly identified proteins in human nasal and bronchoalveolar lavage fluids: potential biomedical and clinical applications. Electrophoresis. 1999;20(18):3670–6. doi: 10.1002/(SICI)1522-2683(19991201)20:18<3670::AID-ELPS3670>3.0.CO;2-Z. [DOI] [PubMed] [Google Scholar]
- 6.Griese M, Noss J, von Bredow C. Protein pattern of exhaled breath condensate and saliva. Proteomics. 2002;2(6):690–6. doi: 10.1002/1615-9861(200206)2:6<690::AID-PROT690>3.0.CO;2-6. [DOI] [PubMed] [Google Scholar]
- 7.Beier J, et al. Induced sputum methodology: Validity and reproducibility of total glutathione measurement in supernatant of healthy and asthmatic individuals. J Lab Clin Med. 2004;144(1):38–44. doi: 10.1016/j.lab.2004.04.001. [DOI] [PubMed] [Google Scholar]
- 8.Baughman RP, Drent M. Role of bronchoalveolar lavage in interstitial lung disease. Clin Chest Med. 2001;22(2):331–41. doi: 10.1016/s0272-5231(05)70047-2. [DOI] [PubMed] [Google Scholar]
- 9.Rottoli P, Bargagli E. Is bronchoalveolar lavage obsolete in the diagnosis of interstitial lung disease? Curr Opin Pulm Med. 2003;9(5):418–25. doi: 10.1097/00063198-200309000-00014. [DOI] [PubMed] [Google Scholar]
- 10.Haslam PL, Baughman RP. Report of ERS Task Force: guidelines for measurement of acellular components and standardization of BAL. Eur Respir J. 1999;14(2):245–8. doi: 10.1034/j.1399-3003.1999.14b01.x. [DOI] [PubMed] [Google Scholar]
- 11.Meyer KC. The role of bronchoalveolar lavage in interstitial lung disease. Clin Chest Med. 2004;25(4):637–49. v. doi: 10.1016/j.ccm.2004.08.001. [DOI] [PubMed] [Google Scholar]
- 12.Lenz AG, et al. Bronchoalveolar lavage fluid proteins in human lung disease: analysis by two-dimensional electrophoresis. Electrophoresis. 1993;14(3):242–4. doi: 10.1002/elps.1150140141. [DOI] [PubMed] [Google Scholar]
- 13.von Bredow C, Birrer P, Griese M. Surfactant protein A and other bronchoalveolar lavage fluid proteins are altered in cystic fibrosis. Eur Respir J. 2001;17(4):716–22. doi: 10.1183/09031936.01.17407160. [DOI] [PubMed] [Google Scholar]
- 14.Soler N, et al. Bronchial microbial patterns in severe exacerbations of chronic obstructive pulmonary disease (COPD) requiring mechanical ventilation. Am J Respir Crit Care Med. 1998;157(5 Pt 1):1498–505. doi: 10.1164/ajrccm.157.5.9711044. [DOI] [PubMed] [Google Scholar]
- 15.Plymoth A, et al. Human bronchoalveolar lavage: biofluid analysis with special emphasis on sample preparation. Proteomics. 2003;3(6):962–72. doi: 10.1002/pmic.200300387. [DOI] [PubMed] [Google Scholar]
- 16.Schnapp LM, et al. Mining the acute respiratory distress syndrome proteome: identification of the insulin-like growth factor (IGF)/IGF-binding protein-3 pathway in acute lung injury. Am J Pathol. 2006;169(1):86–95. doi: 10.2353/ajpath.2006.050612. [DOI] [PMC free article] [PubMed] [Google Scholar]
- 17.Pittet JF, et al. Biological markers of acute lung injury: prognostic and pathogenetic significance. Am J Respir Crit Care Med. 1997;155(4):1187–205. doi: 10.1164/ajrccm.155.4.9105054. [DOI] [PubMed] [Google Scholar]
- 18.Bowler RP, et al. Proteomic analysis of pulmonary edema fluid and plasma in patients with acute lung injury. Am J Physiol Lung Cell Mol Physiol. 2004;286(6):L1095–104. doi: 10.1152/ajplung.00304.2003. [DOI] [PubMed] [Google Scholar]
- 19.Meyer KC, et al. An official American Thoracic Society clinical practice guideline: the clinical utility of bronchoalveolar lavage cellular analysis in interstitial lung disease. Am J Respir Crit Care Med. 2012;185(9):1004–14. doi: 10.1164/rccm.201202-0320ST. [DOI] [PubMed] [Google Scholar]
- 20.Capron F. Bronchoalveolar lavage. Arch Anat Cytol Pathol. 1997;45(5):255–60. [PubMed] [Google Scholar]
- 21.Bell DY, et al. Plasma proteins of the bronchoalveolar surface of the lungs of smokers and nonsmokers. Am Rev Respir Dis. 1981;124(1):72–9. doi: 10.1164/arrd.1981.124.1.72. [DOI] [PubMed] [Google Scholar]
- 22.Wu J, et al. Differential proteomic analysis of bronchoalveolar lavage fluid in asthmatics following segmental antigen challenge. Mol Cell Proteomics. 2005;4(9):1251–64. doi: 10.1074/mcp.M500041-MCP200. [DOI] [PubMed] [Google Scholar]
- 23.Noel-Georis I, et al. Proteomics as the tool to search for lung disease markers in bronchoalveolar lavage. Dis Markers. 2001;17(4):271–84. doi: 10.1155/2001/607263. [DOI] [PMC free article] [PubMed] [Google Scholar]
- 24.Sorensen GL, Husby S, Holmskov U. Surfactant protein A and surfactant protein D variation in pulmonary disease. Immunobiology. 2007;212(4–5):381–416. doi: 10.1016/j.imbio.2007.01.003. [DOI] [PubMed] [Google Scholar]
- 25.Agostoni P, et al. Surfactant protein B and RAGE increases in the plasma during cardiopulmonary bypass: a pilot study. Eur Respir J. 2011;37(4):841–7. doi: 10.1183/09031936.00045910. [DOI] [PubMed] [Google Scholar]
- 26.Pilette C, et al. Reduced epithelial expression of secretory component in small airways correlates with airflow obstruction in chronic obstructive pulmonary disease. Am J Respir Crit Care Med. 2001;163(1):185–94. doi: 10.1164/ajrccm.163.1.9912137. [DOI] [PubMed] [Google Scholar]
- 27.Diamond JM, et al. Elevated plasma clara cell secretory protein concentration is associated with high-grade primary graft dysfunction. Am J Transplant. 2011;11(3):561–7. doi: 10.1111/j.1600-6143.2010.03431.x. [DOI] [PMC free article] [PubMed] [Google Scholar]
- 28.Determann RM, et al. Plasma CC16 levels are associated with development of ALI/ARDS in patients with ventilator-associated pneumonia: a retrospective observational study. BMC Pulm Med. 2009;9:49. doi: 10.1186/1471-2466-9-49. [DOI] [PMC free article] [PubMed] [Google Scholar]
- 29.Hermans C, Bernard A. Lung epithelium-specific proteins: characteristics and potential applications as markers. Am J Respir Crit Care Med. 1999;159(2):646–78. doi: 10.1164/ajrccm.159.2.9806064. [DOI] [PubMed] [Google Scholar]
- 30.Anderson NL, Anderson NG. The human plasma proteome: history, character, and diagnostic prospects. Mol Cell Proteomics. 2002;1(11):845–67. doi: 10.1074/mcp.r200007-mcp200. [DOI] [PubMed] [Google Scholar]
- 31.Barnouin K. Two-dimensional gel electrophoresis for analysis of protein complexes. Methods Mol Biol. 2004;261:479–98. doi: 10.1385/1-59259-762-9:479. [DOI] [PubMed] [Google Scholar]
- 32.Issaq HJ. The role of separation science in proteomics research. Electrophoresis. 2001;22(17):3629–38. doi: 10.1002/1522-2683(200109)22:17<3629::AID-ELPS3629>3.0.CO;2-O. [DOI] [PubMed] [Google Scholar]
- 33.Washburn MP, Wolters D, Yates JR., 3rd Large-scale analysis of the yeast proteome by multidimensional protein identification technology. Nat Biotechnol. 2001;19(3):242–7. doi: 10.1038/85686. [DOI] [PubMed] [Google Scholar]
- 34.Perkins DN, et al. Probability-based protein identification by searching sequence databases using mass spectrometry data. Electrophoresis. 1999;20(18):3551–67. doi: 10.1002/(SICI)1522-2683(19991201)20:18<3551::AID-ELPS3551>3.0.CO;2-2. [DOI] [PubMed] [Google Scholar]
- 35.Colinge J, et al. OLAV: towards high-throughput tandem mass spectrometry data identification. Proteomics. 2003;3(8):1454–63. doi: 10.1002/pmic.200300485. [DOI] [PubMed] [Google Scholar]
- 36.Yates JR, 3rd, et al. Method to correlate tandem mass spectra of modified peptides to amino acid sequences in the protein database. Anal Chem. 1995;67(8):1426–36. doi: 10.1021/ac00104a020. [DOI] [PubMed] [Google Scholar]
- 37.Keller A, et al. Empirical statistical model to estimate the accuracy of peptide identifications made by MS/MS and database search. Anal Chem. 2002;74(20):5383–92. doi: 10.1021/ac025747h. [DOI] [PubMed] [Google Scholar]
- 38.Nesvizhskii AI, et al. A statistical model for identifying proteins by tandem mass spectrometry. Anal Chem. 2003;75(17):4646–58. doi: 10.1021/ac0341261. [DOI] [PubMed] [Google Scholar]
- 39.Dennis G, Jr, et al. DAVID: Database for Annotation, Visualization, and Integrated Discovery. Genome Biol. 2003;4(5):P3. [PubMed] [Google Scholar]
- 40.Ashburner M, et al. Gene ontology: tool for the unification of biology. The Gene Ontology Consortium. Nat Genet. 2000;25(1):25–9. doi: 10.1038/75556. [DOI] [PMC free article] [PubMed] [Google Scholar]
- 41.Pappin DJ, Hojrup P, Bleasby AJ. Rapid identification of proteins by peptide-mass fingerprinting. Curr Biol. 1993;3(6):327–32. doi: 10.1016/0960-9822(93)90195-t. [DOI] [PubMed] [Google Scholar]
- 42.Henzel WJ, et al. Identifying proteins from two-dimensional gels by molecular mass searching of peptide fragments in protein sequence databases. Proc Natl Acad Sci U S A. 1993;90(11):5011–5. doi: 10.1073/pnas.90.11.5011. [DOI] [PMC free article] [PubMed] [Google Scholar]
- 43.Mann M, Hojrup P, Roepstorff P. Use of mass spectrometric molecular weight information to identify proteins in sequence databases. Biol Mass Spectrom. 1993;22(6):338–45. doi: 10.1002/bms.1200220605. [DOI] [PubMed] [Google Scholar]
- 44.James P, et al. Protein identification by mass profile fingerprinting. Biochem Biophys Res Commun. 1993;195(1):58–64. doi: 10.1006/bbrc.1993.2009. [DOI] [PubMed] [Google Scholar]
- 45.Yates JR, 3rd, et al. Peptide mass maps: a highly informative approach to protein identification. Anal Biochem. 1993;214(2):397–408. doi: 10.1006/abio.1993.1514. [DOI] [PubMed] [Google Scholar]
- 46.Bell DY, Hook GE. Pulmonary alveolar proteinosis: analysis of airway and alveolar proteins. Am Rev Respir Dis. 1979;119(6):979–90. doi: 10.1164/arrd.1979.119.6.979. [DOI] [PubMed] [Google Scholar]
- 47.Sabounchi-Schutt F, et al. Detection and identification of human bronchoalveolar lavage proteins using narrow-range immobilized pH gradient DryStrip and the paper bridge sample application method. Electrophoresis. 2001;22(9):1851–60. doi: 10.1002/1522-2683(200105)22:9<1851::AID-ELPS1851>3.0.CO;2-8. [DOI] [PubMed] [Google Scholar]
- 48.Wattiez R, Falmagne P. Proteomics of bronchoalveolar lavage fluid. J Chromatogr B Analyt Technol Biomed Life Sci. 2005;815(1–2):169–78. doi: 10.1016/j.jchromb.2004.10.029. [DOI] [PubMed] [Google Scholar]
- 49.Chen J, et al. Exploration of the normal human bronchoalveolar lavage fluid proteome. Proteomics Clin Appl. 2008;2(4):585–95. doi: 10.1002/prca.200780006. [DOI] [PMC free article] [PubMed] [Google Scholar]
- 50.Giorgianni F, Desiderio DM, Beranova-Giorgianni S. Proteome analysis using isoelectric focusing in immobilized pH gradient gels followed by mass spectrometry. Electrophoresis. 2003;24(1–2):253–9. doi: 10.1002/elps.200390021. [DOI] [PubMed] [Google Scholar]
- 51.Gharib SA, et al. Mapping the lung proteome in cystic fibrosis. J Proteome Res. 2009;8(6):3020–8. doi: 10.1021/pr900093j. [DOI] [PubMed] [Google Scholar]
- 52.Griffin TJ, Aebersold R. Advances in proteome analysis by mass spectrometry. J Biol Chem. 2001;276(49):45497–500. doi: 10.1074/jbc.R100014200. [DOI] [PubMed] [Google Scholar]
- 53.Griffin TJ, Aebersold R. Advances in proteome analysis by mass spectrometry. J Biol Chem. 2001;276(49):45497–500. doi: 10.1074/jbc.R100014200. [DOI] [PubMed] [Google Scholar]
- 54.Shteynberg D, et al. iProphet: multi-level integrative analysis of shotgun proteomic data improves peptide and protein identification rates and error estimates. Mol Cell Proteomics. 2011;10(12):M111.007690. doi: 10.1074/mcp.M111.007690. [DOI] [PMC free article] [PubMed] [Google Scholar]
- 55.Keller A, Shteynberg D. Software pipeline and data analysis for MS/MS proteomics: the trans-proteomic pipeline. Methods Mol Biol. 2011;694:169–89. doi: 10.1007/978-1-60761-977-2_12. [DOI] [PubMed] [Google Scholar]
- 56.Plymoth A, et al. Rapid proteome analysis of bronchoalveolar lavage samples of lifelong smokers and never-smokers by micro-scale liquid chromatography and mass spectrometry. Clin Chem. 2006;52(4):671–9. doi: 10.1373/clinchem.2005.060715. [DOI] [PubMed] [Google Scholar]
- 57.Noel-Georis I, et al. Database of bronchoalveolar lavage fluid proteins. J Chromatogr B Analyt Technol Biomed Life Sci. 2002;771(1–2):221–36. doi: 10.1016/s1570-0232(02)00114-9. [DOI] [PubMed] [Google Scholar]
- 58.Sabounchi-Schutt F, et al. Changes in bronchoalveolar lavage fluid proteins in sarcoidosis: a proteomics approach. Eur Respir J. 2003;21(3):414–20. doi: 10.1183/09031936.03.00060902. [DOI] [PubMed] [Google Scholar]
- 59.Gharib SA, et al. Of mice and men: comparative proteomics of bronchoalveolar fluid. Eur Respir J. 2010;35(6):1388–95. doi: 10.1183/09031936.00089409. [DOI] [PMC free article] [PubMed] [Google Scholar]
- 60.Spahr CS, et al. Towards defining the urinary proteome using liquid chromatography- tandem mass spectrometry. I. Profiling an unfractionated tryptic digest. Proteomics. 2001;1(1):93–107. doi: 10.1002/1615-9861(200101)1:1<93::AID-PROT93>3.0.CO;2-3. [DOI] [PubMed] [Google Scholar]
- 61.Makarov A, et al. Dynamic range of mass accuracy in LTQ Orbitrap hybrid mass spectrometer. J Am Soc Mass Spectrom. 2006;17(7):977–82. doi: 10.1016/j.jasms.2006.03.006. [DOI] [PubMed] [Google Scholar]
- 62.Nguyen EV, et al. Proteomic Profiling of Bronchoalveolar Lavage Fluid in Critically Ill Patients with Ventilator-associated Pneumonia. PLOS ONE. 2012 doi: 10.1371/journal.pone.0058782. [DOI] [PMC free article] [PubMed] [Google Scholar]
- 63.Second TP, et al. Dual-pressure linear ion trap mass spectrometer improving the analysis of complex protein mixtures. Anal Chem. 2009;81(18):7757–65. doi: 10.1021/ac901278y. [DOI] [PMC free article] [PubMed] [Google Scholar]
- 64.Scherl A, et al. Genome-specific gas-phase fractionation strategy for improved shotgun proteomic profiling of proteotypic peptides. Anal Chem. 2008;80(4):1182–91. doi: 10.1021/ac701680f. [DOI] [PubMed] [Google Scholar]
- 65.Huang dW, Sherman BT, Lempicki RA. Systematic and integrative analysis of large gene lists using DAVID bioinformatics resources. Nat Protoc. 2009;4(1):44–57. doi: 10.1038/nprot.2008.211. [DOI] [PubMed] [Google Scholar]
- 66.Taylor CF, et al. The minimum information about a proteomics experiment (MIAPE) Nat Biotechnol. 2007;25(8):887–93. doi: 10.1038/nbt1329. [DOI] [PubMed] [Google Scholar]
- 67.Orchard S, Hermjakob H, Apweiler R. The proteomics standards initiative. Proteomics. 2003;3(7):1374–6. doi: 10.1002/pmic.200300496. [DOI] [PubMed] [Google Scholar]
- 68.Hermjakob H. The HUPO proteomics standards initiative--overcoming the fragmentation of proteomics data. Proteomics. 2006;6(Suppl 2):34–8. doi: 10.1002/pmic.200600537. [DOI] [PubMed] [Google Scholar]
- 69.Gibot S, et al. Soluble triggering receptor expressed on myeloid cells and the diagnosis of pneumonia. N Engl J Med. 2004;350(5):451–8. doi: 10.1056/NEJMoa031544. [DOI] [PubMed] [Google Scholar]
- 70.Determann RM, et al. Serial changes in soluble triggering receptor expressed on myeloid cells in the lung during development of ventilator-associated pneumonia. Intensive Care Med. 2005;31(11):1495–500. doi: 10.1007/s00134-005-2818-7. [DOI] [PubMed] [Google Scholar]
- 71.Sze SK, et al. Top-down mass spectrometry of a 29-kDa protein for characterization of any posttranslational modification to within one residue. Proc Natl Acad Sci U S A. 2002;99(4):1774–9. doi: 10.1073/pnas.251691898. [DOI] [PMC free article] [PubMed] [Google Scholar]
- 72.Kelleher NL. Top-down proteomics. Anal Chem. 2004;76(11):197A–203A. [PubMed] [Google Scholar]
Associated Data
This section collects any data citations, data availability statements, or supplementary materials included in this article.