Abstract
Background:
Eucommia ulmoides Oliv (EU), a dioecious perennial angiosperm, is one of the oldest tonics in Chinese traditional medicine. The tea of male flowers of EU has been become popularities and seen as aspirational health care tea in China. There were no enough marks and effective method to control the quality of male flowers of EU.
Objective:
A simple and efficient HPLC method was developed for the simultaneous determination of 11 bioactive compounds (4 iridoids, 1 phenylpropanoid, 6 flavonoids). HPLC chromatographic fingerprint and hierarchical cluster analysis were used to evaluate and classify the samples of male flowers of EU which came from different locations in China.
Materials and Methods:
Samples were separated on a Thermal hypersil gold column (250 mm × 4.6 mm, 5 μm) and detected by an ultraviolet detector. The UV wavelength was set at 206, 236, and 206 nm. Mobile phase consisted of methanol (B) and phosphoric acid-water (0.5%) (C) using a gradient elution. Analytes were performed at 25°C with a flow rate of 1.0 mL/min.
Results:
In quantitative analysis, the eleven components showed good regression (r2 > 0.9996) within linear ranges, and their recoveries were in the range of 98.65-102.31%. In the chromatographic fingerprint, 16 peaks were selected as the characteristic peaks to assess the similarities of different samples. Hierarchical cluster analysis (HCA) was also applied to differentiate the samples based on the area of all the common peaks. The samples which had higher similarity in HPLC fingerprint were classified as a cluster.
Conclusion:
This study will provide methodological reference for the quality control and sample classification of male flowers of E. ulmoides.
Keywords: Chromatographic fingerprint, Eucommia ulmoides Oliver, hierarchical cluster analysis, HPLC
INTRODUCTION
Eucommia ulmoides Oliv (EU), also called Du-zhong, a dioecious perennial angiosperm, is one of the oldest tonics in Chinese traditional medicine.[1] Cortex of EU has been used as a Traditional Chinese Medicine for thousands of years. In the past 20 years, the leaf of EU has become a popular functional health food and plant medicine material in China and Japan.[2] Of course, E. ulmoides has been extensively investigated in phytochemistry, and the results indicated that iridoids (such as aucubin, geniposidic acid, asperuloside, geniposide etc), phenylpropanoids (such as chlorogenic acid) and flavonoids (such as quercetin and kaempferol) were the main components in this plant.[3,4,5,6,7] Pharmacological studies demonstrated that chlorogenic acid has antioxidant activity, antimicrobial, anti-angiogenic effect and regulates glucose and lipids metabolism.[8,9,10] Iridoid compounds are known to have a variety of biological activities such as improvement the collagen synthesis, anti-aging, anti-tumoral, anti-obesity and immunity promotion.[11,12,13] Flavonoids also display many bioactive properties such as antiviral, anti-inflammatory, anti-oxidant, and glycation inhibitory activities.[14,15] These reports indicate that these potentially bioactive compounds may be responsible for the various biological activities of EU.
There are inextricable links between medicinal plants and their ecological environment in the process of long-term survival competition and natural selection. The genetic variation of active ingredients in germplasm resources is an important factor affecting yield and quality of drugs. To some extent, the formulation of “authentic ingredients” with excellent efficacy is attributed to the action of the “local variety”. In addition, herbs planted in different regions may affect the quality of their chemical composition and the amounts of major bioactive constituents.[16] The quality of the herbs is determined by main two factors: Region and species.
Eucommia ulmoides is dioecious, of course, there are male and female flowers in nature. In this paper, male flowers of EU were study. Though the research about flowers started relatively late, some studies have shown that flower, like cortex and leaf, was found to be rich of bioactive compounds.[17,18] In last 10 years, the tea of male flowers of EU has been become popularity and were seen as aspirational health care tea by a growing middle class. But now, there were no enough marks and effective method to control the quality of male flowers of EU. In the present study, a HPLC method was developed for the quality evaluation of male flowers of EU. In consideration of the complexity of herb medicine, similarity analysis (SA) and hierarchical clustering analysis (HCA) were used to reasonably define the class of the herbal medicine and to efficiently evaluate the differentiation of the male flowers of EU. We expected that the method and marks would be helpful for the quality control and classification of the male flowers of EU in the future.
MATERIALS AND METHODS
Reagents and materials
Aucubin (EU-1), geniposidic acid (EU-2), chlorogenic acid (EU-3), geniposide (EU-5) and quercetin (EU-11) were purchased from the National Institute for Food and Drug Control (Beijing, China). Asperuloside (EU-4), quercetin-3-O-0β-D-glucopyranosyl (1 → 2)β-D-glucopyranosid (EU-6), quercetin-3-O-α-L-arabinopyranosyl (1 → 2)β-D-glucopyranoside (EU-7), quercetin-3-O-β-D-glucopyranoside (EU-8), isorhamnetin-3-O-β-D-glucopyranoside (EU-9) and astragalin (EU-10) were extracted, isolated and purified from male flowers of EU in our laboratory. All compounds were identified using ESI-MS, 1H-NMR and 13C-NMR spectrometric techniques. The purities calculated by normalization of the peak areas were 98.1%, 98.4%, 97.8%, 98.7%, 98.8% and 97.4%, respectively. Methanol (MeOH) used for HPLC was of chromatographic grade (Tianjin Company Inc., Tianjin, China), and water was distilled water. Other reagent solutions were of analytical grade. Sixteen batches of samples collected from different regions. Voucher specimens (HNCEU-03) were stored in Engineering Center of Henan Province of Eucommia ulmoides Cultivation and Utilization, Department of Pharmacy, Henan University.
Standard solution preparation
Eleven reference compounds were accurately weighed and dissolved in MeOH, then diluted to appropriate concentration for the establishment of calibration curves. All stock and working standard solutions were stored at 4°C until used for analysis.
Sample solution preparation
Pulverized sample (100 mesh, 2.0 g) was weighed accurately into a 100 mL conical flask with cover and dipped in 50 mL of ethanol-water (95:5, v/v) for 0.5 h, then extracted in an ultrasonic bath for 0.5 h. The extracts were filtered and evaporated under vacuum, the residues were dissolved in 10 mL volumetric flask with MeOH. The extracts were filtrated through 0.22 μm membrane filter before HPLC analysis.
Instrument and chromatographic conditions
The chromatographic separation was performed on Shimadezu LC-10A, equipped with a quaternary pump, an autosampler, a UV (SPD-10A) detector and a chemstation soft ware program (N2000) for analysis of the HPLC data. Thermal reversed-phase column (250 mm × 4.6 mm, 5 μm) was used with column temperature set at 25°C. The mobile phase: Methanol (B) - phosphoric acid-water (0.5%)(C). The gradient program was as follow: 0-30 min, linear gradient 5-15% B, 30-70 min, linear gradient 15-30% B, 70-125 min, linear gradient 30-70% B, 120-130 min, linear gradient 70-80% B. The flow rate was 1.0 mL/min, and detection wavelength was set at 206 nm from 0 to 15 min, 15-55 min at 236 nm, 55-130 min at 206 nm. 10 μL solution was injected for acquiring chromatograms.
Data analysis
The chromatographic profiles of all extracts were performed by professional software named Similarity Evaluation System for Chromatographic Fingerprint of Traditional Chinese Medicine (Version 2004 A), which was recommended by the State Food and Drug Administration of China (SFDA) for evaluating similarities of chromatographic profiles of TCM. The hierarchical cluster analysis (HCA) of samples was performed using SPSS 18.0 software.
RESULTS AND DISCUSSION
Optimization of extraction method
In order to obtain the best extraction efficiency, the extraction method, extraction solvents were optimized. The constituents of the flowers of EU were extracted by ultrasonic, water bath, microwave and blitzkrieg extraction. The results showed that extraction efficiency of water reflux extraction and ultrasonic extraction is equivalent. In order to simplify the extraction process, ultrasonic extraction was chosen. The efficiency of extraction was evaluated by using different solvents, such as methanol, ethanol and water. The best solvent was found to be ethanol-water (95-5), which was less poisonous and provided the highest values in the contents of the 11 markers. The analytic results demonstrated that the established extraction method was adequate and appropriate.
Optimization of chromatographic conditions
In order to obtain the chromatograms with better separation and sharp peaks within a short time, we optimized the separation conditions including the column, mobile phase, detection wavelength, elution gradient and column temperature in this study. Three reversed-phase columns, Thermo BDS hypersil C18 column (250 mm × 4.6 mm, 5 μm), Thermo hypersil gold column (250 mm × 4.6 mm, 5 μm) and Thermo syncronis C18 (250 mm × 4.6 mm, 5 μm), were tested. Only Thermal hypersil gold column produced more peaks in chromatograms and had baseline separation of the 11 constituents. Different compositions of mobile phases (ACN-H2O or MeOH-H2O) and different gradient elution programs were tried. The MeOH-H2O system was used as the mobile phase. It could give rise to more peaks, but separation was not satisfactory, especially the tailing factor of chlorogenic acid and flavonoids. According to the literature,[19] acid could achieve better separation for phenolic acid, thus, 0.5% phosphoric acid was added to the MeOH-H2O system to further improve the peak shape. Because the analytes had a great difference in polarity, the mobile phase was used the gradient elution. According to the UV spectra of 11 markers recorded by DAD full scan in the range from 200 to 400 nm, 206 nm was selected for monitoring the aucubin and six flavonoids markers, 236 nm was used to monitor geniposidic acid, chlorogenic acid, asperuloside and geniposide. Compared with the usage of single-wavelength UV detection, Wavelength conversion method can improve the detection limit of each mark. Column temperature was kept at 25°C and the flow rate was set at 1.0 mL/min for optimal separation.
Selection and identification of markers
Iridoids and flavonoids are the major active compounds in the EU. In the present study, the selected markers, which contained 4 iridoids, 1 phenylpropionic acid and 6 flavonoids, were all the main constituents of EU and had significant pharmacological effect reported before. Peaks of these chemical markers were assigned in HPLC by comparing individual peak retention times with those of the standards. Peaks at retention times 10.74, 19.17, 32.27, 34.98, 47.30, 59.14, 64.35, 73.64, 86.26, 89.27 and 106.98 were determined to be aucubin (EU-1), geniposidic acid (EU-2), chlorogenic acid (EU-3), asperuloside (EU-4), geniposide (EU-5), quercetin-3-O-β-D-glucopyranosyl (1 → 2)β-D-glucopyranosid (EU-6), quercetin-3-O-α-L-arabinopyranosyl (1 → 2)β-D-glucopyranoside (EU-7), quercetin-3-O-β-D-glucopyranoside (EU-8), isorhamnetin-3-O-β-D-glucopyranoside (EU-9), astragalin (EU-10), quercetin (EU-11) respectively [Figure 1].
Figure 1.
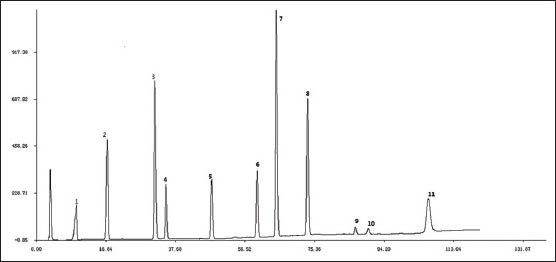
Representative HPLC chromatograms of mixed standard compounds
Method validation of quantitative analysis
The method was validated in terms of specificity, linearity, precision, repeatability, stability and recovery test. The flowers of EU for method validation was collected in Lingbao Henan province, China, named S4. Specificity was investigated by comparing the Chromatograms of mixed standards and the extract of flower of EU. According to the three-dimensional plot of the absorbance as a function of retention time and wavelength in the HPLC-DAD data for sample S4, no evidence of peak of impurity which overlapped with those of markers was found in Figure 2.
Figure 2.
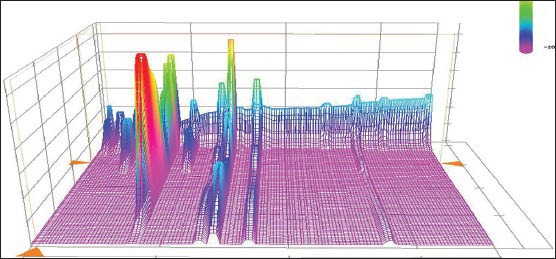
Three-dimensional plot of the absorbance of extraction of male flower of EU
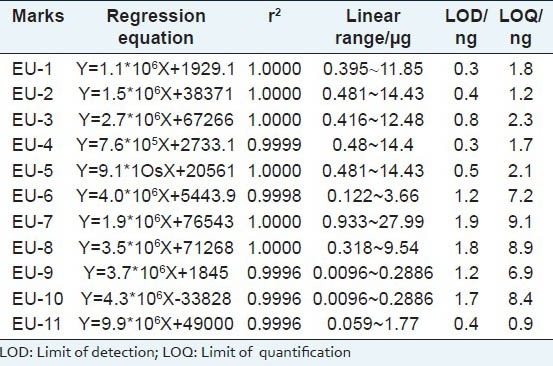
The calibration curve was generated to confirm the linear relationship between the peak area and the concentrations of each reference compound in the test samples. The 11 standard compounds were accurately weighed, dissolved and diluted with 50% methanol in a volumetric flask to obtain standard solutions for the calibration curves. The calibration graphs were plotted after linear regression of the peak areas versus the corresponding concentrations. The linear regression equations, correlation coefficients and ranges of calibration curves for the 11 standard compounds are shown in Table 1. The calibration curves showed good linear regression, with correlation coefficient over 0.9996 within test ranges. LOD and LOQ were determined at S/N of about 3 and 10, respectively.
Table 1.
Linear regression data, LOD and LOQ of investigated compounds
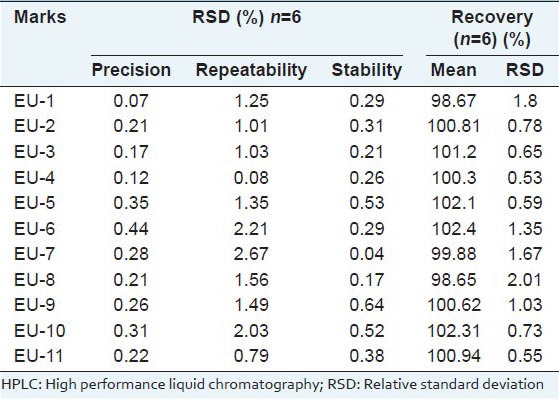
The precision was evaluated with the solution of sample S4 under the selected optimal conditions six times in one day for intraday variation and the RSD were less than 0.5%. The repeatability was examined by the injection of six different working solutions of sample 4, which were prepared with the same sample preparation procedure. Repeat ability was expressed as the RSD, and the values were less than 2.67%. All the values results are shown in Table 2. The solution of sample S4 was injected into the apparatus in 0, 2, 4, 8, 12, 24, and 36 h to evaluate the stability of the solution. Stability was expressed as the RSD, and the values were less than 0.29% for the 11 compounds. The recovery test was performed by adding known amounts of the 11 standards to the samples. Then, the extraction and analysis were performed according to the above sample preparation procedure. The mean recovery of the 11 marks was 98.65-102.31%, and their RSD values were less than 2.01% [Table 2].
Table 2.
Precision, repeatability, stability and recovery of the HPLC method for determination of the 11 markers
Quantitative determination of 11 markers of samples
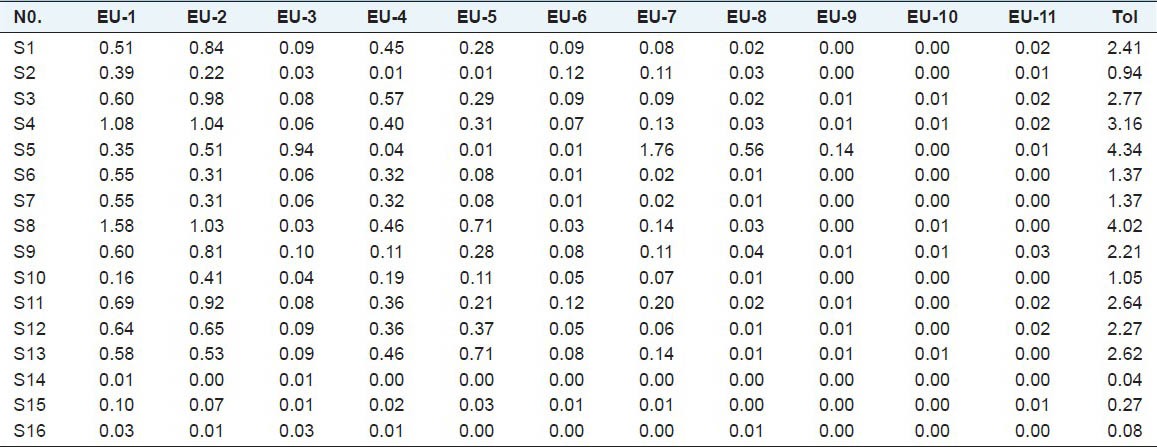
The contents of eleven markers in 16 batches of male flowers of EU were measured with the developed method. The representative HPLC chromatograms of the extract of male flowers of EU are shown in Figure 3. The contents of 11 markers were calculated from the regression equations obtained from calibration curves, and the results were shown in Table 3, expressed as the percentage of each constituent in crude drug. The results indicated that the internal qualities of 16 batches of male flower of EU had obvious difference, owing to the sampling locations and variety. S5 was a new variety with more content of chlorogenic acid and flavonoids. The samples that came from Lingbao Henan province had relatively high content not only in single mark content but also in total active content. Perhaps this is the reason that “Lingbao duzhong” was awarded “product geographical indication”.
Figure 3.
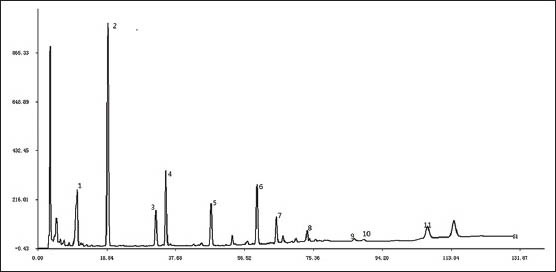
HPLC chromatograms of sample of male flower of EU
Table 3.
Contents (%) of 11 compounds in 16 samples of male flowers of EU
HPLC fingerprint analysis
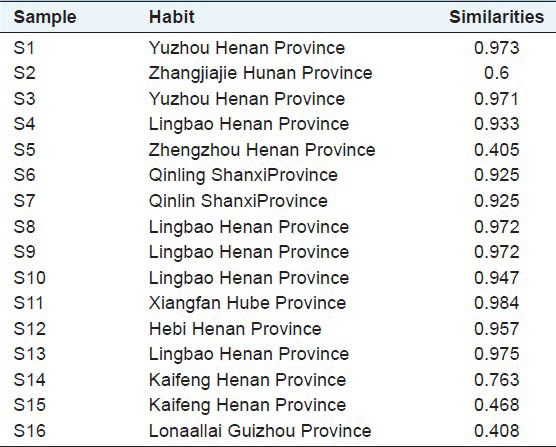
Multiple factors for herb, such as various regions, source and different harvesting time, would accordingly result in the differences in their qualities. In order to evaluate the difference from different locations, Chinese Pharmacopoeia Committee developed fingerprinting similarity software. In this study, HPLC chromatographic fingerprints were obtained from 16 batches of EU, the reference fingerprint (mark R) was developed with the median of all chromatograms, showed in [Figure 4], and the similarity values of all imported chromatograms with respect to the reference fingerprint were listed in [Table 4]. There were 16 common peaks in all 16 batches and the area sum of them accounted for above 90% of the overall peak area. Peaks 1, 2, 3, 4, 5, 8, 9, 11 and 15 were identified as aucubin, geniposidic acid, chlorogenic acid, asperuloside, geniposide, quercetin-3-O-β-D-glucopyranosyl (1 → 2)-β-D-glucopyranosid, quercetin-3-O-α-L-arabinopyranosyl (1 → 2) β-D-glucopyranoside, quercetin-3-O-β-D-glucopyra-nogside and quercetin by comparing with the corresponding chromatographic references under the same condition. The Chromatographic peak of isorhamnetin-3-O-β-D-glucopyranoside and astragalin had not been chosen common peaks indicated the two marks had lower comment in male flowers of EU and had no significant effect in the HPLC fingerprint of male flower of EU. Similarity comparison of the standard fingerprints with different samples showed that the similarity ranged from 0.405 to 0.984. The results showed that sample S2, S5, S14, S15 and S16 have a small similarity, respectively as 0.6, 0.405, 0.763, 0.468, 0.408. The similarity values of the other samples were more than 0.925. S5 was planted in Lingbao Henan province, it was a new cultivated variety. S14 and S15 were planted in desertification soil in Kaifeng Henan province, their contents were lower and the similarity values were not high. These results indicated that the chemical composition and content in the male flowers of EU varied with seed source and soil condition.
Figure 4.
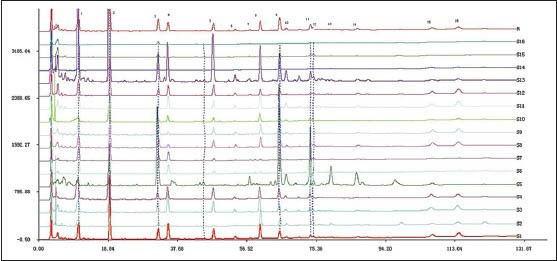
Chromatographic fingerprints obtained from 16 batches of male flower of EU
Table 4.
The similarities of the chromatograms of 16 samples of the male flower of EU
Hierarchical clustering analysis based on common peaks
In order to assess the resemblance and differences of these samples, a HCA of the male flowers of EU Samples was performed based on the relative peak areas of all the 16 characteristics chromatographic peaks. A dendrogram of HCA was generated [Figure 5], which revealed the relationships among the 16 samples from different origins. The 16 samples were classified into two broad categories. Samples numbers 5 were in category II, and the other samples were in category I. S5 is a new variety which had higher chlorogenic acid and flavonoid was classified cluster II alone. Category I was further divided into clusters A and cluster B. Samples numbers 2, 6, 7, 10, 14, 15 and 16 were in cluster A, and the others were in cluster B. Compared with the similarities of HPLC fingerprint, The results indicated the fingerprint 2, 6, 7, 14, 15 and 16 had less similarity were classified in group A, the others were in group B. The results bear out that the similarities of the chromatograms and HCA had the same functions in attribution the samples.
Figure 5.
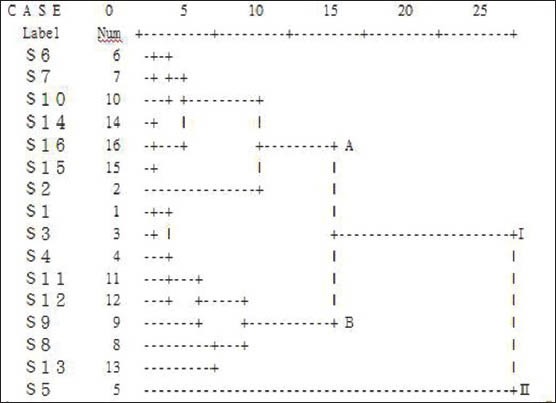
Results of hierarchical cluster analysis of 16 samples of male flower of EU based on common peaks
ACKNOWLEDGEMENTS
This work was supported by Special Fund for Forestry-scientific Research in the Public Interest of China (NO: 201004029)
Footnotes
Source of Support: This work was supported by Special Fund for Forestry-scientific Research in the Public Interest of China (NO: 201004029)
Conflict of Interest: None declared.
REFERENCES
- 1.Wang DW, Li Y, Li ZQ. Identification of a male-specific amplified fragment length polymorphism (AFLP) and a sequence characterized amplified region (SCAR) marker in Eucommia ulmoides Oliv. Int J Mol Sci. 2011;12:857–64. doi: 10.3390/ijms12010857. [DOI] [PMC free article] [PubMed] [Google Scholar]
- 2.Zhang Q, Su Y, Zhang J. Seasonal difference in antioxidant capacity and active compounds contents of Eucommia ulmoides Oliver leaf. Molecules. 2013;18:1857–68. doi: 10.3390/molecules18021857. [DOI] [PMC free article] [PubMed] [Google Scholar]
- 3.Takamura C, Hirata T, Yamaguchi Y, Ono M, Ikeda HM, Nohara T. Studies on the chemical constituents of green leaves of Eucommia ulmoides Oliv. J Nat Med. 2007;61:220–1. [Google Scholar]
- 4.Takamura C, Hirata T, Ueda T, Ono M, Miyashita H, Ikeda T, et al. Iridoids from the green leaves of Eucommia ulmoides. J Nat Prod. 2007;70:1312–6. doi: 10.1021/np0780046. [DOI] [PubMed] [Google Scholar]
- 5.Deyama T, Ikawa T, Kitagawa S, Nishibe S. The constituents of Eucommia ulmoides Oliv. isolation of dihydroxy dehydrodiconiferyl alcohol isomers and phenolic compounds. Chem Pharm Bull. 1987;35:1785–9. [Google Scholar]
- 6.Kim HY, Moon BH, Lee HJ, Cho DH. Flavonol glycosides from the leaves of Eucommia ulmoides with glycation inhibitory activity. J Ethnopharmacol. 2004;93:227–30. doi: 10.1016/j.jep.2004.03.047. [DOI] [PubMed] [Google Scholar]
- 7.Cheng J, Zhao YY, Cui YX, Cheng TM. Studies on flavonoids from leave of Eucommia ulmoides Oliv. China J Chin Mater Med (Zhongguo Zhong Yao Za Zhi) 2000;25:284–6. [PubMed] [Google Scholar]
- 8.Liu QM, Yang XM, Zhang L, Majetich G. Optimization of ultrasonic-assisted extraction of chlorogenic acid from Folium eucommiae and evaluation of its antioxidant activity. J Med Plants Res. 2010;4:2503–11. [Google Scholar]
- 9.Kim C, Yu HG, Sohn JH. The anti-angiogenic effect of chlorogenic acid on choroidal neovascularization. J Ophthalmol. 2010;24:163–8. doi: 10.3341/kjo.2010.24.3.163. [DOI] [PMC free article] [PubMed] [Google Scholar]
- 10.Meng SX, Cao JM, Feng Q, Peng JH, Hu YY. Roles of chlorogenic acid on regulating glucose and lipids metabolism. Evid Based Complement Alternat Med. 2013;8:1457–61. doi: 10.1155/2013/801457. [DOI] [PMC free article] [PubMed] [Google Scholar]
- 11.Deyama T, Nishibe S, Nakazawa Y. Constituents and pharmacological effects of Eucommia and Siberian ginseng. Acta Pharmacol Sin. 2001;22:1057–70. [PubMed] [Google Scholar]
- 12.Hirata T, Kobayashi T, Wada A, Ueda T, Fujikawa T, Nohara T, et al. Anti-obesity compounds in green leaves of Eucommia ulmoides. Bioorg Med Chem Lett. 2011;21:1786–91. doi: 10.1016/j.bmcl.2011.01.060. [DOI] [PubMed] [Google Scholar]
- 13.Ho JN, Lee YH, Park JS, Jun WJ, Kim HK, Hong BS, et al. Protective effects of aucubin isolated from Eucommia ulmoides against UVB-induced oxidative stress in human skin fibroblasts. Biol Pharm Bull. 2005;28:1244–8. doi: 10.1248/bpb.28.1244. [DOI] [PubMed] [Google Scholar]
- 14.Dai XP, Huang Q, Zhou BT, Gong ZC, Liu ZQ, Shi SY. Preparative isolation and purification of seven main antioxidants from Eucommia ulmoides Oliv. (Du–zhong) leaves using HSCCC guided by DPPH-HPLC experiment. Food Chem. 2013;139:563–70. doi: 10.1016/j.foodchem.2013.02.006. [DOI] [PubMed] [Google Scholar]
- 15.Li TL, Lu YR, Pan JP. Effects of Eucommia ulmoides Oliv. leaves tea on mouse immunity function. Chin J Public Health. 2007;23:1221–3. [Google Scholar]
- 16.Liu J, Chen X, Yang W, Zhang S, Wang F, Tang Z. Chemical fingerprinting of wild germplasm resource of ophiopogon japonicus from Sichuan basin, China by RP-HPLC coupled with hierarchical cluster analysis. Anal Lett. 2010;43:2411–23. [Google Scholar]
- 17.Zhang KJ, Dong JE, Ma BL, Gao JM, Han XW. Study on the distribution differences of the secondary metabolites in Eucommia ulmoides. Sci Silvae Sin. 2003;8:12–6. [Google Scholar]
- 18.Dong JE, Zhang KJ, Sun SH. Dynamic changes of secondary metabolites in Eucommia ulmoides male flower. J Plant Resour Environ. 2005;14:7–10. [Google Scholar]
- 19.Fan LL, Tu PF, Chen HB, Cai SQ. Simultaneous quantification of five major constituents in stems of Dracaena plants and related medicinal preparations from China and Vietnam by HPLC-DAD. Biomed Chromatogr. 2009;23:1191–200. doi: 10.1002/bmc.1242. [DOI] [PubMed] [Google Scholar]


