Abstract
Background:
Peach kernels which contain kinds of fatty acids play an important role in the regulation of a variety of physiological and biological functions.
Objective:
To establish an innovative and rapid diffuse reflectance near-infrared spectroscopy (DR-NIR) analysis method along with chemometric techniques for the qualitative and quantitative determination of a peach kernel.
Materials and Methods:
Peach kernel samples from nine different origins were analyzed with high-performance liquid chromatography (HPLC) as a reference method. DR-NIR is in the spectral range 1100-2300 nm. Principal component analysis (PCA) and partial least squares regression (PLSR) algorithm were applied to obtain prediction models, The Savitzky-Golay derivative and first derivative were adopted for the spectral pre-processing, PCA was applied to classify the varieties of those samples. For the quantitative calibration, the models of linoleic and oleinic acids were established with the PLSR algorithm and the optimal principal component (PC) numbers were selected with leave-one-out (LOO) cross-validation. The established models were evaluated with the root mean square error of deviation (RMSED) and corresponding correlation coefficients (R2).
Results:
The PCA results of DR-NIR spectra yield clear classification of the two varieties of peach kernel. PLSR had a better predictive ability. The correlation coefficients of the two calibration models were above 0.99, and the RMSED of linoleic and oleinic acids were 1.266% and 1.412%, respectively.
Conclusion:
The DR-NIR combined with PCA and PLSR algorithm could be used efficiently to identify and quantify peach kernels and also help to solve variety problem.
Keywords: Linoleic acid, multivariate modeling, near-infrared spectroscopy, oleic acid, peach kernel
INTRODUCTION
Peach is the third important deciduous tree fruits worldwide, ranking after apples and pears. A significant part of the harvested peaches is processed resulting in a substantial amount of waste stones – peach kernel.[1,2] Peach kernel is divided into two varieties, one is the kernel of Prunus persicae semen (L.) Batsch, the other is the kernel of Prunus davidiana (Carr.) Franch. Peach kernel is one of the nine plant ingredients used in a cocktail for cardiovascular disease (cardiovascular protective mix (CVPM)).[3,4] Such importance is probably related to its unsaturated fatty acids composition, linoleic and oleic acids [Figure 1], about 25% and 55% in unsaturated fatty acids, respectively.[5] Kinds of fatty acids play an important role in the regulation of physiological and biological functions.[6,7] Oleic acid is an 18-carbon monounsaturated fatty acid, essential in human nutrition and helps reducing triglycerides, low-density lipoprotein (LDL)-cholesterol, total cholesterol and glycemic index. Also, the increase in stability over oxidation of vegetable oil is attributed to oleic acid. Linoleic acid, which contains 18 carbon atoms and 2 double bonds, is very important for development and maintenance of the nervous system and the physiological functions in humans, since it reduces total and LDL-cholesterol levels.[8,9] Peach kernel oil is nutritionally attractive and has an opportunity of producing high value products from the biowaste in peach industry due to their unsaturated fatty acid and antioxidant constituents.[10] Peach kernel can be considered as an important source of essential oil for the food nutraceutical supplement industries and traditional Chinese medicine (TCM) preparations. Therefore, there is great importance to develop an analysis and a quality control method for the raw materials to insure the steady qualities of the related fields. Standard quality analyses like Soxhlet extraction for oil content and gas chromatography for fatty acid composition are not only laborious and time consuming,[11,12] but also are destructive method involving complicated sample pretreatment, which make them unfit for industrial application, in which large number of samples need to be analyzed in a reasonably short period of time. Which is why a fast, accurate and non-destructive analytical procedure for standard quality analyses would be desirable.
Figure 1.
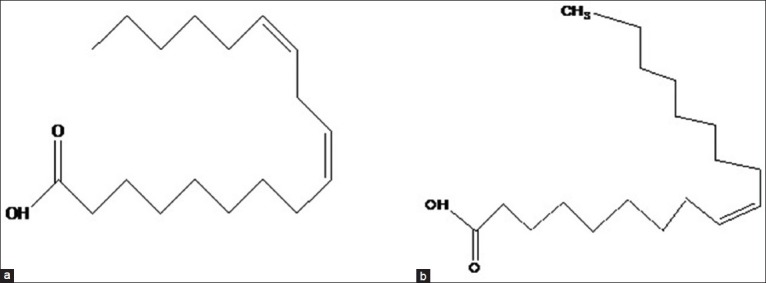
The molecular structures of linoleic acid (a) and oleic acid (b)
Near-infrared spectroscopy (NIR) combined with chemometric techniques is a widely used technique in the food, chemical, agrochemical and petrochemical industry, and has also been used in the TCM (and other natural products) researches. The technique appears to be useful for the identification of geographical origin and content determination with successful applications.[13,14] Multivariate analyses like principal component analysis (PCA), principal component regression (PCR), PLSR and etc., have been applied to NIR spectrometry for qualitative and quantitative analysis to extract vital information through non-destructive methods.[15,16] The principles of NIRS differ from usual conventional analytical techniques such as gas chromatography (GC), high-efficiency liquid chromatography (HPLC) and capillary electrophoresis (CE).[17,18] During the calibration process, reference values and corresponding chemometrics techniques are usually required. However, once the calibration models are established, the analysis time would be considerably reduced.
This research has two objectives, one is to establish classification methods to distinguish peach kernel varieties, such as P. persicae semen (L.) Batsch or P. davidiana (Carr.) Franch; the other is to establish quantitative calibration models for the rapid determination of linoleic and oleinic acids in peach kernel. To the best of our knowledge, there is no attempt other than this till now to use NIR along with multivariate regression methods for estimating the quality and quantity of peach kernel.
MATERIALS AND METHODS
Sample preparation
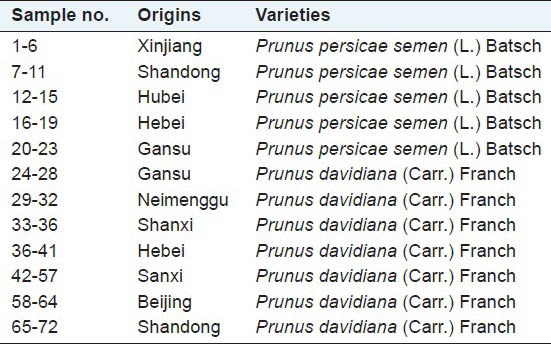
To obtain the most representative samples, N = 72 samples of peach kernel were collected from different growth places of China to give increased geographical variations. Moreover, samples of different varieties (P. persicae semen (L.) Batsch or P. davidiana (Carr.) Franch.) were also included. All the samples were identified by Dr. Feng Li (Liaoning University of Traditional Chinese Medicine). The voucher specimens had been deposited in Jiangsu Kanion Pharmaceutical Co., and the samples information are listed in Table 1. All the samples were milled into powder with a grinder. The final powder samples were prepared by passing the ground powder through a 10-mesh sieve. To ensure that moisture was not an interfering factor, all the samples were dried in an oven of 60°C, until the weight variation was <0.1%.
Table 1.
A summary of tested samples of peach kernel
Chemicals
The solvents used for chromatographic analysis were HPLC grade and were purchased from Fisher Company Inc., USA. Deionized water was prepared in a Mill-Q academic water purification system (Millipore, Bedford, MA, USA). The reagent used were analytical grade without further purification and provided by Kermel Chemical Co. (Tianjin, China).
NIR spectroscopic data collection
With the integrating sphere module of the AOTF-NIR analyzer (Luminar 5030, Brimrose, USA), which was equipped with a diffuse reflection accessory, the NIR spectra were collected in the transmittance mode. The module was rotating to ensure different points of sample can be scanned. Each spectrum was the average of 600 scans with air as the background. The spectra were collected over the range from 1100 to 2300 nm in 2-nm intervals. The peach kernel powder sample, which was measured an exact specified thickness of sample, was deposited in a cuvette with a diameter of 4.7 cm, and then was scanned three times. Between samples, the cuvette was emptied after each scan, then were treated with ethanol (95% v/v) in order to avoid cross-contamination, and refilled with the next peach kernel powder. Due to the near infrared the spectrometer is sensitive to the change of outer environment condition such as temperature and humidity. All the measurements were conducted at an ambient temperature of 23-25°C, and the numerical data of humidity was kept at an ambient level in the laboratory. In the experiment, all the samples were randomly divided into two data sets, one for calibration and the other for validation.[19]
Reference analysis method
All measurements were performed immediately after the NIR measurements. Profile of linoleic and oleic acids were determined by the HPLC method. The peach kernel were saponified with 0.5 moL/mL KOH/ETOH as saponifier. An amount of 0.5g of peach kernel, which was added 60 mL mixed solvent of 20:40 (v/v) 0.5 moL/mL KOH/ETOH and anhydrous ethanol, was refluxed gently with stirring for 2 hours in a thermostat water bath at 90°C. then was cooled and 3 drops of phenolphthalein were added to it. With 6 moL/mL hydrochloric acid solution to red just fade, the solution was transferred to a 100 mL volumetric flask with anhydrous ethanol to constant volume scale. Precisely transferred 4 mL to a 25 mL volumetric flask from the above extracted solution and added methanol to scale. Subsequently, centrifuged at 10,000 rpm for 10 min. The upper liquid phase was analyzed by liquid chromatography.
The Agilent 1200 HPLC system equipped with Chemstation Software (Agilent Technologies, USA) and comprised of a quaternary pump (G1322A), an online vacuum degasser, an autosampler (G1367B), a thermostated column compartment (G1316A) and an ultraviolet detector (G1365D) was used for quantifying linoleic and oleic acids in peach kernel. The mobile phases consisted of acetonitrile (A) and 0.1% phosphoric acid in distilled water (B). The column was eluted at 1.0 mL/min under a isocratic elution A:B (92:8). All separations were carried out on a Waters-Symmetry-RP-C18 × 250 × 4.6 mm, 5 μm) from Dalian Sipore Co., Ltd (Dalian, China). The flow rate was 1.0 mL/min. The column temperature was maintained at 30°C. The chromatograms were recorded at 205 nm. Sample injection volumes were 10 μL. Standards of linoleic and oleic acids (the Control of Pharmaceutical and Biological Products, Beijing, China) were injected for identification and quantitative analysis.
Data pretreatment and analysis
The spectra recorded at different positions of each sample used for qualitative and quantitative analysis were averaged before further analyses. NIRS data were combined with the data of the reference analysis. For the classification of peach kernel from different varieties, PCA was applied. For the quantification of linoleic and oleic acid contents, PLSR was adopted. All the obtained spectra pretreatment and chemometrics analysis algorithms were implemented using the SNAP32 software (Brimrose Corporation of America). The averaged sample spectra were preprocessed with the Savitzky-Golay (SG) derivative followed by 1st derivative employing 9 smoothing points. Subsequently, PCA and PLS calibration models were generated with the Unscrambler (Camo, USA).
All calibrations were validated using the LOO cross-validation to determine the optimal number of factors to be included in the calibration model. Calibration accuracy was defined in terms of the multiple coefficient of determination (R2), that measures the linearity between the modeled and reference values (HPLC), and the variance (V), that measures the overall error between modeled and reference values, expressed as the root mean square error of deviation (RMSED). Values ranging from 0% to 5% are considered excellent and acceptable for any NIR application, while values >5% are considered unsuitable for NIR analysis.[20]
RESULTS
Chromatographic studies of peach kernel by HPLC
All the peach kernel samples including P. persicae semen (L.) Batsch and P. davidiana (Carr.) Franch from nine different growth places of China were determined with the HPLC method. Figure 2 shows characteristic chromatograms of the mixed standards and sample extract solution. It could be seen that the two target compounds were baseline separated, so that they could be quantitatively determined accurately. Before the sample testing, the HPLC method was validated. Due to research priority in this research was the NIR method, a detailed description of the HPLC method was omitted here, but the main parameters of the HPLC method are listed in Table 2.
Figure 2.
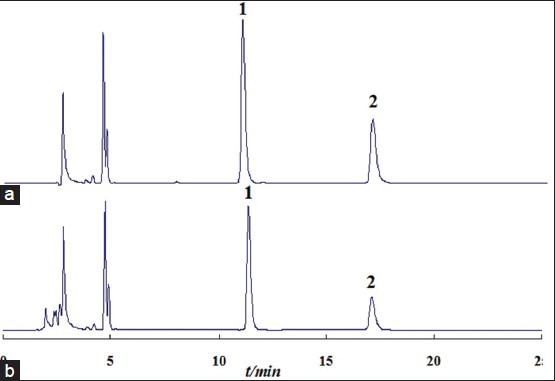
Characteristic chromatograms of the mixed standards (a) and sample extract solution (b). (1. Linoleic acid; 2. Oleic acid)
Table 2.
The methodology parameters and the calibration curves of the reference method (HPLC)

Effect of powder sample's granularity on DR-NIR spectra
In diffuse reflectance near-infrared spectroscopy (DR-NIR) spectroscopy, the granularity of powder samples is an important parameter for spectral measurement.[21] Powder samples of peach kernel with different granularities of 10, 20 and 45 meshes were measured three times, respectively, to record DR-NIR spectra [Figure 3].
Figure 3.
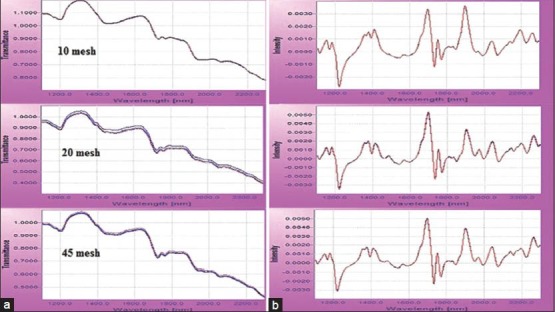
Original (a) and pretreated (b) DR-NIR spectra of different granularities
Classification of the peach kernel with PCA
PCA was performed on the full-spectrum data to calibrate and verify the separation of the different peach kernel varieties.[22] The obtained spectra were pretreated with Savitzky–Golay filter, and 1nd derivative, which was selected according to the predictive power of the established models. The PCA was performed and the suitable principal component (PC) scores and leverage values were used to evaluate for setting different samples models. The scores plot of PC1–PC2 displayed the models of P. persicae semen (L.) Batsch and P. davidiana (Carr.) Franch from different varieties and origins [Figure 4].
Figure 4.
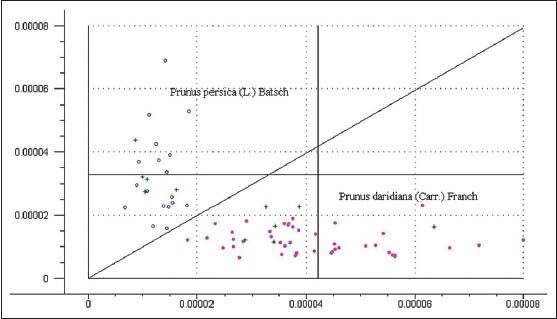
PCA result of DR-NIR spectra of different varieties of peach kernel
Optimum number of components.
A calibration and quantitative analysis was performed using PCR and PLS methods. 61 samples were used to develop the calibration and 11 independent samples were used as a prediction set for both methods. Figure 5 was optimum PC numbers for linoleic and oleic acids calibration models.
Figure 5.
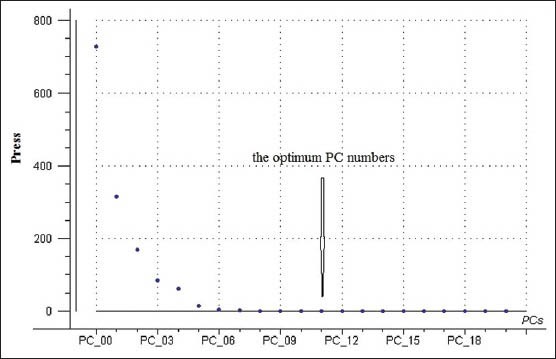
The optimization procedure for linoleic and oleic acids calibration models
Comparison of different regression method
To establish calibration models with high performance of fitting and predicting, two regression methods, namely PCR and PLSR, were compared to select the best one. Take the oleic acid for example, under the optimal conditions, both PCR and PLSR models shown, in this study, had very good correlation between the real and predicted concentrations with coefficient of determination (R2) values equal to 0.9964 and 0.9985, respectively. And the RMSED value (2.2486 for PCR and 1.4123 for PLSR) for each model was minimum.
Model building using pre-processed data
After the spectra pretreated method and the most suitable latent variables numbers were selected, two calibration models for the quantitative analysis of the peach kernel samples were established. Only one sample (T65) was eliminated from the calibration. The correlation chart of the actual content and the predicted content and the residuals plot were shown in Figure 6.
Figure 6.
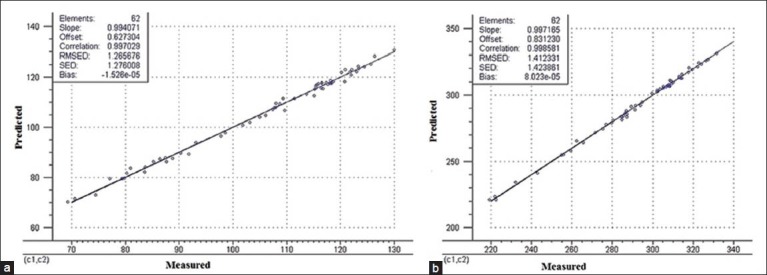
Reference analyses versus NIRS estimations for linoleic (a) and oleic acid (b) contents of peach kernel
Prediction/validation by the models
Spectra of the 11 validation samples which had been pretreated as calibration set were substituted into the calibration model.
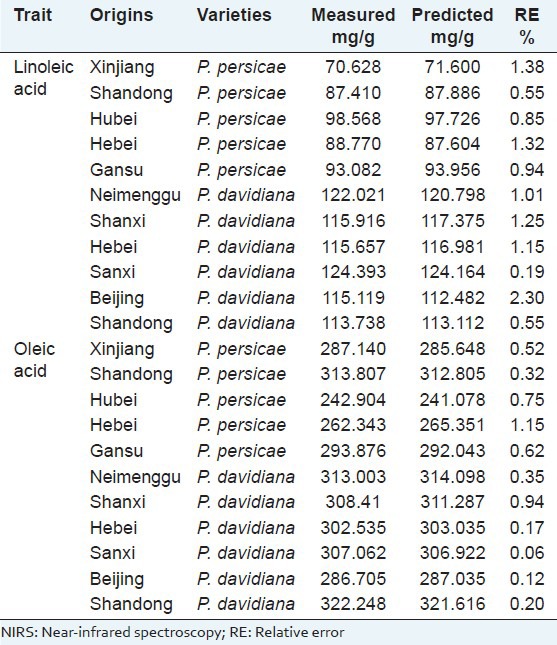
And the predicted results were compared with the HPLC results. The statistics of results obtained from the calibration models is shown in Table 3.
Table 3.
Reference analyses of the sample sets and NIRS calibration for linoleic and oleic acids content
DISCUSSION
The accuracy of the HPLC analysis is highly dependent on the concentration of the component in the sample, and the accuracy in the reference analysis is essential to setting up efficient NIR calibrations.[23] From the determined results, it could be found that the reference analyses of 72 samples of linoleic and oleic acids content varied from 13.0% to 6.9% and 21.9% to 33.1%, respectively. The sample set was a high variation in oil content. But there was no remarkable difference in the contents of linoleic and oleic acids between the P. persicae semen (L.) Batsch and P. davidiana (Carr.) Franch.
From Figure 3 one could easily observe the little difference of spectra between samples. The spectra of samples with different granularities weren’t deviated from others, but moving block of standard deviation (MBSD) were 2.65 × 10⁻⁶, 1.45 × 10⁻⁵, 8.96 × 10⁻⁶, respectively. MBSD of 10 meshes was the least. So, in the following study, all the samples were prepared with the same granularity (10 meshes) to eliminate the effect of granularity on spectral measurement and more precise diffuse reflectance spectra could be easily recorded.
Figure 4 revealed that each peach kernel variety formed a well-defined cluster. There was an obvious boundary between P. persicae semen (L.) Batsch and P. davidiana (Carr.) Franch. P. persicae semen (L.) Batsch clustering was formed on the left-hand side, and there was not overlapping between both models. On the other hand, P. davidiana (Carr.) Franch clustering was situated on the right-hand side. So the different peach kernel samples were displayed as two classes clearly. The P. persicae semen (L.) Batsch samples distributed concentratedly because of spectral information similarity, which indicates that they may have different features with P. davidiana (Carr.) Franch. Meanwhile the 11 samples of validation set were all correctly classified by the models of P. persicae semen (L.) Batsch (5 samples) and P. Davidiana (Carr.) Franch (6 samples), respectively.
Whether the establishment of PCR model or PLS model, both should have an optimum PC numbers. If the PC numbers used in the calibration is more or less than the optimum one, the case of ‘overfitting’ or ‘underfitting’ will appear, which mean the established models may have poor performance. Generally, the leave-one-out (LOO) cross-validation was used to determine the optimum PC numbers to be included in the calibration model. The relation diagrams of PRESS values and PC numbers were used to observe whether the PC numbers come to the best one. Along with the PC numbers increasing, the PRESS value decreased sharply. When the PC numbers reached the best, the curve is tending toward stability. Furthermore, if the PC numbers exceed the optimum one, the PRESS value will remain practically unchanged or increase [Figure 5].[24]
The correlation coefficient (R2) is the intensity measure of the correlation between the measured values and the values predicted by the model. This may range from 0 to +1. The closer the value to +1, the higher the correlation between the data.[25] The lower RMSED value had a higher degree of accuracy of prediction by the model.[26] Both PCR and PLSR gave almost the same R2 value. On the closest examination of the scores plot, RMSED and R2 values, the PLSR model was found to be the best.
Generally, lower RMSED and higher corresponding correlation coefficients (R2) are used for evaluating an NIR calibration model.[27] From Figure 6, both the correlation coefficients of linoleic and oleic acids were 0.9970 and 0.9985, respectively. and the variance (RMSED) between the model and reference values for linoleic and oleic acid were low (V < 5%).[28] The presented work obtained higher correlation coefficients in both the calibration set and the prediction set, which indicated that the established models were able to predict with high accuracy the relative percentage of linoleic and oleic acids components constituting over 80% of the total peach kernel oil.
The RE%, calculated with equation RE% =  was used for evaluating the predicted results.[29] The average RE% of the predicted results for linoleic and oleic acids were both less than 5%. The results showed that the established calibration model were able to predict accurately linoleic and oleic acids in the peach kernel. The paired t-test between the predicted values and the actual values was done, with the P > 0.05, which indicated that there was no significant difference between the NIR method and the HPLC method.[30] This once again proved that the established models could be used for quantitative analysis of the peach kernel. Coupled with HPLC, as the reference technique, NIR technology is a very fast and reliable method. With the added value of NIR to identify peach kernel varieties and the possible detection of peach kernel oil, for the future NIR spectroscopy becomes a very promising and powerful technique in the field of research and quality control of peach kernel.
CONCLUSION
Based on the above findings, we obtained NIR spectroscopy through chemometrics as a detection tool for quantitative as well as qualitative analysis of peach kernel only requires minimum sample treatments consisting of drying and cutting procedures. The overall results showed the feasibility of NIRS to be applied in the TCM pharmaceutical enterprises for the quality control of the peach kernel, and can also be consulted to solve varietal problems. To make the models more robust, more representative samples should be added into the calibration sets, which can be viewed as the updating of the calibration models. Therefore, the presented method is extensible, by which it can be used in the long term with more accurate results.
ACKNOWLEDGMENTS
We are extremely grateful to the financial support of the Major national “creation of major new drugs” special science and technology (2009ZX09504-004).
Footnotes
Source of Support: Nil
Conflict of Interest: None declared.
REFERENCES
- 1.Mezzomo N, Mileo BR, Friedrich MT, Martínez J, Ferreira SR. Supercritical fluid extraction of peach (Prunus persica) almond oil: Process yield and extract composition. Bioresour Technol. 2010;101:5622–32. doi: 10.1016/j.biortech.2010.02.020. [DOI] [PubMed] [Google Scholar]
- 2.Tu Z, Han X, Wang X, Hou Y, Shao B, Wang X, et al. Protective effects of CVPM on vascular endothelium in rats fed cholesterol diet. Clin Chim Acta. 2003;333:85–90. doi: 10.1016/s0009-8981(03)00201-8. [DOI] [PubMed] [Google Scholar]
- 3.Wu H, Shi J, Xue S, Kakuda Y, Wang DF, Jiang YM. Essential oil extracted from peach (Prunus persica) kernel and its physicochemical and antioxidant properties. LWT-Food Sci Technol. 2011;44:2032–9. [Google Scholar]
- 4.Rahma EH, Elaall MH. Chemical characterization of peach kernel oil and protein-functional-properties, invitro digestibility and amino-acids profile of the flour. Food Chem. 1988;28:31–43. [Google Scholar]
- 5.Zhao X, Wang H, You J, Suo Y. Determination of free fatty acids in bryophyte plants and soil by HPLC with fluorescence detection and identification by online MS. Chromatographia. 2007;66:197–206. doi: 10.1016/j.jchromb.2006.10.025. [DOI] [PubMed] [Google Scholar]
- 6.Eduardo LH. Health effects of oleic acid and long chain omega-3 fatty acids (EPA and DHA) enriched milks. A review of intervention studies. Pharmacol Res. 2010;61:200–7. doi: 10.1016/j.phrs.2009.10.007. [DOI] [PubMed] [Google Scholar]
- 7.Djeridane A, Yousfi M, Nadjemi B, Boutassouna D, Stocker P, Vidal N. Antioxidant activity of some algerian medicinal plants extracts containing phenolic compounds. Food Chem. 2006;97:654–60. [Google Scholar]
- 8.Abdulkarim SM, Long K, Lai OM, Muhammad SK, Ghazali HM. Frying quality and stability of high-oleic Moringa oleifera seed oil in comparison with other vegetable oils. Food Chem. 2007;105:1382–9. [Google Scholar]
- 9.Londoño P, Alberto MP, Carlos E, Hernández Extraction and characterization of crude oil of peach kernel. Av Cien Ing. 2012;3:37–46. [Google Scholar]
- 10.Matthaus B, Bruhl L. Comparison of different methods for the determination of the oil content in oilseeds. J Am Oil Chem Soc. 2001;78:95–102. [Google Scholar]
- 11.Khajeamiri AR. Preparation of solid phase microextraction (SPME) probes through polyaniline multiwalled carbon nanotubes (PANI/MWCNTs) coating for the extraction of palmitic acid and oleic acid in organic solvents. Iran J Pharm Res. 2012;11:369–74. [PMC free article] [PubMed] [Google Scholar]
- 12.Guo PL, Huang QL, Zhang PX, Bittner L, Pezzei C, Pallua J, et al. Application of near-infrared spectroscopy (NIRS) as a tool for quality control in traditional chinese medicine (TCM) Curr Bioact Compd. 2011;7:75–84. [Google Scholar]
- 13.Pastore TC, Braga JW, Coradin VT, Magalhaes WL, Okino EY, Camargos JA, et al. Near infrared spectroscopy (NIRS) as a potential tool for monitoring trade of similar woods: Discrimination of true mahogany, cedar, andiroba, and curupixa. Holzforschung. 2011;65:73–80. [Google Scholar]
- 14.Liu YD, Sun XD, Ouyang AG. Nondestructive measurement of soluble solid content of navel orange fruit by visible–NIR spectrometric technique with PLSR and PCA-BPNN. Food Sci Technol Res. 2010;43:602–7. [Google Scholar]
- 15.Chan CO, Chu CC, Mok DK, Chaun FT. Analysis of berberine and total alkaloid content in Cortex Phellodendri by near infrared spectroscopy (NIRS) compared with high-performance liquid chromatography coupled with ultra visible spectrometric detection. Anal Chim Acta. 2007;592:121–31. doi: 10.1016/j.aca.2007.04.016. [DOI] [PubMed] [Google Scholar]
- 16.Gislum R, Micklander E, Nielsen JP. Quantification of nitrogen concentration in perennial ryegrass and red fescue using near-infrared reflectance spectroscopy (NIRS) and chemometrics. Field Crops Res. 2004;88:269–77. [Google Scholar]
- 17.Mohri Y, Sakata Y, Otsuka M. Quantitative evaluation of glycyrrhizic acid that affects the product quality of Kakkonto extract, a traditional herbal medicine, by a chemometric near infrared spectroscopic method. J Near Infrared Spectrosc. 2009;17:89–100. [Google Scholar]
- 18.Font R, del Río-Celestino M, Cartea E, de Haro-Bailón A. Quantification of glucosinolates in leaves of leaf rape (Brassica napus ssp. pabularia) by near-infrared spectroscopy. Phytochemistry. 2005;66:175–85. doi: 10.1016/j.phytochem.2004.11.011. [DOI] [PubMed] [Google Scholar]
- 19.Wu YH, Zheng Y, Li QQ, Iqbal J, Zhang LY, Zhang WB, et al. Study on difference between epidermis, phloem and xylem of Radix Ginseng with near-infrared and infrared spectroscopy coupled with principal component analysis. Vib Spectrosc. 2011;55:201–6. [Google Scholar]
- 20.Li WL, Xing LH, Cai Y, Qu HB. Classification and quantification analysis of Radix scutellariae from different origins with near infrared diffuse reflection spectroscopy. Vib Spectrosc. 2011;55:58–64. [Google Scholar]
- 21.Wu D, Nie PC, Cuello J, He Y, Wang ZP, Wu HX. Application of visible and near infrared spectroscopy for rapid and non-invasive quantification of common adulterants in Spirulina powder. J Food Eng. 2011;102:278–86. [Google Scholar]
- 22.Juliani HR, Kapteyn J, Jones D, Koroch AR, Wang M, Charles D, et al. Application of near-infrared spectroscopy in quality control and determination of adulteration of African essential oils. Phytochem Anal. 2006;17:121–8. doi: 10.1002/pca.895. [DOI] [PubMed] [Google Scholar]
- 23.Williams P. Variables affecting near-infrared reflectance spectroscopy analysis. Near. Infrared Technology in the Agricultural and Food Industries. In: Williams P, Norris K, editors. St Paul: American Association of Cereal Chemists, Inc; 1987. pp. 143–67. [Google Scholar]
- 24.Kuriakose S, Thankappan X, Joe H, Venkataraman V. Detection and quantification of adulteration in sandalwood oil through near infrared spectroscopy. Analyst. 2010;135:2676–81. doi: 10.1039/c0an00261e. [DOI] [PubMed] [Google Scholar]
- 25.Cámara-Martos F, Zurera-Cosano G, Moreno-Rojas R, Rosa M, García-Gimeno, Pérez-Rodríguez F. Identification and quantification of lactic acid bacteria in a water-based matrix with near-infrared spectroscopy and multivariate regression modeling. Food Anal Methods. 2012;5:19–28. [Google Scholar]
- 26.Liew CV, Karande AD, Heng PW. In-line quantification of drug and excipients in cohesive powder blends by near infrared spectroscopy. Int J Pharm. 2010;386:138–48. doi: 10.1016/j.ijpharm.2009.11.011. [DOI] [PubMed] [Google Scholar]
- 27.Mattle C, Heigl N, Abel G, Bonn GK, Huck CW. Near-infrared diffuse reflection spectroscopy and multivariate calibration hyphenated with thin-layer chromatography for quality control of a phytomedicine and simultaneous quantification of methoxylated flavones. J Planar Chroma. 2010;5:348–52. [Google Scholar]
- 28.Chen XJ, Wu D, He Y, Liu S. Nondestructive differentiation of panax species using visible and shortwave near-infrared spectroscopy. Food Bioprocess Technol. 2011;4:753–61. [Google Scholar]
- 29.Li WL, Cheng ZW, Wang YF, Qu HB. A study on the use of near-infrared spectroscopy for the rapid quantification of major compounds in Tanreqing injection. Spectrochim Acta A. 2013;101:1–7. doi: 10.1016/j.saa.2012.09.044. [DOI] [PubMed] [Google Scholar]
- 30.Zhao X, Wang H, You J, Suo Y. Determination of free fatty acids in bryophyte plants and soil by HPLC with fluorescence detection and identification by online MS. Chromatographia. 2007;66:197–206. doi: 10.1016/j.jchromb.2006.10.025. [DOI] [PubMed] [Google Scholar]


