Abstract
Aims
This study aimed to describe lamivudine pharmacokinetics in patients with impaired renal function and to evaluate the consistency of current dosing recommendations.
Methods
A total of 244 patients, ranging in age from 18 to 79 years (median 40 years) and in bodyweight from 38 to 117 kg (median 71 kg), with 344 lamivudine plasma concentrations, were analysed using a population pharmacokinetic analysis. Serum creatinine clearance (CLCR) was calculated using the Cockcroft–Gault formula; 177 patients had normal renal function (CLCR > 90 ml min−1), 50 patients had mild renal impairment (CLCR = 60–90 ml min−1), 20 patients had moderate renal impairment (CLCR = 30–60 ml min−1), and five patients had severe renal impairment (CLCR < 30 ml min−1).
Results
A two-compartment model adequately described the data. Typical population estimates (percentage interindividual variability) of the apparent clearance (CL/F), central (Vc/F) and peripheral volumes of distribution (Vp/F), intercompartmental clearance (Q/F) and absorption rate constant (Ka) were 29.7 l h−1 (32%), 68.2 l, 114 l, 10.1 l h−1 (85%) and 1 h−1, respectively. Clearance increased significantly and gradually with CLCR. Our simulations showed that a dose of 300 mg day−1 in patients with mild renal impairment could overexpose them. A dose of 200 mg day−1 maintained an exposure close to that of adults with normal renal function. However, the current US Food and Drug Administration recommendations for lamivudine in other categories of patients (from severe to moderate renal impairment) provided optimal exposures.
Conclusions
Lamivudine elimination clearance is related to renal function. To provide optimal exposure, patients with mild renal impairment should receive 200 mg day−1 instead of 300 mg day−1.
Keywords: human immunodeficiency virus, lamivudine, population pharmacokinetics, renal impairment
What is Already Known about this Subject
Lamivudine pharmacokinetics has been well studied in adult patients.
No evaluation of current dosing recommendations in patients with impaired renal function exists.
What this Study Adds
This lamivudine population analysis in HIV-1-infected patients provides useful insights into the fate of this drug, especially into lamivudine pharmacokinetics in patients with impaired renal function.
Moreover, this study addresses concerns about potential supratherapeutic lamivudine concentrations in patients with mild renal impairment.
Introduction
Lamivudine (3TC) is a potent nucleoside analogue reverse transcriptase inhibitor (NRTI). Following an oral dose, lamivudine is rapidly absorbed and has a wide distribution owing to its relatively low molecular weight (229 Da) and low plasma protein binding (<36%). The majority of lamivudine (∼70%) is eliminated unchanged in the urine over 24 h 1. Approximately 5–10% is metabolized to the pharmacologically inactive trans-sulfoxide metabolite, the majority of which is also excreted in the urine within 12 h after a single oral dose 1.
Lamivudine is widely used for treatment of human immunodeficiency virus type 1 (HIV-1) infection in patients with a very large age range. Although the pharmacokinetics is quite well described in adults, limited studies are available about the effects of renal function on lamivudine pharmacokinetics and their consequences for patient exposure 2,3. Lamivudine concentrations are known to be increased in patients with moderate to severe renal impairment due to decreased clearance. Lactic acidosis induces a high mortality and has been reported as a serious lamivudine adverse event. Patients with renal impairment are particularly at risk. Thus, to avoid risk of toxicities, both the US Food and Drug Administration (FDA) and the European Medicines Agency suggest that the dose should be adjusted for patients whose creatinine clearance (CLCR) falls below 50 ml min−1. For patients with creatinine clearance of <5 ml min−1, the dose is 25 mg day−1; 50 mg day−1 from 5 to 15 ml ml−1; 100 mg day−1 from 15 to 30 ml min−1; 150 mg day−1 from 30 to 50 ml min−1; and the standard dose of 300 mg day−1 for patients with creatinine clearance of >50 ml min−1. Lamivudine pharmacokinetics in moderate and severe renal impairment has been described in two previous studies 2,3; however, the low number of patients enrolled and the methodology applied did not lead them to provide dosing adjustment in renal function-impaired patients.
Our study is the first population pharmacokinetic analysis involving patients with severe to mild renal impairment. We have developed a population model for lamivudine in a large group of adult patients with different degrees of renal function impairment in order to determine the relationship between lamivudine pharmacokinetics and renal function and to investigate the consistency of the currently recommended dosage regimen.
Methods
Patients and treatment
We retrospectively analysed all the medical files of HIV-1-infected adults, older than 18 years of age, who received 3TC as NRTI backbone between April 2007 and April 2012. The population was monitored on a routine basis and comprised 244 patients, ranging in age from 18 to 79 years (median 40 years) and in bodyweight from 38 to 117 kg (median 71 kg). The median lamivudine dose was 300 mg day−1. Serum creatinine clearance was calculated using the Cockcroft-Gault formula. Samples were obtained on different occasions, at each patient visit.
Analytical method
Lamivudine was measured in a 100 μl plasma sample by high-performance liquid chromatography. An internal standard was used. Lamivudine was extracted by solid-phase extraction on Bond Elut C 18, and separated on a Satisfaction C8 Plus column (250 mm × 3 mm) with gradients of solvent A (water with 0.01% trifluoroacetic acid, 2% methanol and 3% acetonitrile) and solvent B (acetonitrile) as follows: 50% solvant A and 50% solvent B for 30 min, 90% solvant A and 10% solvent B for 30 min, and 98% solvant A and 2% solvent B for 30 min. Ultraviolet absorbance at 270 nm was used for detection of 3TC. The limit of quantification was 0.02 mg l−1. Mean interassay precision for the low quantity controls was 10%, and the inaccuracy at the limit of quantification was 4.5%. Overall recovery was 65%.
Modelling strategy and population pharmacokinetic model
Data were analysed using the nonlinear mixed-effect modelling software program Monolix version 4.1.3 4. Parameters were estimated by computing the maximum likelihood estimator of the parameters without any approximation of the model (no linearization) using the stochastic approximation expectation maximization (SAEM) algorithm combined with a MCMC (Markov Chain Monte Carlo) procedure. The number of MCMC chains was fixed to 10 for all estimations. A proportional model was used to describe the residual variability (ε), and the between-subject variabilities (BSV or η) were ascribed to an exponential model. Parameter shrinkage was calculated as [1 − SD(η)/ω], where SD(η) and ω are the standard deviation of individual ε parameters and the population model estimate of the BSV, respectively 5. The likelihood ratio test, (LRT) including the log-likelihood, the Akaike information criterion (AIC) and the Bayesian information criterion (BIC), was used to test different hypotheses regarding the final model, covariate effect(s) on pharmacokinetic parameter(s), residual variability model (proportional vs. proportional plus additive error model) and structure of the variance–covariance matrix for the BSV parameters. The effect of each patient covariate (age, bodyweight, sex, creatinine clearance) was systematically tested via generalized additive modelling on the basic model. All the covariates were tested via an upward model building. A covariate was selected if it met the following criteria: (i) its effect was biologically plausible; (ii) it produced a minimum decrease of 6.63 units (χ2, 1 d.f., P < 0.01) in the objective function value; and (iii) it produced a reduction in the variability of the pharmacokinetic parameter, assessed by the associated intersubject variability. Among the covariates tested on the base model, the most significant was added in an intermediate model. Then the other covariates were tested on this intermediate model and the most significant covariate was retained. This process was repeated until no more covariates were significant (i.e. P > 0.01).
For evaluation of the goodness of fit, the following graphs were drawn for the final model: observed and predicted concentrations vs. time; observed concentrations vs. population predictions; weighted residuals vs. time; and weighted residuals vs. predictions. Similar graphs using individual predictive estimation were examined. Diagnostic graphics were obtained using the R program 6.
Visual predictive check validation
Lamivudine concentration profiles were simulated and compared with the observed data to evaluate the predictive performance of the model. The vector of pharmacokinetic parameters was simulated using the final model. Each vector parameter was drawn in a log-normal distribution with a variance corresponding to the BSV previously estimated. A simulated residual error was added to each simulated concentration. The 5th, 50th and 95th percentiles of the simulated concentrations at each time were then overlaid on the observed concentration data, and a visual inspection was performed.
Simulations of doses
The theoretical dose needed to reach the 24 h-exposure range observed in adults from previous studies (from 8.9 to 16.6 mg h−1 l−1) 7,8 as a function of creatinine clearance was calculated from the final model. Current recommendations were checked across the range of creatinine clearances.
Optimal doses were then derived in renal function-impaired patients and simulated using Monte Carlo simulations. The values for area under the curve over 24 h (AUC0–24h) obtained in patients with renal dysfunction were compared with those for AUC0–24h in patients with normal renal function following administration of a standard dose of 300 mg of lamivudine.
Results
Demographic data
A total of 244 patients and 344 plasma concentrations were available for pharmacokinetic evaluation. Lamivudine concentrations were monitored on between one and 10 occasions (mean 1.6 per patient), between 0.5 and 28 h after dosing at steady state, in all patients. Median (range) serum creatinine and creatinine clearance (CLCR) were 67 (28–1097) μmol l−1 and 109.8 (7–318) ml min−1, respectively. According to the FDA classification 9, 177 patients had normal renal function (CLCR > 90 ml min−1), 50 patients had mild renal impairment (CLCR = 60–90 ml min−1), 20 patients had moderate renal impairment (CLCR = 30–60 ml min−1), and five patients had severe renal impairment (CLCR < 30 ml min−1). Depending on the duration of follow-up, the same patient could switch from one category to another. Table 1 summarizes patients' characteristics.
Table 1.
Characteristics of the 244 HIV-1-infected patients enrolled in the study
| Variables | |
|---|---|
| n (%) | |
| Male gender | 86 (35%) |
| Viral load (<50 copies ml−1) | 120 of 169 (71%) |
| Median (IQR) | |
|---|---|
| Age (years) | 40.2 (33.5–48.5) |
| Weight (kg) | 71 (64.5–78) |
| Creatinine (μmol l−1) | 67 (53–87) |
| Creatinine clearance (ml min−1) | 109.8 (78–148) |
| CD4+ lymphocytes at baseline (%) | 458 (300–624) |
| Venous lactate levels | 0.80 (1.00–1.45) |
Abbreviation is as follows: IQR, interquartile range.
Population pharmacokinetics
A two-compartment model adequately described the data (Figure 1), thus the apparent parameters of the model were the clearance (CL/F), central volume of distribution (Vc/F), peripheral volume of distribution (Vp/F), intercompartmental clearance (Q/F) and absorption rate constant (Ka); F is the unknown bioavailability. Residual variability was best described by a proportional error model. Intersubject variability was described by an exponential error model and retained only for the elimination and intercompartmental clearances. The correlation between these two parameters was significant. The most significant decrease in objective function value was obtained with CLCR, calculated by the Cockroft–Gault formula for each patient. This resulted in a 38 unit decrease in the objective function value (P < 10−4), and improved the goodness of fit. It is worth noting that both CLCR and age produced a similar decrease in the objective function value, but CLCR led to a larger decrease in BSV on CL (10 vs. 18%). After inclusion of CLCR in the model, the addition of other covariates did not improve the model any further.
Figure 1.
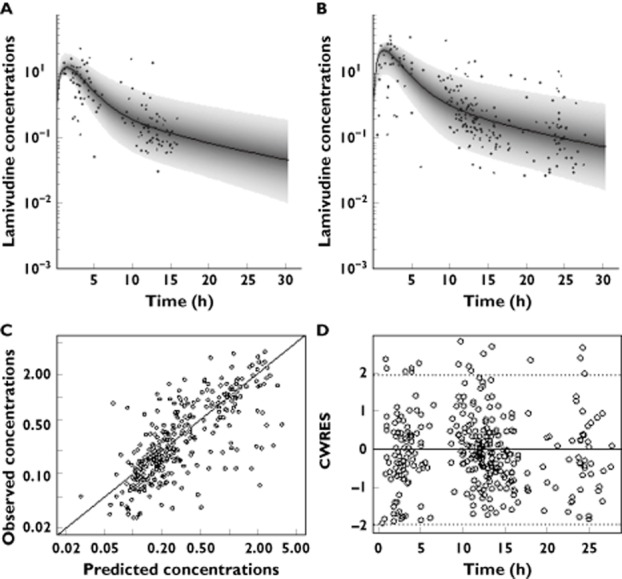
Prediction distribution from the model (median associated with 95% prediction interval) for twice daily (A) and once daily dosing regimen (B). Diagnostic plots of the final model: observed vs. predicted concentrations (C) and conditional weighted residuals (CWRES) vs. time (D)
Thus, the final covariate model for CL/F was as follows:
According to the model, the value of θCL was 29.8 l h−1, corresponding to the maximal lamivudine clearance. Figure 2 displays the variation of clearance (in litres per hour) as a function of creatinine clearance (in millilitres per minute).
Figure 2.
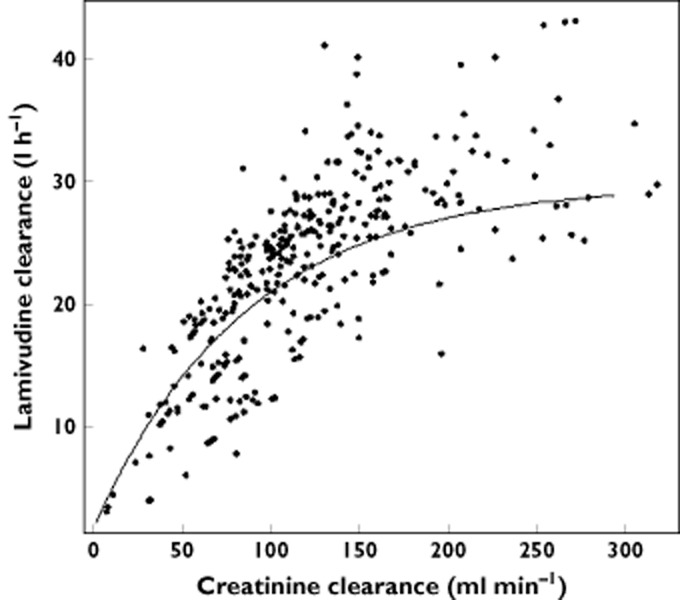
Apparent elimination clearance (expressed in litres per hour) as a function of creatinine clearance (in millilitres per minute). The line represents the equation defined by the model
Table 2 summarizes the final population pharmacokinetic estimates. All the parameters were well estimated, given their relative standard error (RSE%). The ω-shrinkages for CL/F and Q/F were 0.13 and 0.62, respectively, indicating that only the empirical Bayesian estimates of individual clearances are reliable. However, doses were simulated in order to achieve a target AUC, and the estimation of individual AUC is based only on individual clearance.
Table 2.
Population pharmacokinetic parameters of lamivudine in 244 HIV-1-infected patients
| Parameters | Mean | RSE (%) |
|---|---|---|
| Structural model | ||
| Ka (h−1) | 1 | 47 |
| CL/F (l h−1) | 29.7 | 9 |
| Vc/F (l) | 68.2 | 30 |
| Q/F (l h−1) | 10.1 | 27 |
| Vp/F (l) | 114 | 15 |
| CLCR50 (ml min−1) | 52.7 | 16 |
| r(CL,Q) | 0.57 | 33 |
| Statistical model | ||
| ωCL/F | 0.32 | 16 |
| ωQ/F | 0.85 | 49 |
| σ | 0.48 | 7 |
Abbreviations are as follows: CLCR50, creatinine clearance to reach half of maximal CL/F; CL/F, typical value of apparent elimination clearance; Ka, absorption rate constant; Q/F, typical value of intercompartmental clearance; r(CL,Q), covariance between CL/F and Q/F variabilities; RSE%, relative standard error (standard error of estimate/estimate × 100); Vc/F, typical value of apparent central volume of distribution; Vp/F, typical value of apparent peripheral volume of distribution; σ, residual variability estimates; ω, interindividual variability estimates.
Evaluation and validation
Figure 3 (visual predictive check) shows that the average prediction matches the observed concentration time courses and that the variability is reasonably estimated. The 5th, 50th and 95th percentiles of observed data were within the confidence interval of the 5th, 50th and 95th percentiles simulated from the model.
Figure 3.
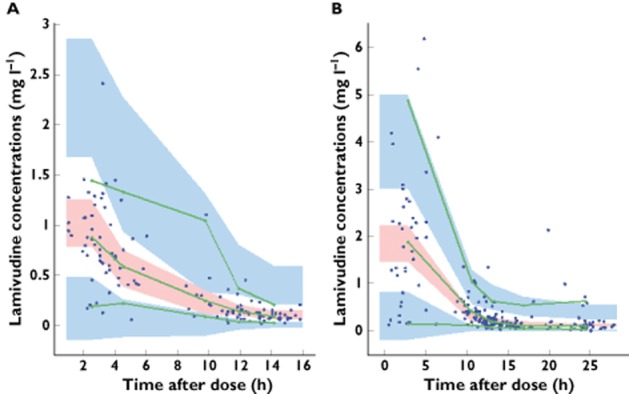
Evaluation of the final model: comparison between confidence interval of the 5th, 50th and 95th simulated percentiles (areas) and the observed 5th, 50th and 95th percentiles (lines); filled circles correspond to the observed data for lamivudine concentrations for twice daily (A) and once daily dosing regimen (B)
Simulations of doses
Figure 4 displays the theoretical dose needed to reach the range of 24 h exposure observed in previous adult studies (from 8.9 to 16.6 mg h−1 l−1) 7,8 as a function of creatinine clearance according to our model. The FDA dosing recommendations provided optimal exposure across all creatinine clearance values except for patients with mild renal impairment (from 50 to 80 ml min−1), who could be overexposed. A dosage of 200 mg day−1 in this category of patients should be a better option for safety and efficacy.
Figure 4.
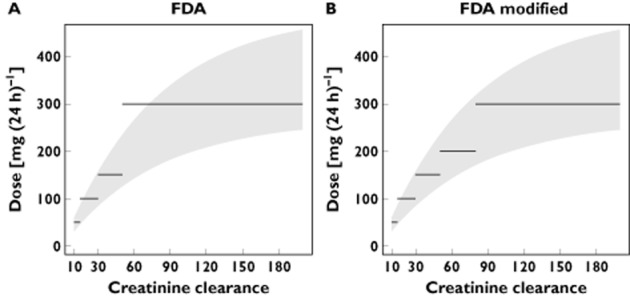
Grey shading represents the doses of lamivudine (in milligrams per day) needed to reach the range for AUC0–24h observed in adults (from 8.9 to 16.6 mg h−1 l−1) as a function of creatinine clearance (in millilitres per minute). The lines represent FDA dosing recommendations (A) and dosing recommendations derived from the present study (B).  , optimal exposure
Figure 5 displays the simulated AUC0–24h obtained with the current dosing recommendations and with our proposition in patients with mild renal impairment. These exposures have been compared with patients having normal renal function and receiving the standard dose of 300 mg day−1. The dose of 300 mg day−1 given to patients with creatinine clearance of 50–80 ml min−1 resulted in higher exposures than those of patients with normal renal function; however, the dose of 200 mg day−1 provided equivalent exposure between the two groups.
Figure 5.
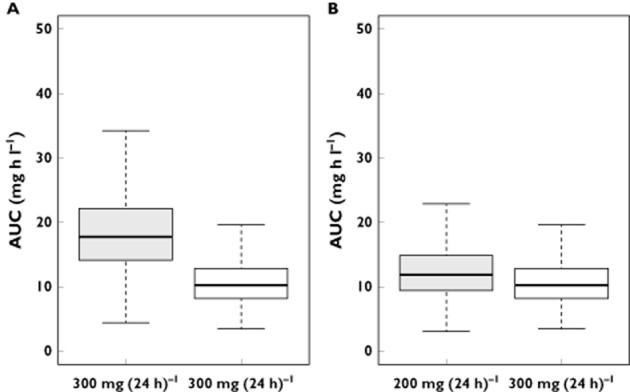
(A) Box plots of AUC0–24h derived from Monte Carlo simulations of 300 mg day−1 in patients with creatinine clearance from 50 to 80 ml min−1 (mild renal impairment) and in patients with normal renal function. (B) Box plots of AUC0–24h derived from simulations of 200 mg day−1 in patients with mild renal impairment and of 300 mg day−1 in patients with normal renal function.  , creatinine clearance 50–80 ml min−1; □, normal creatinine clearance
Discussion
This paper describes lamivudine pharmacokinetics in 244 adults aged between 18 and 79 years. Lamivudine concentrations were satisfactorily described by a two-compartment model. Lamivudine freely penetrates tissue beyond the systemic circulation and is able to distribute through a peripheral compartment 3,10. The apparent elimination clearance and AUC0–24h were consistent with previous studies 11–13.
The population model was also used to investigate the effect of renal function on pharmacokinetic parameters. In our model, an effect of creatinine clearance (Cockcroft–Gault formula) on elimination clearance was observed. According to this model, clearance increases gradually as a function of creatinine clearance. This relationship between lamivudine clearance and renal function was supported by the study of Heald et al. 2, which demonstrated the linear correlation between CLCR and oral clearance as well as the overexposure due to impaired renal function. This is also in agreement with Johnson et al. 3, who showed that dose modifications are needed according to the degree of renal impairment to avoid risk of high exposure. Moore et al. 12 have also reported an effect of creatinine clearance in a population modelling approach; however, only three patients had creatinine clearance lower than 60 ml min−1, and no dosage adjustments were derived. A linear correlation was first tested according to Heald et al. 2, but a model misspecification was noticed especially for the highest CLCR values, suggesting that a function with a plateau would be more appropriate. It is worth noting that in the study of Heald et al. 2, patients had CLCR values lower than 150 ml min−1, thus the nonlinear relationship between lamivudine clearance and CLCR could not be shown. However, we may notice that the function used in the model may slightly underestimate the clearance for the severe renal impairment group, probably due to the low number of patients in this category. We underline, however, that the empirical of Bayesian estimates (EBE) shrinkage for CL was 13%, indicating that the CL EBEs are reliable and that the variance estimate was unbiased.
No relationship between concentration and efficacy of lamivudine has been successfully demonstrated. Thus, we considered the range of AUC0–24h observed in adults with normal renal function following administration of 300 mg day−1 of lamivudine 7,8. Considering this range of AUC0–24h, the calculated dose needed to reach this adult exposure according to creatinine clearance showed that the transition from 100 to 300 mg day−1 at a CLCR value of 50 ml min−1 should be reconsidered. Simulation studies confirmed the FDA dose recommendations for patients with moderate and severe renal impairment. However, a dose reduction from 300 to 200 mg in mild renal impairment may be appropriate. Adjustment of the dose based on renal impairment is usually done to prevent toxicity; however, the relationship between toxicity (including lactic acidosis) and lamivudine exposure is not clearly shown; female gender, obesity and prolonged nucleoside exposure may be the major risk factors 14. However, Bonnet et al. 15 found that low creatinine clearance was also associated with lactic acidosis, suggesting a possible exposure–lactic acidosis relationship. Nevertheless, the question of a concentration–response relationship remains to be addressed. We propose that in case of intolerance to the treatment, the dose should be decreased from 300 to 200 mg in patients with mild renal impairment.
The current FDA recommendations for lamivudine in other categories of patients (from severe to moderate renal impairment) provide optimal exposures.
In conclusion, this study reports 3TC pharmacokinetics in adults over a very wide age range, from young adult to elderly patients. The pharmacokinetic parameters were consistent with previous studies. The lamivudine elimination clearance is related to renal function. To provide optimal exposure, patients with mild renal impairment should receive 200 mg day−1 instead of 300 mg day−1.
Competing Interests
All authors have completed the Unified Competing Interest form at http://www.icmje.org/coi_disclosure.pdf (available on request from the corresponding author) and declare: no support from any organization for the submitted work; no financial relationships with any organizations that might have an interest in the submitted work in the previous 3 years; no other relationships or activities that could appear to have influenced the submitted work.
References
- 1.Johnson MA, Moore KH, Yuen GJ, Bye A, Pakes GE. Clinical pharmacokinetics of lamivudine. Clin Pharmacokinet. 1999;36:41–66. doi: 10.2165/00003088-199936010-00004. [DOI] [PubMed] [Google Scholar]
- 2.Heald AE, Hsyu PH, Yuen GJ, Robinson P, Mydlow P, Bartlett JA. Pharmacokinetics of lamivudine in human immunodeficiency virus-infected patients with renal dysfunction. Antimicrob Agents Chemother. 1996;40:1514–1519. doi: 10.1128/aac.40.6.1514. [DOI] [PMC free article] [PubMed] [Google Scholar]
- 3.Johnson MA, Verpooten GA, Daniel MJ, Plumb R, Moss J, Van Caesbroeck D, De Broe ME. Single dose pharmacokinetics of lamivudine in subjects with impaired renal function and the effect of haemodialysis. Br J Clin Pharmacol. 1998;46:21–27. doi: 10.1046/j.1365-2125.1998.00044.x. [DOI] [PMC free article] [PubMed] [Google Scholar]
- 4.Kuhn E, Lavielle M. Maximum likelihood estimation in nonlinear mixed effects models. Comput Stat Data Anal. 2005;49:1020–1038. [Google Scholar]
- 5.Savic RM, Karlsson MO. Importance of shrinkage in empirical bayes estimates for diagnostics: problems and solutions. AAPS J. 2009;11:558–569. doi: 10.1208/s12248-009-9133-0. [DOI] [PMC free article] [PubMed] [Google Scholar]
- 6.Ihaka R, Gentleman R. R: a language for data analysis and graphics. J Comput Graph Stat. 1996;5:299–314. [Google Scholar]
- 7.ViiV Healthcare UK, Ltd. Epivir, Summary of Product Characteristics. Uxbridge, Middlesex, UK: ViiV Healthcare UK, Ltd; 2010. posting date. [Google Scholar]
- 8.Bruno R, Regazzi MB, Ciappina V, Villani P, Sacchi P, Montagna M, Panebianco R, Filice G. Comparison of the plasma pharmacokinetics of lamivudine during twice and once daily administration in patients with HIV. Clin Pharmacokinet. 2001;40:695–700. doi: 10.2165/00003088-200140090-00005. [DOI] [PubMed] [Google Scholar]
- 9.Food and Drug Administration. Draft guidance for industry pharmacokinetics in patients with impaired renal function – study design, data analysis, and impact on dosing and labeling [Online]. Available at http://www.fda.gov/downloads/Drugs/%E2%80%A6/Guidances/UCM204959.pdf (last accessed 31 March 2014)
- 10.Mueller BU, Lewis LL, Yuen GJ, Farley M, Keller A, Church JA, Goldsmith JC, Venzon DJ, Rubin M, Pizzo PA, Balis FM. Serum and cerebrospinal fluid pharmacokinetics of intravenous and oral lamivudine in human immunodeficiency virus-infected children. Antimicrob Agents Chemother. 1998;42:3187–3192. doi: 10.1128/aac.42.12.3187. [DOI] [PMC free article] [PubMed] [Google Scholar]
- 11.Moore KH, Yuen GJ, Raasch RH, Eron JJ, Martin D, Mydlow PK, Hussey EK. Pharmacokinetics of lamivudine administered alone and with trimethoprim-sulfamethoxazole. Clin Pharmacol Ther. 1996;59:550–558. doi: 10.1016/S0009-9236(96)90183-6. [DOI] [PubMed] [Google Scholar]
- 12.Moore KH, Yuen GJ, Hussey EK, Pakes GE, Eron JJ, Jr, Bartlett JA. Population pharmacokinetics of lamivudine in adult human immunodeficiency virus-infected patients enrolled in two phase III clinical trials. Antimicrob Agents Chemother. 1999;43:3025–3029. doi: 10.1128/aac.43.12.3025. [DOI] [PMC free article] [PubMed] [Google Scholar]
- 13.Bouazza N, Hirt D, Blanche S, Frange P, Rey E, Tréluyer J-M, Urien S. Developmental pharmacokinetics of lamivudine in 580 pediatric patients ranging from neonates to adolescents. Antimicrob Agents Chemother. 2011;55:3498–3504. doi: 10.1128/AAC.01622-10. [DOI] [PMC free article] [PubMed] [Google Scholar]
- 14.ViiV Healthcare UK, Ltd. Highlights of prescribing information.pdf [Online]. Available at http://www.accessdata.fda.gov/drugsatfda_docs/label/2011/020564s031,020596s030lbl.pdf (last accessed 7 April 2014)
- 15.Bonnet F, Bonarek M, Morlat P, Mercié P, Dupon M, Gemain MC, Malvy D, Bernard N, Pellegrin JL, Beylot J. Risk factors for lactic acidosis in HIV-infected patients treated with nucleoside reverse-transcriptase inhibitors: a case-control study. Clin Infect Dis. 2003;36:1324–1328. doi: 10.1086/374601. [DOI] [PubMed] [Google Scholar]


