

Abstract
Aims
The use of mycophenolate mofetil (MMF) in children with systemic lupus erythematosus (SLE) is increasing. However, the clinical benefit of its monitoring has been scarcely studied, and little is known about its pharmacokinetics in this context. The objectives of the present study were: (i) to describe mycophenolic acid (MPA, the active moiety of MMF) pharmacokinetics, (ii) to develop a Bayesian estimator (BE) allowing the determination AUC (area under the curve) from a limited number of blood samples and (iii) to explore the relationships between exposure indices to MPA and the clinical status in children with SLE.
Methods
This was a retrospective study including 36 children with SLE, extracted from the expert system ISBA, for whom full- pharmacokinetic profiles of MPA were collected together with clinical data. A pharmacokinetic model and a BE were developed using an iterative two stage Bayesian approach. ROC curve analyses and logistic regressions were used to investigate the association of exposure and active disease.
Results
A pharmacokinetic model and a BE were developed that allowed good AUC estimation performance (bias ± SD = −0.02 ± 0.15). ROC curve analyses showed that AUC/dose <0.06 and AUC <4 mg l−1 h were associated with a good sensitivity and specificity for active disease (78%/94% and 94%/56%, respectively). When introduced in a logistic regression model, AUC <44 mg l−1 h and AUC/dose <0.06 were associated with an increased risk of active disease (OR = 21.2, 95% CI 2.3, 196.1, P = 0.007 and OR = 59.5, 95% CI 5.9, 588.2, P = 0.0005 respectively].
Conclusions
The developed pharmacokinetic BE could be used to test prospectively the interest of MPA monitoring for limiting relapse of the disease or its progression.
Keywords: mycophenolic acid, pharmacokinetics, PK/PD, systemic lupus erythematosus
What is already known about this subject
Literature reports poor information about the therapeutic strategies to treat children with systemic lupus erythematosus (SLE).
Several studies in children with autoimmune diseases have shown that therapeutic drug monitoring of mycophenolic acid using AUC measurements could improve the therapeutic response of patients.
There is a need for a pharmacokinetic Bayesian estimator for MPA in a population of children with SLE.
What this study adds
Exploration of the exposure-effects relationships of MPA in children suffering from SLE.
Definition of MPA exposure threshold associated with active disease.
A Bayesian estimator was developed for the estimation of MPA AUC on the basis of three samples, easily applicable in the routine activity.
Introduction
Systemic lupus erythematosus (SLE) is an autoimmune disease affecting multiple organs and has many forms of expression 1. The intensity of the disease activity and its evolution can be evaluated using a score called ‘SLEDAI’ (Systemic Lupus Erythematosus Disease Activity Index) 2. Multiple drugs with immunosuppressive properties have been used to treat SLE: hydroxychloroquine, corticosteroids, methotrexate, azathioprine, ciclosporin and mycophenolic acid (MPA). With an improved safety profile, MPA is being increasingly used. The clinical value of therapeutic drug monitoring (TDM) of MPA has been largely explored in renal transplantation 3. The different consensus conferences which have discussed this issue concluded that the area under the curve (AUC) is the best index of exposure to MPA, and that a target of 30 to 60 mg l−1 h for AUC(0,12 h) should be recommended. Prospective controlled concentration studies have been conducted to determine the impact of MPA TDM based on the measurement of the AUC, including a multicentre study in renal transplant patients which observed that a significant decrease of acute rejection and overall cost of care was not significantly different in the arm that benefited from TDM 4. In a study of about 7000 transplant patients routinely followed in 53 centres, we showed that dose adjustment of MPA based on AUC, by pharmacokinetic modelling and Bayesian estimation, reduced significantly the intra-individual and interindividual variability of MPA exposure, and so minimized under or overexposure 5. However, the place of MPA TDM remains to be defined for most autoimmune diseases. Interestingly, the literature reports poor information that could help to define the best strategy for children with SLE. Nevertheless, several studies in adult 6 or paediatric 7 patients suffering from autoimmune diseases have shown, at least, that TDM using AUC measurements could be proposed and that this index of overall exposure is very likely correlated with the expression of the diseases.
Among the tools to determine the AUC, Bayesian estimators are recognized as the most reliable 8. Briefly, a Bayesian estimator allows, based on a limited number of blood samples and using a pharmacokinetic model, the calculation of the AUC in a patient to provide an individualized dose to a target of AUC.
In the present study, we proposed (i) to study the pharmacokinetics of MPA in a population of children with SLE and receiving mycophenolate mofetil (MMF, prodrug of MPA) using rich PK profile data, (ii) to develop a Bayesian estimator for the estimation of MPA AUC based on a limited number of blood samples and (iii) to explore the relationships between MPA AUC and disease activity in this population.
Methods
Patients
The paediatricians had the possibility to ask for dose adjustments of MMF for children with SLE, after data capture of clinical-biological and pharmacokinetic information on a secured website (ISBA; Immunosuppressant Bayesian Adaptation) dedicated to the dose adjustment of immunosuppressive drugs 5. In the present study, we performed a retrospective analysis of the requests collected between 2009 and 2012. The expert system received an authorization from the National Informatics and Liberty Committee (CNIL) to collect individual data in an electronic file (authorization number: 1619537). According to European and French laws, this was a non-interventional study of anonymous patient data filed in an electronic database. For the 36 patients extracted from the ISBA website, a request form was filled in by the prescriber. Briefly, this request form allowed the gathering of clinical information about the disease activity at the time of the MPA AUC measurement, as well as demographic data (age, gender, weight, height) and data related to MPA measurements. For each patient, the measurement of MPA concentrations was carried out among these theoretical samples: just before the morning dose and then 20 min, 40 min, 1 h, 1.5 h, 2 h, 3 h, 4 h, 6 h, 8 h and 12 h. All the PK profiles were performed using validated and routinely used HPLC methods.
Indications of performing MPA PK profiles with the aim of calculating AUC values were based on clinical decisions made by the patients’ physicians. Despite the lack of any consensus on MPA TDM based on AUC measurement, physicians were asked to perform serial sampling in order to calculate AUC in either difficult to treat patients with a suspicion of underexposure to MPA or well controlled patients for whom the absence of overexposure has to be checked. The development of both the PK model and Bayesian estimators became possible when enough data were available.
Pharmacokinetic modelling
General strategy
The modelling steps were carried out according to the following chronology:
The 36 full MPA PK profiles collected in the ISBA website were used for the development of a pharmacokinetic model by an iterative two stage Bayesian approach (IT2B) (model 1).
Then, this model was used for a simulation procedure (1500 patients simulated): (a) for data expansion 1000 patients were used for the construction of both a new pharmacokinetic model (model 2) and its derived Bayesian estimator and (b) for the validation of the limited sampling strategy (LSS) 500 patients were used as a validation group for the Bayesian estimator developed from model 2.
Step 1: Iterative two stage Bayesian approach (IT2B)
A single compartment model with first order elimination and absorption described by a sum of two gamma distributions with two parallel routes of absorption was used.
This pharmacokinetic model was previously published for the description of PK profiles of MPA in renal transplantation 9,10 or marrow 11 and in adults with SLE 6 or nephrotic syndrome 7. Briefly, in this model, the absorption rate at time t (Vabs (t)) is described by a sum of these two gamma distributions:
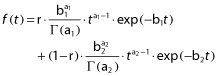 |
where C(t) represents the concentration at time (t), k the elimination rate constant, F the bioavailability, D the dose, V the volume of distribution, b1, b2, a1 and a2 the elements of gamma distributions and r the fraction of dose absorbed from the first gamma function.
To apply this model, a program developed by our unit was used. The program is written in Pascal (Delphi, http://www.embarcadero.com/products/delphi/) and is based on the open source library Dmath (http://sourceforge.net/projects/dmath/). The complete methodology has been described in various papers published by our team 7,11. The residual variability was described using a logistic error model dependent on the concentration (y = e0+(e1 – e0)/[1 + exp(–e2*concentration + e3)] with e0 = 0.1300, e1 = 2.5700, e2 = 0.1447 and e3 = 3.1030.
Step 2: simulation of 1500 patients and Bayesian estimation
One thousand five hundreds PK profiles were simulated taking into account the dose distribution of the reference population (represented by the n = 36 patients). For each ‘patient’ simulated PK parameters were obtained by random selection in multinormal distribution defined by the population parameters. Concentrations were calculated at 0, 20, 40, 60, 90, 120, 150, 180, 240, 300, 360, 420, 480, 540, 600, 660 and 720 min. The random number generator used was the ‘Mersenne Twister’ which is considered to be one of the best generators available. Gaussian random numbers were generated using the Box-Muller method. For the multinormal distribution with mean vector μ and variance-covariance matrix Σ, the following classical algorithm can be used: let L be the Cholesky factor of Σ (i.e. the lower triangular matrix such as LLT = Σ); if u is a vector of independent standard normal random numbers, then μ + Lu is a vector from the multinormal distribution.
Individual parameters (vector θ) for the first 1000 patients were determined by the Bayesian method by minimizing the following objective function:
where Φ is the objective function of the Bayesian posterior distribution, n the number of experimental points, Ci the MPA concentrations measured at time ti, Vi variance of the measured concentration, θ the vector of model parameters, μ the average value of parameters in the general population, Ω the variance-covariance parameters in the general population and T the transposed matrix. Matrix ‘variance-covariance’ (V) of the posterior distribution of parameter estimates for each patient was calculated by the classical approximation:
where J denotes the Jacobian matrix (Jij = ∂ f (t, θ)/∂ θj) and W the diagonal matrix of weights (Wii = 1 or Vi). The determinant of V (detV) was used here as a tool for assessing the accuracy of the measurement parameters (more determinant is low, the better the accuracy).
The best LSS that could allow AUC determination was then determined and tested in the remaining 500 patients. Only the combinations of three points in the first 240 min were tested. Comparisons between the observed AUC (obtained by the trapezoidal rule based on concentration measurements simulated at times 0, 20, 40, 60, 90, 120, 150, 180, 240, 300, 360, 420, 480, 540, 600, 660 and 720 min) and those calculated by Bayesian estimation, were performed by regression analysis and by calculating the mean bias and mean square error or root mean square error (RMSE). The number of patients with imprecision in AUC determination greater than 20% was also seen as a selection criterion. Finally, a kappa concordance test was performed that answered the following question: for a target AUC of 45 mg l−1 h is the proposed dose after determining AUC using Bayesian estimation based on three concentrations concordant with that proposed from the simulated AUC (i.e. that obtained from the 17 simulated concentrations) 12.
Study of the relationship between MPA exposure and disease activity
Threshold values of AUC (normalized by dose or not) and trough level (C0; normalized or not by dose) that could classify SLE as active or inactive were investigated by construction of receiver operating curves (ROC). SLE was considered active if the patient had a SLEDAI score greater than or equal to 6 2,13.
The variables AUC, C0, AUC/dose and C0/dose were then included in a logistic regression model to quantify the relationship between exposure and disease activity. Covariates (gender, age, time since the start of treatment, albumin) were introduced into the model to adjust for confounders. A usual strategy of model selection was used: each variable was tested by univariate analysis and those characterized by a P value of <0.10 were included in an intermediate model. The final model variables were determined by backward selection by comparing models based on the Akaike criterion (P < 0.05 as significance level). The statistical analyses described in this section were performed using R software version 2.15.1 (R foundation for statistical computing, http://www.r-project.org).
Results
The retrospective study consisted of 36 patients for whom PK profiles of MPA had been performed. These patients were followed in nine different French paediatric departments. The population characteristics are summarized in Table 1.
Table 1.
Patient characteristics
| Parameters | Values |
|---|---|
| Number of patients | 36 |
| Age (years) | 12.9 ± 2.6 (4.7, 16.7) |
| Gender (Male/Female) | 10/26 |
| Delay between MMF inititation and sampling | 274 (6, 2680) |
| Weight (kg) | 45.8 ± 16.1 (16.0, 96.0) |
| BSA (m2) | 1.35 ± 0.29 (0.69, 2.09) |
| BMI (kg m−2) | 20.72 ± 4.88 (13.72, 36.13) |
| Albumin | 36.9 ± 4.1 (29.0, 44.0) |
| Morning MMF dose (mg) | 728 ± 255 (300, 1250) |
| Morning MMF dose/BSA (mg m−2) | 544 ± 175 (217, 998) |
| SLEDAI score | 6 ± 6 (0, 20) |
| Patients having an active disease at the time of sampling (SLEDAI >6) n (%) | 16 (44.4%) |
Data are expressed as mean ± SD (min, max) except for delay between initiation and sampling (median (min, max).
A statistically significant correlation between observed MPA trough concentrations and AUC(0,12 h) [Spearman r2 (95% CI) = 0.442 (0.057, 0.713), P = 0.03] was observed.
The PK data obtained in these 36 children (295 concentrations) were used to develop a single compartment open model with first order elimination and absorption described by a sum of two gamma distributions with two parallel routes of absorption. The individual PK profiles were accurately described using it. The regression analyses between estimated AUC and AUC observed (y = 1.67x – 1.77; r2 = 0.97), and between estimated and observed concentration levels (y = 0.96x + 0.15; r2 = 0.99) as well as weighted residuals as a function of fitted concentrations are presented in Figure 1. Figure 2 represents the whole MPA plasma concentrations together with some typical modelled individual PK profiles. Population PK parameters are presented in Table 2. In this population of 36 children, the value of the apparent volume of distribution (Vc/F) was 24.8 ± 13.5 l and the apparent clearance (CL/F) was 19.2 ± 13.2 l h−1.
Figure 1.
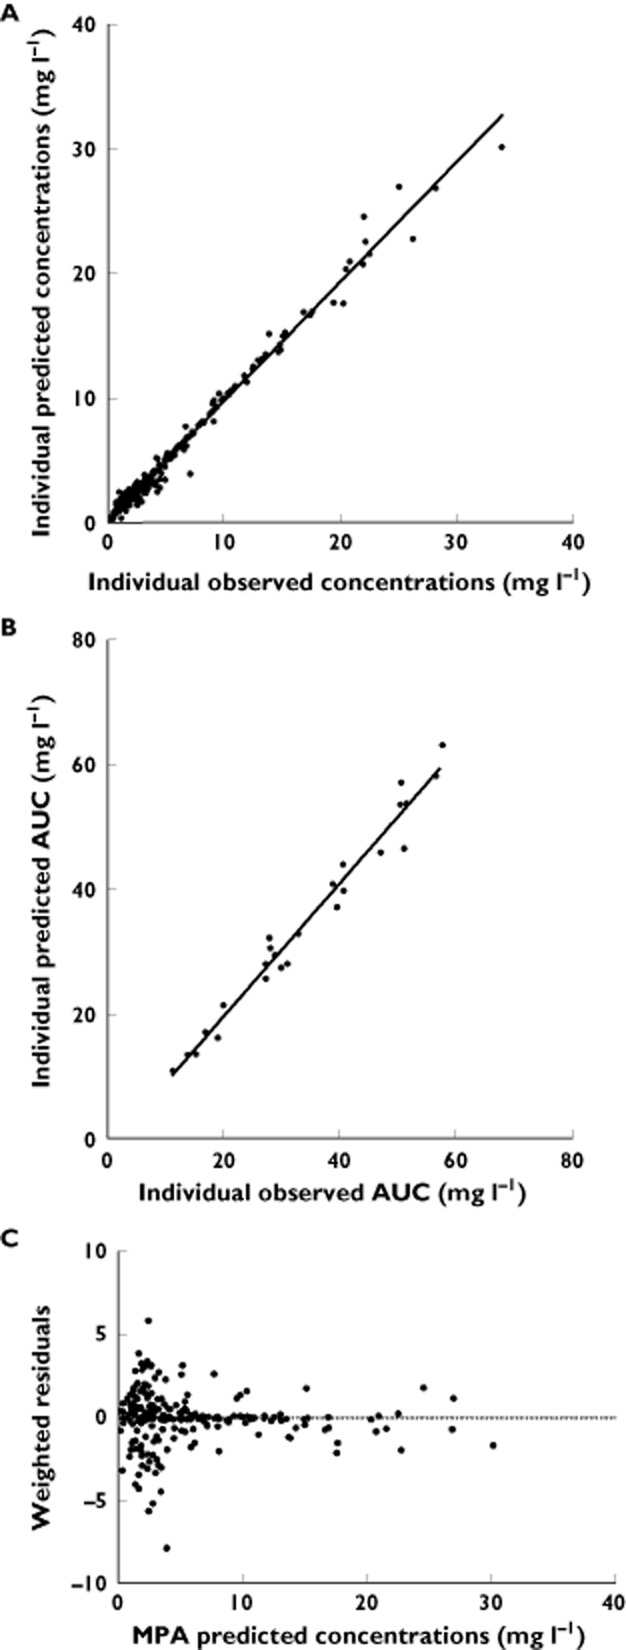
Regression analysis between observed concentrations (A) or area under the curve (AUC) (B) and individual prediction. Weighted residuals as a function of fitted concentrations (C)
Figure 2.

Whole plasma MPA concentration–time curves in paediatric patients taking MMF (A). Typical examples of fitted pharmacokinetic profiles (B) (black circles are observed concentrations while solid line represent the prediction of the model)
Table 2.
Characteristics of the model in the database and in simulated patients
| Pharmacokinetric parameters | Database (n = 36) | Simulated patients (n = 1000) |
|---|---|---|
| Mean ± SD | Mean ± SD | |
| a1 | 21.2 ± 6.9 | 20.9 ± 4.7 |
| b1 | 47.9 ± 14.1 | 49.4 ± 10.8 |
| a2 | 30.2 ± 12.5 | 30.8 ± 9.5 |
| b2 | 27.6 ± 10.7 | 25.1 ± 6.8 |
| FA-IV | 5.0 ± 2.1 | 4.6 ± 1.9 |
| r | 0.3 ± 0.2 | 0.3 ± 0.1 |
a1 and a2 are shapes, b1 and b2 scales of the two gamma laws, r is the fraction of dose absorbed from the first gamma function, FA-IV is the disposition coefficient following an intravenous bolus administration of a unit dose.
Based on this pharmacokinetic model, 1500 patients were simulated according to the distribution of doses in the population of 36 patients. On the basis of 1000 PK profiles, a new population PK model was developed. This model accurately described the PK profiles. Regression analyses between observed and estimated concentrations or AUCs gave similar results to those observed for the 36 patients (data not shown). Population PK parameters of this model are presented Table 2. The information obtained was then used as prior information to perform the Bayesian estimation in the 500 remaining simulated patients. In this group of 500 patients, the best limited sampling strategy to estimate the AUC based on three samples in the first 4 h after the dose was 20 min, 60 min and 180 min (Table 3). In this population, the Bayesian estimator predictive performance was satisfactory. Bias between ‘AUC 3 points’ and ‘AUC 12 points by the trapezoidal method (obtained by simulation) was 0.02 ± 0.15; which corresponded to 12% of the patients having an imprecision in AUC estimation greater than 20%. The kappa test (measuring the concordance between the dose proposals of the Bayesian estimator and that of the trapezoidal method) reported a value of 0.8, meaning a good agreement between the two approaches.
Table 3.
Comparison of different limited sampling strategy (LSS) in 500 simulated PK profiles
| Sampling times (h post-dosing) | Bias between observed and predicted AUC (mean) | Bias SE (%) | RMSE (%) | Percentage of patients with a bias greater than ± 20% |
|---|---|---|---|---|
| 0.33-1-3 | −0.002 | 15.82 | 15.8 | 60 |
| 0.33-1-4 | 7.45 | 20.74 | 22.02 | 117 |
| 0.33-3-4 | 8.53 | 24.36 | 25.79 | 136 |
| 0.66-1-3 | 0.66 | 17.68 | 17.67 | 74 |
| 0.66-2-3 | −1.90 | 19.37 | 19.45 | 98 |
| 0.66-3-4 | 3.71 | 22.30 | 22.59 | 100 |
To study the relationships between MPA exposure and disease activity, we first looked for a threshold of AUC/dose and C0/dose that could predict the activity of the disease with good sensitivity (Se) and specificity (Sp). ROCs corresponding to this study are shown in Figure 3A and C. In our population of 36 patients: 78% with a SLEDAI greater than 6 had a value of AUC/dose less than 0.06 (Se) and 94% of patients without active disease had a value of AUC/dose greater than 0.06 (Sp). C0/dose was associated with a Se of 67% and a Sp of 78% for a threshold of ≤0.0024. A similar analysis was performed to look for a threshold value of AUC and C0 (Figure 3B and D). Among the 36 patients, 94% of patients had a SLEDAI active when AUC was less than 44 mg l−1 h (sensitivity) and 56% of patients without active disease had an AUC greater than 44 mg l−1 h (specificity). Accordingly, C0 was associated with a Se of 56% and a Sp of 72% for a threshold of ≤1.71 mg l−1.
Figure 3.
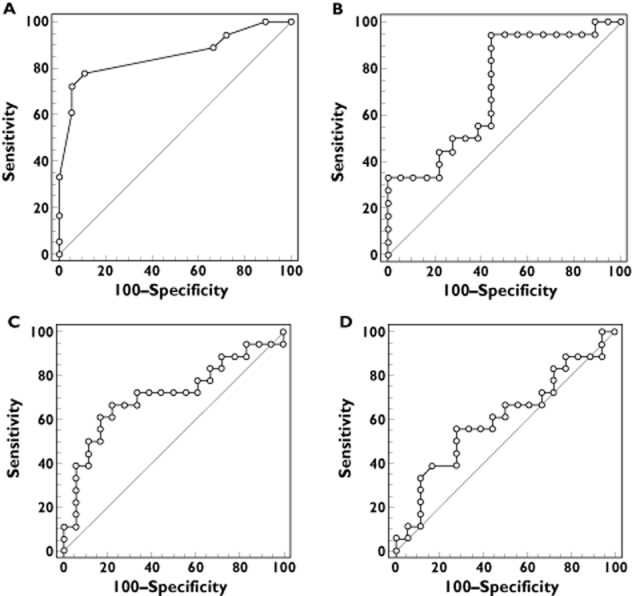
Receiver operating characteristic (ROC) curves of sensitivity plotted against 100 – specificity for SLEDAI greater than 6 for mycophenolic acid dose normalized area under the curve (AUC/D) (A), mycophenolic acid AUC (B), mycophenolic acid dose normalized trough concentration (C) or mycophenolic acid trough concentration (D). Threshold (Sensitivity/Specificity) of ≤0.06 (78/94) (A), ≤44 mg l−1 h (94/56) (B), ≤0.0024 (67/78) (C) and ≤1.71 mg l−1 (56/72) (D)
A logistic regression analysis was then conducted to examine the relationships between the SLEDAI score and the indices of exposure to MPA (trough concentrations (C0) and AUC), taking into account confounding factors. The AUC was studied as a binary variable dichotomized according to the threshold determined in the previous step. The logistic regression analysis revealed no association between MPA C0 values and SLEDAI score, but an association was found between SLEDAI score and the AUC or AUC/dose. No other demographic covariates were significantly associated with the SLEDAI score in univariate analysis. Moreover, there was no statistical interaction between neither AUC or AUC/dose and albumin level in the logistic regression analysis. The results of the final models including AUC or AUC/dose showed that the risk of active disease was 21 times greater in patients with an AUC less than 44 mg l−1 h [OR (95% CI) = 21.2 (2.3, 196.1); P = 0.007]. The same risk was 59 times greater for patients with a value of AUC/dose less than 0.06 [OR 59.5 (95% CI5.9, 588.2); P = 0.0005].
Discussion
A model that described MPA pharmacokinetics in children with SLE has been developed. Using this model, a Bayesian estimator for AUC determination on the basis of three blood samples was built and validated. The relationship between the exposure to MPA (AUC and AUC/dose) and the disease activity at the time of AUC determination was also demonstrated.
The measurement of trough concentration has been proposed to perform dose adjustments of MPA in patients with an auto-immune disease 14. However, as observed in the present study, even if statically significant, it is questionable whether a correlation between AUC and trough concentration with a r2 of 0.5 can be clinically acceptable or not. Theoretically, this value means that 50% of the AUC value is not predicted by the trough concentration value. Additionally, in the present study, the sensitivity and specificity associated with a MPA C0 or C0/dose threshold that could discriminate patients with an active or an inactive disease (i.e. expressed by the SLEDAI score) were much lower than those observed for MPA AUC or AUC/dose. Thus, C0 or C0/dose thresholds of 1.71 mg l−1 and 0.0024 could be proposed, but with respective sensibility of 0.55 and 0.67 (e.g. the probability to actually have an active disease when having a C0 less than 1.71 mg l−1 is about 55%).
To our knowledge, only one study developed a pharmacokinetic model for MPA when used in children with SLE 15. The authors developed a model with a gallbladder compartment for enterohepatic recycling and bile release time related to meal times, with first order absorption and a single series of transit compartments. In the present study, a model was developed from rich PK profiles obtained from 36 children. A similar model was previously used for the analysis of PK profiles of MPA in other contexts, renal transplantation 9,10, stem cell transplant 11 and paediatric nephrotic syndrome 7 and it allowed the absorption profiles of MPA to be described very accurately. We have chosen to simulate new patients (using the developed model) as the population was relatively small, meaning that it was not suitable to separate patients a priori into a group used to develop our Bayesian estimator and an independent group for their validation. When a sufficient number of patients are created, it is considered that these ‘virtual’ patients represent the distribution of the population, and therefore their PK parameters and derived concentration curves can be used as reference values. This approach has been widely used and can be recommended when the populations are small 16,17.
In the next step, the predictive performance of the Bayesian estimator has been tested in an independent group of 500 patients, also created by simulation. For nearly nine out of 10 patients, the imprecision in AUC estimation (using a 20 min-60 min-180 min schedule) was less than 20%. In addition, the dose recommendations after Bayesian estimation were consistent with those proposed when the AUC was calculated on the basis of a full kinetic profile. Consequently, the Bayesian estimator could estimate the value of AUC with fairly good accuracy, and therefore could be used to guide dose adjustments of MMF in children with SLE.
This study also explored the relationship between MPA exposure and disease expression. In this population of 36 children, we observed that the AUC/dose and AUC values were related to disease activity at the time of AUC determination. This was not the case for trough concentration values. Other studies have found a correlation between MPA exposure and the activity of an autoimmune disease. In a population of 71 adult patients with lupus, Zahr et al. have shown that disease activity was significantly correlated with the AUC of MPA 18. As in the present study, the authors used a model developed in a first cohort of patients to calculate the AUC by pharmacokinetic modelling and Bayesian estimation using three blood samples. In this retrospective study, patients with active disease (SLEDAI score = 11.6 ± 4.4, n = 26) had an AUC value significantly lower than patients with inactive disease (SLEDAI score = 1.9 ± 1.6; n = 45): 26.8 ± 13.6 vs. 46.5 ± 16.3 mg l−1 h, P < 0.0001. Multivariate analysis of data reported that the AUC was the only parameter associated with disease activity and the authors proposed a target AUC of 35 mg l−1 h (negative predictive value 92%). In this population where only 11% of patients (8/71) had an AUC greater than 60 mg l−1 h, no correlation between exposure and toxicity was found. In a population of 19 children with lupus, Sagcal-Gironella et al. found that patients with an AUC value greater than 30 mg l−1 h had the highest score decreases in disease activity. In this study, the exposure–toxicity relationship has not been studied 19. In a population of 60 children followed for idiopathic nephrotic syndromes (INS), we previously observed that those in complete remission had significantly higher AUCs than those in partial remission (P = 0.007) or partial relapse (P = 0.005) 7.
MPA is known to be extensively bound to serum albumin, and that among other factors that can potentially decrease total MPA plasma concentration, the concentration of albumin itself has the most substantial effect (see 20 for review). Interestingly, when albumin concentration decreases, the unbound fraction of MPA increases leading to increased drug availability for metabolism and elimination. We have previously observed a positive correlation between AUC/dose and albumin levels (i.e. a negative correlation between CL/F and albumin) for albumin values <30 g l−1, in children suffering from a nephrotic syndrome 7. The hypotheses were that (i) albumin acts as the limiting factor when at low levels (when serum albumin increases from very low levels to 30 g l–1, the MPA bound fraction increases proportionally) and (ii) when albumin is at a normal level, its variation has no significant impact on the MPA plasma concentration. In the present study, no statistical interaction between albumin and exposure was shown in the logistic regression analysis and albumine was not associated with the SLEDAI score in univariate analysis. The fact that most of the patients had albumin values greater than 30 g l−1 is possibly the explanation.
More recently, in a population of 90 patients with INS (i.e. an extension of the population reported in Saint-Marcoux et al. 7), Dallochio et al. have reported a decrease in the frequency of relapse for patients benefiting from AUC measurements (1 for 19 patients per month vs. 1 for 31 patient per month; P < 0.01) (oral communication in Congrès de la société de Nephrologie pédiatrique, Paris, 2011). Additionally, the authors have reported that the proportion of patients without relapse was significantly higher when the AUC value was less than 45 mg l−1 h (82% vs. 52%, P < 0.01).
Consequently, although the literature does not report objective information to define the best strategy for TDM of MMF in children suffering from SLE, several studies in adult or paediatric patients suffering from autoimmune diseases have shown that, at least, TDM of MMF on the basis of measuring the AUC can be justified. Moreover, it has been shown that the AUC is most likely correlated with the expression of the disease severity. Despite the lack of ‘concentration-controlled’ studies, it is obvious that under or over exposure may have significant deleterious consequences for children. According to the literature and the results of our study, it seems that a target value of 45 mg l−1 h could be proposed in the context of SLE. Very little information is available regarding the exposure–toxicity relationship, but it is also likely that AUC values above 60 mg l−1 h provide no additional benefit and increase the incidence of adverse drug effects (as this is the case in transplantation).
One limit of this study is the absence of pharmacogenetic data which are known to modify MPA pharmacokinetics (UGT1A9 −275/−2152 TC > AT 21, SLCO1B3 334/699 TG > GA 22. However, none of these covariates has been successfully introduced in a PK model dedicated to the dose adjustment of the drug up to now.
In conclusion, we have developed a model based approach for estimating AUC of MPA on the basis of three samples easily achievable in routine. The development of this Bayesian estimator is the answer to a request from clinicians who aimed at improving the care of patients with SLE by better monitoring of MMF therapy. The developed Bayesian estimator should allow the design of controlled concentration studies to test the interest of MPA TDM performed on the basis of AUC measurements and test the hypothesis that target attainment (AUC >45 mg l−1 h or AUC/dose >0.06) can limit relapse of the disease or its progression.
Competing Interests
All authors have completed the Unified Competing Interest form at http://www.icmje.org/coi_disclosure.pdf (available on request from the corresponding author) and declare no support from any organization for the submitted work, no financial relationships with any organizations that might have an interest in the submitted work in the previous 3 years and no other relationships or activities that could appear to have influenced the submitted work.
The authors are grateful to F. Bousson for database handling and K. Poole for manuscript editing. The authors have no conflict of interest to declare.
References
- 1.Tsokos GC. Systemic lupus erythematosus. N Engl J Med. 2011;365:2110–2121. doi: 10.1056/NEJMra1100359. [DOI] [PubMed] [Google Scholar]
- 2.Griffiths B, Mosca M, Gordon C. Assessment of patients with systemic lupus erythematosus and the use of lupus disease activity indices. Best Pract Res Clin Rheumatol. 2005;19:685–708. doi: 10.1016/j.berh.2005.03.010. [DOI] [PubMed] [Google Scholar]
- 3.Kuypers DR, Le Meur Y, Cantarovich M, Tredger MJ, Tett SE, Cattaneo D, Tonshoff B, Holt DW, Chapman J, Gelder T. Consensus report on therapeutic drug monitoring of mycophenolic acid in solid organ transplantation. Clin J Am Soc Nephrol. 2010;5:341–358. doi: 10.2215/CJN.07111009. [DOI] [PubMed] [Google Scholar]
- 4.Le Meur Y, Buchler M, Thierry A, Caillard S, Villemain F, Lavaud S, Etienne I, Westeel PF, Hurault de Ligny B, Rostaing L, Thervet E, Szelag JC, Rerolle JP, Rousseau A, Touchard G, Marquet P. Individualized mycophenolate mofetil dosing based on drug exposure significantly improves patient outcomes after renal transplantation. Am J Transplant. 2007;7:2496–2503. doi: 10.1111/j.1600-6143.2007.01983.x. [DOI] [PubMed] [Google Scholar]
- 5.Saint-Marcoux F, Vandierdonck S, Premaud A, Debord J, Rousseau A, Marquet P. Large scale analysis of routine dose adjustments of mycophenolate mofetil based on global exposure in renal transplant patients. Ther Drug Monit. 2011;33:285–294. doi: 10.1097/FTD.0b013e31821633a6. [DOI] [PMC free article] [PubMed] [Google Scholar]
- 6.Zahr N, Amoura Z, Debord J, Hulot JS, Saint-Marcoux F, Marquet P, Piette JC, Lechat P. Pharmacokinetic study of mycophenolate mofetil in patients with systemic lupus erythematosus and design of Bayesian estimator using limited sampling strategies. Clin Pharmacokinet. 2008;47:277–284. doi: 10.2165/00003088-200847040-00005. [DOI] [PubMed] [Google Scholar]
- 7.Saint-Marcoux F, Guigonis V, Decramer S, Gandia P, Ranchin B, Parant F, Bessenay L, Libert F, Harambat J, Bouchet S, Broux F, Compagnon P, Marquet P. Development of a Bayesian estimator for the therapeutic drug monitoring of mycophenolate mofetil in children with idiopathic nephrotic syndrome. Pharmacol Res. 2011;63:423–431. doi: 10.1016/j.phrs.2011.01.009. [DOI] [PubMed] [Google Scholar]
- 8.Tett SE, Saint-Marcoux F, Staatz CE, Brunet M, Vinks AA, Miura M, Marquet P, Kuypers DR, van Gelder T, Cattaneo D. Mycophenolate, clinical pharmacokinetics, formulations, and methods for assessing drug exposure. Transplant Rev (Orlando) 2011;25:47–57. doi: 10.1016/j.trre.2010.06.001. [DOI] [PubMed] [Google Scholar]
- 9.Premaud A, Debord J, Rousseau A, Le Meur Y, Toupance O, Lebranchu Y, Hoizey G, Le Guellec C, Marquet P. A double absorption-phase model adequately describes mycophenolic acid plasma profiles in de novo renal transplant recipients given oral mycophenolate mofetil. Clin Pharmacokinet. 2005;44:837–847. doi: 10.2165/00003088-200544080-00005. [DOI] [PubMed] [Google Scholar]
- 10.Premaud A, Le Meur Y, Debord J, Szelag JC, Rousseau A, Hoizey G, Toupance O, Marquet P. Maximum a posteriori Bayesian estimation of mycophenolic acid pharmacokinetics in renal transplant recipients at different postgrafting periods. Ther Drug Monit. 2005;27:354–361. doi: 10.1097/01.ftd.0000162231.90811.38. [DOI] [PubMed] [Google Scholar]
- 11.Saint-Marcoux F, Royer B, Debord J, Larosa F, Legrand F, Deconinck E, Kantelip JP, Marquet P. Pharmacokinetic modelling and development of Bayesian estimators for therapeutic drug monitoring of mycophenolate mofetil in reduced-intensity haematopoietic stem cell transplantation. Clin Pharmacokinet. 2009;48:667–675. doi: 10.2165/11317140-000000000-00000. [DOI] [PMC free article] [PubMed] [Google Scholar]
- 12.Landis JR, Koch GG. The measurement of observer agreement for categorical data. Biometrics. 1977;33:159–174. [PubMed] [Google Scholar]
- 13.Ruperto N, Ravelli A, Cuttica R, Espada G, Ozen S, Porras O, Sztajnbok F, Falcini F, Kasapcopur O, Venning H, Bica B, Merino R, Coto C, Ros J, Susic G, Gamir ML, Minden K, See Y, Uziel Y, Mukamel M, Riley P, Zulian F, Olivieri AN, Cimaz R, Girschick H, Rumba I, Cavuto S, Pistorio A, Lovell DJ, Martini A. The Pediatric Rheumatology International Trials Organization criteria for the evaluation of response to therapy in juvenile systemic lupus erythematosus: prospective validation of the disease activity core set. Arthritis Rheum. 2005;52:2854–2864. doi: 10.1002/art.21230. [DOI] [PubMed] [Google Scholar]
- 14.Neumann I, Fuhrmann H, Fang IF, Jaeger A, Bayer P, Kovarik J. Association between mycophenolic acid 12-h trough levels and clinical endpoints in patients with autoimmune disease on mycophenolate mofetil. Nephrol Dial Transplant. 2008;23:3514–3520. doi: 10.1093/ndt/gfn360. [DOI] [PubMed] [Google Scholar]
- 15.Sherwin CM, Sagcal-Gironella AC, Fukuda T, Brunner HI, Vinks AA. Development of a population PK model with enterohepatic circulation for mycophenolic acid in patients with childhood-onset systemic lupus erythematosus. Br J Clin Pharmacol. 2012;73:727–740. doi: 10.1111/j.1365-2125.2011.04140.x. [DOI] [PMC free article] [PubMed] [Google Scholar]
- 16.Bonate PL. A brief introduction to Monte Carlo simulation. Clin Pharmacokinet. 2001;40:15–22. doi: 10.2165/00003088-200140010-00002. [DOI] [PubMed] [Google Scholar]
- 17.Schoemaker NE, Mathot RA, Schoffski P, Rosing H, Schellens JH, Beijnen JH. Development of an optimal pharmacokinetic sampling schedule for rubitecan administered orally in a daily times five schedule. Cancer Chemother Pharmacol. 2002;50:514–517. doi: 10.1007/s00280-002-0516-5. [DOI] [PubMed] [Google Scholar]
- 18.Zahr N, Arnaud L, Marquet P, Haroche J, Costedoat-Chalumeau N, Hulot JS, Funck-Brentano C, Piette JC, Amoura Z. Mycophenolic acid area under the curve correlates with disease activity in lupus patients treated with mycophenolate mofetil. Arthritis Rheum. 2010;62:2047–2054. doi: 10.1002/art.27495. [DOI] [PubMed] [Google Scholar]
- 19.Sagcal-Gironella AC, Fukuda T, Wiers K, Cox S, Nelson S, Dina B, Sherwin CM, Klein-Gitelman MS, Vinks AA, Brunner HI. Pharmacokinetics and pharmacodynamics of mycophenolic acid and their relation to response to therapy of childhood-onset systemic lupus erythematosus. Semin Arthritis Rheum. 2011;40:307–313. doi: 10.1016/j.semarthrit.2010.05.007. [DOI] [PMC free article] [PubMed] [Google Scholar]
- 20.Staatz CE, Tett SE. Clinical pharmacokinetics and pharmacodynamics of mycophenolate in solid organ transplant recipients. Clin Pharmacokinet. 46:13–58. doi: 10.2165/00003088-200746010-00002. [DOI] [PubMed] [Google Scholar]
- 21.van Schaik RH, van Agteren M, de Fijter JW, Hartmann A, Schmidt J, Budde K, Kuypers D, Le Meur Y, van der Werf M, Mamelok R, van Gelder TUGT. 1A9 -275T>A/-2152C>T polymorphisms correlate with low MPA exposure and acute rejection in MMF/tacrolimus-treated kidney transplant patients. Clin Pharmacol Ther. 2007;86:319–327. doi: 10.1038/clpt.2009.83. [DOI] [PubMed] [Google Scholar]
- 22.Picard N, Yee SW, Woillard JB, Lebranchu Y, Le Meur Y, Giacomini KM, Marquet P. The role of organic anion-transporting polypeptides and their common genetic variants in mycophenolic acid pharmacokinetics. Clin Pharmacol Ther. 2011;87:100–108. doi: 10.1038/clpt.2009.205. [DOI] [PMC free article] [PubMed] [Google Scholar]