

Abstract
Importance
Impaired mitochondrial functioning impacts many biological processes that depend heavily on energy and metabolism, and it can lead to a wide range of neurodevelopmental disorders, including Autism Spectrum Disorders (ASD). Although evidence that mitochondrial dysfunction is a biological subtype of ASD has grown in recent years, no study has yet demonstrated evidence of mitochondrial dysfunction in brain tissue in vivo in a large, well-defined sample of individuals with ASD.
Objectives
(1) To assess brain lactate in individuals with ASD and typically developing controls using high-resolution, multi-planar spectroscopic imaging; (2) To map the distribution of lactate in the brains of individuals with ASD and assess correlations of elevated brain lactate with age, autism subtype, and intellectual ability.
Design
Case-control study
Setting
Columbia University Medical Center and New York State Psychiatric Institute
Participants
75 children and adults with autism spectrum disorder and 96 age- and sex-matched, typically developing controls
Main Outcome Measure
Lactate doublets (present or absent) on brain magnetic resonance spectroscopic imaging
Results
Lactate doublets were present at a significantly higher rate in participants with ASD (13%) than controls (1%) (p=.001). In the ASD group, the presence of lactate doublets correlated significantly with age (p=.004) and was detected more often in adults (20%) than in children (6%), though it did not correlate with sex, ASD subtype, intellectual ability, or ADOS total score or subscores. In those with ASD, lactate was detected most frequently within the cingulate gyrus, but it was also present in the subcortical gray matter nuclei, corpus callosum, superior temporal gyrus, and pre- and post-central gyri.
Conclusions and Relevance
These in vivo brain findings provide evidence for a possible neurobiological subtype of mitochondrial dysfunction in ASD.
INTRODUCTION
Autism spectrum disorder (ASD) is a neurodevelopmental disorder characterized by disturbances in social interaction, communication, and behavioral flexibility.1 The diagnosis of ASD is at present based solely on behavioral phenotyping, and its underlying etiology can be identified in only a minority of cases. An estimated 10% of ASD cases are associated with a known genetic syndrome (“syndromic ASD”), and the remainder—classified as “primary” or “idiopathic” ASD—have no clearly identifiable cause.2 A variety of genetic and environmental factors likely contribute to the notorious etiologic heterogeneity of this disorder.2
Mitochondrial disease is an established cause of syndromic autism, generally believed until now to represent less than 1% of all cases of ASD.2–4 However, recent studies examining biomarkers of mitochondrial dysfunction obtained from peripheral or postmortem samples have detected impaired mitochondrial function in a much higher percentage of ASD cases.5–9 Whether these cases represent primary mitochondrial dysfunction or mitochondrial dysfunction secondary to other processes, such as increased oxidative stress, is unclear.3, 4 Moreover, peripheral markers do not necessarily represent in vivo disturbances in the brain. Thus, whether mitochondrial dysfunction is present in the brains of persons with ASD and may play a role in its core cognitive and behavioral symptoms remains unknown.
Three prior studies have used in vivo proton magnetic resonance spectroscopy (1H MRS) to measure brain lactate – a marker of mitochondrial dysfunction – in children with ASD.10–12 Lactate peaks were not detected at significantly higher rates in ASD participants compared to controls. Those studies, however, had various limitations: small sample sizes10; limited sampling of brain regions10–12; averaging and potential dilution of lactate signal over large, heterogeneous regions of interest10–12; reduced sensitivity due to low magnet field strength (1.5 Tesla)10–12; and data acquisition from a single volume coil rather than from multiple, more sensitive, surface coils.10–12
We acquired 1H MRS data on a 3 Tesla scanner to assess for in vivo evidence of mitochondrial dysfunction directly in the brains of a large sample of children and adults with ASD.
METHODS
Participants
Seventy-five individuals with ASD (simplex cases), aged 5–60 years, participated in this case-control study. They were recruited from child psychiatry clinics, schools, support groups, community events, and databases of research participants for other studies of ASD at our institution. The Institutional Review Board of the New York State Psychiatric Institute approved the study. Written informed consent was obtained from participants prior to their participation. For adult participants with ASD, an independent assessment of capacity to consent was conducted by a designated clinical monitor (a licensed psychologist or psychiatrist unaffiliated with the research study). If a participant was deemed by the monitor to lack capacity to consent, a participant-chosen surrogate then completed the consent process.
Each participant underwent a diagnostic evaluation by a psychiatrist, a neurologist, or a psychologist with expertise in the diagnosis of ASD. Diagnosis was made according to DSM-IV-TR criteria for Autistic Disorder (45%), Asperger’s Disorder (32%), or Pervasive Developmental Disorder-Not Otherwise Specified (23%). Assessments generally included the Autism Diagnostic Interview-Revised (ADI-R) in children and the Autism Diagnostic Observation Schedule (ADOS) in children and adults.13, 14 Exclusion criteria included identifiable genetic or metabolic abnormalities (e.g., Fragile X, tuberous sclerosis complex, known mitochondrial disease, etc.), a history of neurological injury (e.g., cerebral ischemia, inflammation, infection, malignancy, status epilepticus, or perinatal or postnatal trauma), seizure activity during the six months prior to the MRI scan, medical contraindications to MRI scanning (including claustrophobia), or inability to cooperate with study procedures. A detailed list of current medications was recorded for every participant, with particular attention to those associated with mitochondrial toxicity (eTable 1).15,16 Dietary restrictions, the use of dietary supplements, and sleep habits were not routinely assessed.
Ninety-six typically developing controls matched by age and sex participated in the study. Controls were recruited from community-based telemarketing lists of households in the same geographic regions as the ASD cohort. A detailed clinical interview was performed that included the Kiddie-Schedule for Affective Disorders and Schizophrenia for children or the Structured Clinical Interview for DSM-IV Axis I Disorders for adults.17, 18 Individuals with a current or past history of a psychiatric or neurological disorder were excluded. Control participants were also screened using the Social Communication Questionnaire and Social Responsiveness Scale.19 All control participants scored below threshold for ASD on these instruments (SRS cut-off: 70 for males and 65 for females 65; SCQ cut-off: 15 for both males and females). None of the control participants were taking prescription or over-the-counter medications; however, the use of dietary supplements was not assessed.
Each participant (or guardian) was asked to classify the participant’s race according to options defined by the investigator. Race was deemed to be relevant to this study because of differences in mitochondrial traits across races.
Participants were evaluated using the 4-subtest format of the Wechsler Abbreviated Scale of Intelligence (WASI).20 Intelligence testing was generally performed on the same day as the MRI scan and always occurred within one month of the MRI scan.
Magnetic Resonance Imaging
All MR data were acquired on a GE Signa 3 Tesla whole body scanner (Milwaukee, WI) equipped with an 8-channel surface coil for parallel imaging. Head positioning was standardized using cantho-meatal landmarks. No sedation was used at any time during the study. Participant faces were monitored during the scan using a video camera. A research assistant was present throughout the scan and confirmed that the participant was awake and resting quietly at the start and completion of each sequence. If the participant showed signs of anxiety or hyperventilation, the scan was immediately terminated and the data were not included in the study.
T1-weighted images
These were acquired using a three-dimensional spoiled gradient recalled sequence with repetition time (TR)=24ms, echo time (TE)=5ms, flip angle=110, number of excitation (NEX)=1, acquisition matrix in the axial plane=256x192, number of contiguous sagittal slices=approximately 182 (depending on brain dimensions) with 1 mm thickness without skip, field of view (FOV) in axial plane=25 x 25 cm2, reconstructed image matrix=256x256x182, and therefore the nominal voxel dimensions=0.98 mm x 0.98 mm x 1 mm.
Multi-Planar Spectroscopic Imaging (MPSI)
Proton MPSI quantifies endogenous brain chemistry and examines regional cellular metabolism and function. Using MPSI, we obtained spectroscopic measures of metabolites in contiguous 1 cubic-centimeter (cc) voxels throughout the brain. This non-invasive technique allows for the detection of lactate, which is generally considered pathological when detectable in cerebral tissue and which serves as a biomarker of cerebral mitochondrial dysfunction. Localizer images were acquired in 6 axial oblique slices (parallel to AC-PC line; one slice positioned below AC-PC) with TR=300 ms, TE=2.1 ms, FOV = 24 cm, Slice thickness=10·0 mm, Spacing=2.0 mm, NEX=1, Spectral width=31.25 MHz, Matrix=256x128 zero-padded to 256x256. The spectral data were acquired using the MPSI sequence in 6 axial oblique slices as prescribed by the localizer images using optimized parameters21: TE=144 ms, TR=2800 ms, FOV=24 x 24 cm2, slice thickness=10.0 mm, Spacing=2.0, Phase encodings=24x24, NEX=1, Spectral width=2000 Hz, Number of points =512, with outer volume lipid suppression and water suppression. Scan time, including shimming, was 30 minutes.
Preprocessing procedures
The entire raw dataset acquired by the 8-channel coil was separated into subsets for individual coils. The k-space data for each individual coil was multiplied by a Hamming window function for spatial filtering prior to spatial transform to suppress signal contamination stemming from the effect of the point spread function. We applied a two-dimensional fast Fourier transform to the data to transform it into image-space on a slice-wise basis. Water residues were removed using a high-pass filter. Time domain echoes were zero-filled to 2048 points, followed by application of a spectral fast Fourier transform to transform the time domain echoes into the spectral domain. For spectral registration, we set the frequency of the singlet of N-acetylaspartate (NAA) (the CH group) to 2.01 ppm. We then performed zero-order and first-order phase correction so that the three prominent singlets of NAA, creatine (Cr), and choline (Cho) were all in absorption (real) mode.
MPSI data quality and criteria for exclusion
Participant MPSI data were deemed unusable if they met any of the following criteria:
Signal-to-noise ratio (SNR) of NAA was less than 10 in the sensitive region of any single coil.
Linewidth was broad, manifesting as overlapping Cr and Cho signals (the value at which the peaks overlap was greater than 75% of the height of the lower peak), in more than 33% of the voxels in the sensitive region of the individual coil.
Motion artifact was substantial, manifesting as overall low SNR, broad linewidth, the presence of a large water residue, and lipid contamination. Using these criteria, 13 patient scans and 4 control scans were excluded from the study.
Rationale for screening the spectra of the component coils
We screened the spectra of individual coil components, instead of the spectra combined across all coil elements, for the following reasons: (1) The combination of the spectra of the coil array requires phase alignment across coils, a procedure that requires a reference signal. Although NAA is commonly used as a reference, we found that the SNRs of NAA varied widely across coils and the errors of the phases of NAA in the low sensitivity regions in some coils could be large because of the low SNRs of NAA, thereby likely introducing phase errors in the combined spectra that could adversely affect our ability to detect lactate peaks, which are phase sensitive. When combining spectra in absolute mode, phase alignment is not necessary; on the other hand, the valuable phase information of lactate, one of the important criteria for the detection of lactate, is lost. (2) Different coils may differ in their degree of lipid contamination because of their differing positions relative to the skull and the outer volume suppression (OVS) bands. Therefore, screening the spectra of individual coil components may allow us to detect lactate in one coil that has no lipid contamination and avoid obscuring it by combining it with the spectrum from another coil that contains severe lipid contamination (see eFigures 1–6 in the Supplement).
Criteria for defining lactate doublets
Each voxel (1 cc volume, 900–1200 per brain) was inspected visually for the presence of a lactate doublet by two trained personnel and then confirmed by a senior spectroscopy expert (all blind to participant characteristics). Lactate doublets were identified using operational criteria that emphasize the fundamental properties of the lactate doublet (Figure 1):
Figure 1. An example of spectra from a lactate-positive ASD participant.
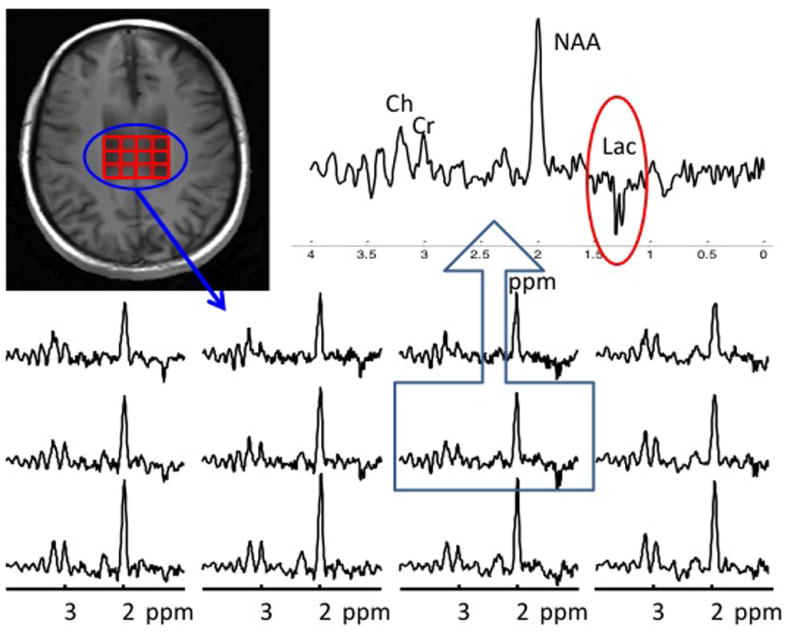
The localizer image shows lactate-positive voxels outlined in red. Individual spectra appear in the lower panel. One spectrum has been enlarged to clearly show the inverted doublet of lactate at 1.33 ppm.
The central frequency of the doublet must have been in the range of 1.31–1.35 ppm;
The doublet must have been inverted in phase-corrected real mode;
The separation of the doublet must have been 7 Hz.
In addition, putative lactate doublets must also have met the following criteria:
The amplitude of the lactate doublet was more than twice that of surrounding noise. The noise level was estimated peak-to-peak by visual inspection (but not through calculation of the standard deviation).
Adjacent voxels either within or across slices could not contain lipid contamination.
The lactate doublet must have been present in more than one channel, unless a clear and compelling explanation could account for its absence (e.g., weak signal due to the distance of the voxel from a particular coil, or the presence of lipid contamination in a particular coil that could impair visibility of the lactate peak).
The amplitude of the NAA peak must have been 10-fold higher than the surrounding noise; this did not apply to the ventricle region, where no NAA signal was visible.
Creatine and choline peaks were clearly separated.
Statistical Analyses
All statistical procedures were performed in SAS v.9.2 (SAS Institute Inc., Cary NC). A general linear model (PROC GLM) and frequency table (PROC FREQ) were used to compare the control and autism groups on study measures while covarying for age, sex, and FSIQ of the participants. All p-values were two-sided.
RESULTS
Lactate doublets were present at a significantly higher rate in ASD participants (13%) than in typically developing controls (1%) (p=.001), providing in vivo evidence for the presence of mitochondrial dysfunction in the brains of individuals with ASD (Table 1). Elevated lactate correlated significantly with age (p=.004) and was detected more often in adults (20%) than in children (6%). Its presence did not correlate, however, with sex, ASD subtype, intellectual ability, ADOS total score or subscores, or presence of comorbid neurological or psychiatric diagnoses (Table 2 and Table e1).
Table 1.
Participant Characteristicsa
| Group | Age mean (range) SD | Adult >18y N (%) | Female N (%) | Race N (%) | ASD subtype N (%) | FSIQ mean (range) SD | Lactate Doublets Present N (%) |
|---|---|---|---|---|---|---|---|
| TDC b (N=96) | 22.0y (5–54y) 12.7 | 51 (54%) | 34 (36%) | African American 19 (20%) Asian 2 (2%) Caucasian 54 (56%) Hispanic 17 (18%) Other 4 (4%) |
not applicable | 114 (80–140) | 1 (1%) |
| ASD (N=75) | 21.7y (5–60y) 11.7 | 41 (54%) | 17 (22%) | African American 4 (5%) Asian 3 (4%) Caucasian 54 (72%) Hispanic 8 (11%) Other 6 (8%) |
AD 5 (45%) Asp 3 (32%) PDD 2 (23%) |
107c (52–146) | 10 (13%) |
| ASD adult only (N=41) | 36.4y (19–60) 15.1 | 8 (20%) | Asian 2 (5%) Caucasian 34 (83%) Hispanic 1 (2%) Other 4 (10%) |
AD 17 (41%) Asp 20 (49%) PDD 4 (10%) |
108.5 (59–136) 20.5 | 8 (20%) | |
| ASD child only (N=34) | 9.8y (5–18y) 4.9 | 9 (26%) | African American 4 (12%) Asian 1 (3%) Caucasian 20 (59%) Hispanic 7 (21%) Other 2 (6%) |
AD 17 (50%) Asp 4 (12%) PDD 13 (38%) |
105.8 (52–146) 25.3 | 2 (6%) |
All participants were simplex cases.
TDC = typically developing control
FSIQ was not obtained in 9 ASD participants due to either scheduling conflicts or inability to comply with testing procedures.
Table 2.
Characteristics of ASD participants according to brain lactate statusa
| ASD Group | Age mean (range) | Adult >18y N (%) | Female N (%) | FSIQ mean (range) | ASD Subtype b | ADOS scores (SA/RBB/total) c | ADOS module N (%) |
|---|---|---|---|---|---|---|---|
| Lactate doublets present (n = 10) | 31.7 (5–59y) | 8 (80%) | 2 (20%) | 109 (79–132) | AD 5 (50%) Asp 3 (30%) PDD 2 (20%) |
9.6/2.3/11.9 | module 2 0 (0%) module 3 2 (20%) module 4 6 (60%) not tested 2 (20%) |
| Lactate doublets absent (n = 65) | 20.2 (5–60y) | 33 (51%) | 15 (23%) | 108 (52–146) | AD 29 (45%) Asp 21 (32%) PDD 15 (23%) |
9.4/1.9/11.3 | module 2 5 (8%) module 3 22 (34%) module 4 28 (43%) not tested 10 (15%) |
Percentages reflect the number of participants within the lactate-positive group or lactate-negative group with a particular characteristic
AD = Autistic Disorder; Asp = Asperger’s Disorder; PDD = Pervasive Developmental Disorder Not Otherwise Specified
SA = Social Affect; RRB = Restricted Repetitive Behavior; ADOS was not completed in 12 ASD participants for the following reasons: 1 participant displayed elective mutism; 11 participants had scheduling conflicts. All participants, however, were evaluated in detail clinically by a psychologist, psychiatrist, or neurologist with expertise in the diagnosis of ASD and met DSM-IV-TR criteria for ASD.
Our methods for data acquisition and analysis allowed us to map the anatomical location of lactate (Figure 2). In the ASD group, the location varied across individuals, but it seemed to aggregate preferentially within the cingulate gyrus. Lactate was also detected in subcortical gray matter nuclei, corpus callosum, superior temporal gyrus, pre- and post-central gyri, and cerebrospinal fluid. [Figure 2]
Figure 2. Lactate distribution in ASD participants.
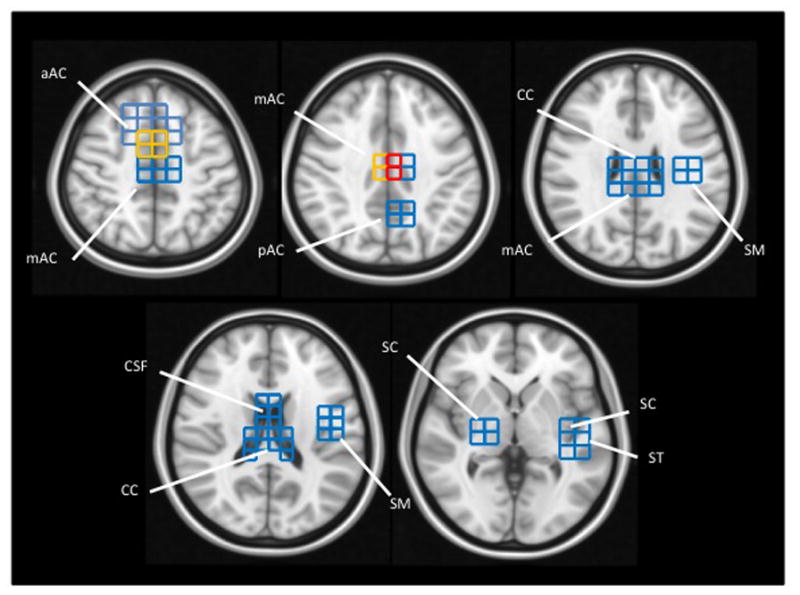
Lactate-positive voxels found across all ASD participants are projected onto brain templates (downloaded from http://www.bic.mni.mcgill.ca/ServicesAtlases/ICBM152NLin2009). Voxel color indicates the number of ASD participants with a lactate doublet: Blue = 1 participant; Yellow = 2 participants; Red = 3 participants.
aAC: anterior portion of the anterior cingulate gyrus
mAC: mid-portion of the anterior cingulate gyrus
pAC: posterior portion of the anterior cingulate gyrus
CC: corpus callosum
CSF: cerebrospinal fluid
ST: superior temporal gyrus
SC: subcortical nuclei, including putamen, globus pallidus, thalamus (and associated internal capsule)
SM: sensory and motor portions of the pre- and post-central gyri
DISCUSSION
This is the first study to demonstrate evidence for mitochondrial dysfunction in vivo in the brains of individuals with ASD. Our study yielded an overall prevalence estimate of 13% for ASD with concomitant mitochondrial dysfunction, but it was considerably higher (20%) for adults with ASD. These estimates are likely to be conservative, for several reasons. First, MRS has limited sensitivity to detect lactate (brain lactate may not be detected in vivo even in persons with definitive mitochondrial disease with cerebral involvement).22 Second, this study was biased toward inclusion of higher-functioning individuals (e.g., those who could comply with the requirements of a lengthy imaging study without sedation and those without identifiable genetic or metabolic abnormalities, a history of neurological injury, or uncontrolled seizures). If mitochondrial dysfunction is associated with greater symptom severity, then brain lactate may be underrepresented in our sample. Third, various technical limitations would tend to increase the false negative rate in our study. These technical limitations include the use of a pulse sequence that suppressed lipid incompletely, which may have obscured the lactate doublet in some participants, particularly in the cortex where lipid contamination from nearby scalp tissue is greatest (see Supplement). Finally, peripheral markers of mitochondrial dysfunction were not assessed in this study.
Although peripheral markers often do not correlate with elevated brain lactate on MRS imaging, their inclusion in future studies would help to better characterize the subgroup of individuals with ASD and mitochondrial dysfunction. This assessment is particularly important, given that studies of peripheral markers of mitochondrial dysfunction in ASD have detected much higher rates of mitochondrial dysfunction than did our study. 3, 5–9 Although elevated lactate is widely accepted as a biomarker of mitochondrial dysfunction, lactate elevation can arise from a variety of sources, including acute physiological changes (such as exercise, anxiety, hyperventilation, or trauma)23, 24, numerous disease states25, and medication use.15, 16 Our strict exclusion criteria and careful scanning procedures make such explanations less likely. Moreover, the lactate-positive and lactate-negative ASD groups did not differ significantly in their use of psychoactive medications. Indeed, only one individual in the lactate-positive ASD group was taking psychoactive medication (a combination of stimulants) (eTable 1). None of the lactate-positive individuals were taking neuroleptics or medications with established in vivo mitochondrial toxicity.15, 16
A key finding from this study is the higher rate of elevated brain lactate in ASD adults. This finding has at least two possible explanations. First, ascertainment bias could have contributed to these age-specific findings. Some children with ASD no longer meet diagnostic criteria as adults26, and mitochondrial dysfunction may be more frequent in those who meet diagnostic criteria into adulthood. Therefore, recruitment of clinically identified adults could preferentially recruit those who have mitochondrial dysfunction. Second, the age-specific findings could represent a worsening of mitochondrial function with aging.27
Regardless of its cause, our finding suggests that the inclusion of adults is important for understanding the complex role of mitochondrial dysfunction in ASD. Most prior studies of mitochondrial dysfunction in ASD, however, have excluded adults entirely.5–12 The bias toward studying children is understandable, given that the symptoms of ASD appear in early childhood and mitochondrial dysfunction has been implicated in some cases of autistic regression during the first years of life. Indeed, mitochondrial dysfunction has been detected in adults with a range of other chronic neurological and psychiatric disorders.28, 29 Determining the underlying cause of impaired mitochondrial function in ASD will require further investigation of children and adults and consideration of both primary causes of mitochondrial dysfunction (e.g., mutations in mitochondrial or nuclear genes that play a role in mitochondrial metabolism) and secondary causes (e.g., inflammation, neurodegeneration, and excess oxidative stress).
Our study not only demonstrated elevated brain lactate in ASD, but it also allowed us to map the distribution of lactate in the brain. The distribution varied from person to person, consistent with the well documented, heterogeneous distribution of mitochondrial dysfunction that contributes to highly variable symptoms and severity in individuals with mitochondrial disorders. Nevertheless, lactate-positive voxels in our sample were detected most frequently in the cingulate gyrus, a structure that supports higher-order control of thought, emotion, and behavior, and one in which both anatomical and functional disturbances have been reported previously in ASD.30, 31
CONCLUSIONS
Our use of more sensitive imaging technologies has allowed us to identify in vivo a biological subtype of ASD with mitochondrial dysfunction. Determining definitively whether impaired mitochondrial function in ASD is a primary abnormality or secondary to other causes, and whether its presence varies with age, clinical phenotype, natural history, or treatment response, will require further investigation. Our findings, however, suggest that individuals with ASD should undergo evaluation for mitochondrial dysfunction, as novel and promising treatments are under development for mitochondrial disorders.
Supplementary Material
Acknowledgments
This study was made possible by funding from the National Institutes of Health (NIMH R01 MH089582), the Tom Klingenstein and Nancy Perlman Family Fund, and the Suzanne Crosby Murphy endowment at Columbia University. The funders of the study had no role in the design and conduct of the study; collection, management, analysis, and interpretation of the data; or preparation, review, and approval of the manuscript. Dr. Bradley S. Peterson had full access to all of the data in the study and takes responsibility for the integrity of the data and the accuracy of the data analysis. Dr. Suzanne Goh is president of MitoMedical LLC, a nutritional supplement company. The other authors declare that they have no conflicts of interest.
Footnotes
Author Contributions: ZD and BP designed the study. SG, YZ, and ZD gathered data. SG, YZ, ZD, and BP analysed the data. SG, ZD, SD, and BP contributed to interpretation of the data. SG and ZD wrote the first draft of the manuscript. ZD created the figures. All authors contributed to review and revision of the manuscript and have seen and approved the final version.
Conflict of Interest Disclosures: Dr. Suzanne Goh is president of MitoMedical LLC, a nutritional supplement company. The other authors declare that they have no conflicts of interest.
References
- 1.American Psychiatric Association. Diagnostic and statistical manual of mental disorders. 4. Washington, DC: American Psychiatric Press; 1994. [Google Scholar]
- 2.Persico AM, Napolioni V. Autism genetics. Behavioural Brain Research. 2013;251:95–112. doi: 10.1016/j.bbr.2013.06.012. [DOI] [PubMed] [Google Scholar]
- 3.Rossignol DA, Frye RE. Mitochondrial dysfunction in autism spectrum disorders: a systematic review and meta-analysis. Mol Psychiatry. 2012;17(3):290–314. doi: 10.1038/mp.2010.136. [DOI] [PMC free article] [PubMed] [Google Scholar]
- 4.Palmieri L, Persico AM. Mitochondrial dysfunction in autism spectrum disorders: cause or effect? Biochimica et Biophysica Acta. 2010;1797(6–7):1130–1137. doi: 10.1016/j.bbabio.2010.04.018. [DOI] [PubMed] [Google Scholar]
- 5.Giulivi C, Zhang Y, Omanska-Klusek A, et al. Mitochondrial dysfunction in autism. JAMA. 2010;304(21):2389–2396. doi: 10.1001/jama.2010.1706. [DOI] [PMC free article] [PubMed] [Google Scholar]
- 6.Oliveira G, Diogo L, Grazina M, et al. Mitochondrial dysfunction in autism spectrum disorders: a population-based study. Dev Med Child Neurol. 2005;47(3):185–189. doi: 10.1017/s0012162205000332. [DOI] [PubMed] [Google Scholar]
- 7.Correia C, Coutinho AM, Diogo L, et al. Brief report: High frequency of biochemical markers for mitochondrial dysfunction in autism: no association with the mitochondrial aspartate/glutamate carrier SLC25A12 gene. J Autism Dev Diord. 2006;36(8):1137–1140. doi: 10.1007/s10803-006-0138-6. [DOI] [PubMed] [Google Scholar]
- 8.Tang G, Gutierrez Rios P, Kuo SH, et al. Mitochondrial abnormalities in temporal lobe of autistic brain. Neurobiol Dis. 2013;54:349–361. doi: 10.1016/j.nbd.2013.01.006. [DOI] [PMC free article] [PubMed] [Google Scholar]
- 9.Chauhan A, Gu F, Essa MM, et al. Brain region-specific deficit in mitochondrial electron transport chain complexes in children with autism. J Neurochem. 2011;117(2):209–220. doi: 10.1111/j.1471-4159.2011.07189.x. [DOI] [PMC free article] [PubMed] [Google Scholar]
- 10.Chugani DC, Sundram BS, Behen M, Lee ML, Moore GJ. Evidence of altered energy metabolism in autistic children. Prog Neuro-Psychopharmacol Biol Psychiat. 1999;23(4):635–641. doi: 10.1016/s0278-5846(99)00022-6. [DOI] [PubMed] [Google Scholar]
- 11.Friedman SD, Shaw DW, Artru AA, et al. Regional brain chemical alterations in young children with autism spectrum disorder. Neurology. 2003;60(1):100–107. doi: 10.1212/wnl.60.1.100. [DOI] [PubMed] [Google Scholar]
- 12.Corrigan NM, Shaw DW, Richards RL, et al. Proton magnetic resonance spectroscopy and MRI reveal no evidence for brain mitochondrial dysfunction in children with autism spectrum disorder. J Autism Dev Disord. 2012;42(1):105–115. doi: 10.1007/s10803-011-1216-y. [DOI] [PubMed] [Google Scholar]
- 13.Lord C, Rutter M, Le Couteur A. Autism Diagnostic Interview-Revised: a revised version of a diagnostic interview for caregivers of individuals with possible pervasive developmental disorders. J Autism Dev Disord. 1994;24(5):659–685. doi: 10.1007/BF02172145. [DOI] [PubMed] [Google Scholar]
- 14.Lord C, Risi S, Lambrecht L, et al. The autism diagnostic observation schedule-generic: a standard measure of social and communication deficits associated with the spectrum of autism. J Autism Dev Disord. 2000;30(3):205–223. [PubMed] [Google Scholar]
- 15.Parikh S, Saneto R, Falk MJ, et al. A modern approach to the treatment of mitochondrial disease. Curr Treatment Opt Neurol. 2009;11(6):414–430. doi: 10.1007/s11940-009-0046-0. [DOI] [PMC free article] [PubMed] [Google Scholar]
- 16.Modica-Napolitano JS, Lagace CJ, Brennan WA, Aprille JR. Differential effects of typical and atypical neuroleptics on mitochondrial function in vitro. Arch Pharm Res. 2003;26(11):951–959. doi: 10.1007/BF02980205. [DOI] [PubMed] [Google Scholar]
- 17.Kaufman J, Birmaher B, Brent D, et al. Schedule for affective disorders and schizophrenia for school-age children-present and lifetime version (K-SADS-PL): initial reliability and validity data. J Am Acad Child Adolesc Psychiatry. 1997;36(7):980–988. doi: 10.1097/00004583-199707000-00021. [DOI] [PubMed] [Google Scholar]
- 18.Spitzer RL, Williams JBW, Gibbon M, First MB. The structured clinical interview for DSM-III-R (SCID). I: History, rationale, and description. Arch Gen Psychiatry. 1992;49(8):624–629. doi: 10.1001/archpsyc.1992.01820080032005. [DOI] [PubMed] [Google Scholar]
- 19.Norris M, Lecavalier L. Screening accuracy of Level 2 autism spectrum disorder rating scales. A review of selected instruments. Autism. 2010;14(4):263–284. doi: 10.1177/1362361309348071. [DOI] [PubMed] [Google Scholar]
- 20.Wechsler D. Wechsler Abbreviated Scale of Intelligence. New York, NY: Harcourt Brace & Company; 1999. [Google Scholar]
- 21.Duyn JH, Gillen J, Sobering G, van Zijl PC, Moonen CT. Multisection proton MR spectroscopic imaging of the brain. Radiology. 1993;188(1):277–282. doi: 10.1148/radiology.188.1.8511313. [DOI] [PubMed] [Google Scholar]
- 22.Lin DD, Crawford TO, Barker PB. Proton MR spectroscopy in the diagnostic evaluation of suspected mitochondrial disease. AJNR. 2003;24(1):33–41. [PMC free article] [PubMed] [Google Scholar]
- 23.Dager SR, Layton ME, Strauss W, et al. Human brain metabolic response to caffeine and the effects of tolerance. Am J Psychiatry. 1999;156(2):229–237. doi: 10.1176/ajp.156.2.229. [DOI] [PubMed] [Google Scholar]
- 24.Dager SR, Strauss WL, Marro KI, Richards TL, Metzger GD, Artru AA. Proton magnetic resonance spectroscopy investigation of hyperventilation in subjects with panic disorder and comparison subjects. Am J Psychiatry. 1995;152(5):666–672. doi: 10.1176/ajp.152.5.666. [DOI] [PubMed] [Google Scholar]
- 25.Chow SL, Rooney ZJ, Cleary MA, Clayton PT, Leonard JV. The significance of elevated CSF lactate. Arch Dis Child. 2005;90(11):1188–1189. doi: 10.1136/adc.2005.075317. [DOI] [PMC free article] [PubMed] [Google Scholar]
- 26.Fein D, Barton M, Eigsti IM, et al. Optimal outcome in individuals with a history of autism. J Child Psychol Psychiatry. 2013;54(2):195–205. doi: 10.1111/jcpp.12037. [DOI] [PMC free article] [PubMed] [Google Scholar]
- 27.Beal MF. Mitochondria take center stage in aging and neurodegeneration. Ann Neurol. 2005;58(4):495–505. doi: 10.1002/ana.20624. [DOI] [PubMed] [Google Scholar]
- 28.Manji H, Kato T, Di Prospero NA, et al. Impaired mitochondrial function in psychiatric disorders. Nat Rev Neurosci. 2012;13(5):293–307. doi: 10.1038/nrn3229. [DOI] [PubMed] [Google Scholar]
- 29.Lezi E, Swerdlow RH. Mitochondria in neurodegeneration. Adv Exp Med Biol. 2012;942:269–286. doi: 10.1007/978-94-007-2869-1_12. [DOI] [PMC free article] [PubMed] [Google Scholar]
- 30.Matsumoto K, Tanaka K. Neuroscience. Conflict and cognitive control. Science. 2004;303(5660):969–970. doi: 10.1126/science.1094733. [DOI] [PubMed] [Google Scholar]
- 31.Stigler KA, McDonald BC, Anand A, Saykin AJ, McDougle CJ. Structural and functional magnetic resonance imaging of autism spectrum disorders. Brain Res. 2011;1380:146–161. doi: 10.1016/j.brainres.2010.11.076. [DOI] [PMC free article] [PubMed] [Google Scholar]
Associated Data
This section collects any data citations, data availability statements, or supplementary materials included in this article.