

Abstract
Although efforts to understand the basis for inter-strain phenotypic variation in the most virulent malaria species, Plasmodium falciparum, have benefited from advances in genomic technologies, there have to date been few metabolomic studies of this parasite. Using 1H-NMR spectroscopy, we have compared the metabolite profiles of red blood cells infected with different P. falciparum strains. These included both chloroquine-sensitive and chloroquine-resistant strains, as well as transfectant lines engineered to express different isoforms of the chloroquine-resistance-conferring pfcrt (P. falciparum chloroquine resistance transporter). Our analyses revealed strain-specific differences in a range of metabolites. There was marked variation in the levels of the membrane precursors choline and phosphocholine, with some strains having >30-fold higher choline levels and >5-fold higher phosphocholine levels than others. Chloroquine-resistant strains showed elevated levels of a number of amino acids relative to chloroquine-sensitive strains, including an approximately 2-fold increase in aspartate levels. The elevation in amino acid levels was attributable to mutations in pfcrt. Pfcrt-linked differences in amino acid abundance were confirmed using alternate extraction and detection (HPLC) methods. Mutations acquired to withstand chloroquine exposure therefore give rise to significant biochemical alterations in the parasite.
Keywords: 1H-NMR, chloroquine resistance, HPLC, malaria, metabolomics, PfCRT
Abbreviations: CQ, chloroquine; CQR, CQ-resistant; CQS, CQ-sensitive; cRBC, co-cultured red blood cell; DV, digestive vacuole; GABA, 4-aminobutyrate; iRBC, infected red blood cell; PfCRT, Plasmodium falciparum chloroquine resistance transporter; RBC, red blood cell; TCA, tricarboxylic acid; TSP, trimethylsilyl-2,2,3,3-tetradeuteropropionic acid; uRBC, uninfected red blood cell
Short abstract
The metabolite profiles of red blood cells infected with different malaria parasite strains were compared. Amino acid profiles varied with the chloroquine resistance status of the strain, and this was linked specifically to mutations in the parasite's chloroquine resistance transporter.
INTRODUCTION
Malaria, an ancient disease caused by protozoan Plasmodium parasites, continues to inflict a devastating toll in many parts of the world. Plasmodium falciparum, the most virulent of the malaria parasite species infectious to humans, has a demonstrated ability to evolve in response to pressures exerted by drug treatments and host immune responses. Many strains of P. falciparum have been isolated from different parts of the world and their phenotypes (e.g., drug susceptibility profiles, growth rates and transmissibility) investigated. Work on understanding the molecular basis for important phenotypic differences is underway and has benefited from advances in genomic, transcriptomic and proteomic technologies [1]. Recent years have seen the first reported ‘metabolomic’ analyses of malaria parasite strains [2–5]. However, to date, no untargeted metabolomic comparisons of genetically divergent strains have been reported.
One P. falciparum adaptation that represented a significant setback to malaria control efforts was the acquisition of CQ (chloroquine) resistance. The synthetic drug CQ was cheap, safe and unusual in that it remained effective for decades, despite having been deployed as a monotherapy on a massive scale. However, CQR (CQ-resistant) parasites eventually arose in several locations, and they subsequently disseminated throughout most malaria-endemic areas [6,7], rendering CQ largely ineffective.
CQ resistance is associated with mutations in PfCRT (P. falciparum chloroquine resistance transporter) [8], a 424 amino acid integral membrane protein. PfCRT localizes to the membrane of the parasite's internal DV (digestive vacuole) [8,9], an acidic organelle in which haemoglobin endocytosed from the host RBC (red blood cell) is catabolized, releasing peptides and haem. CQ accumulates to high concentrations in this compartment through a combination of weak-base trapping and haem binding [10], and is believed to kill the parasite by inhibiting the process by which toxic haem monomers are converted into inert haemozoin crystals [11]. Expression of wild-type PfCRT and a mutant form of the protein (from the CQR Dd2 strain) in Xenopus laevis oocytes revealed that the mutant protein mediates CQ transport, whereas the wild-type protein does not [12]. This is consistent with previous biochemical studies that had provided indirect evidence for mutant PfCRT-mediated CQ efflux from the DV [13–15], and explains (at least in part) the reduced intravacuolar CQ accumulation observed in parasites with mutant PfCRT [10].
Much remains to be learned about what impact PfCRT mutations have on the parasite, beyond enabling it to withstand higher CQ concentrations. It is clear that mutations in PfCRT affect the susceptibility of the parasite to a number of other antimalarial drugs [16] and to a diverse range of other compounds [17], and there is indirect evidence for the transport of a range of drugs and ‘chloroquine resistance reversers’ by mutant forms of the protein [18,19]. Moreover, a number of these drugs and compounds have been shown to interact with mutant PfCRT in the Xenopus oocyte system (reviewed in [20]). This suggests that mutations in PfCRT have broadened the substrate specificity of the transporter well beyond that required to accommodate CQ. Furthermore, there are differences in the proteomes [21] and gene expression levels [22] of CQS (CQ-sensitive) and CQR parasites, suggesting that PfCRT mutations may have wide-reaching impacts on parasite biology. Attempts to disrupt the pfcrt gene have been unsuccessful [23], consistent with PfCRT performing a function that is essential for parasite survival. It remains unclear what this function is, or what the natural substrate(s) of PfCRT might be.
In this study, we have used a combination of 1H-NMR and HPLC analyses to compare metabolite profiles of uRBCs (uninfected RBCs) and RBCs infected with different strains of P. falciparum. The analyses included parasites expressing different isoforms of PfCRT, allowing us to gain insight into the biochemical consequences of mutations in this transporter.
EXPERIMENTAL
Cells and techniques
Seven strains of P. falciparum were examined in this study. 3D7 (isolated in the Netherlands but possibly of African origin [24]) and D10 (from Papua New Guinea) are laboratory-adapted CQS strains, while 7G8 (from Brazil) and K1 (from Thailand) are laboratory-adapted CQR strains. C2GC03, C4Dd2 and C67G8 (a gift from Professor David Fidock) are transfectant lines generated using GC03 [16], a CQS progeny of the HB3×Dd2 cross [25]. The C4Dd2 and C67G8 lines were generated by replacing the wild-type pfcrt allele in GC03 with the CQ resistance-conferring mutant alleles of pfcrt from the Dd2 strain (of Thai origin) and the 7G8 strain, respectively. C67G8 contains an additional I351 M mutation in PfCRT that does not occur in 7G8 parasites [18]. The C2GC03 line is a CQS recombinant control line that expresses the wild-type pfcrt coding sequence.
The use of human blood in this study was approved by the Australian National University's Human Research Ethics Committee.
Parasites were cultured as described previously [26], and synchronized by sorbitol treatment [27]. The ‘parasite culture medium’ consisted of RPMI supplemented with HEPES (25 mM), additional glucose (10 mM, giving a final concentration of 20 mM), gentamicin sulfate (24 mg l−1), hypoxanthine (0.2 mM) and Albumax II (0.6% w/v). The pfcrt transfectant lines were maintained in the presence of the selection agents blasticidin (5 μM; Life Technologies) and WR99210 (5 nM; Jacobus Pharmaceuticals). Experiments were conducted on mature intact trophozoite-iRBCs (infected RBCs).
iRBCs were separated from the uninfected cells present in the cultures [henceforth referred to as cRBCs (‘co-cultured’ RBCs)] using a magnet (either a VarioMACS Separator with a CS column or a SuperMACS II Separator with a D column; Miltenyi Biotec), essentially as described previously [5]. Briefly, the cells were centrifuged and resuspended in PBS (pH 7.4) supplemented with 0.5% (w/v) Albumax II and 20 mM glucose immediately before being passed through a column placed within the separation unit's magnetic field. The iRBCs were retained on the column whereas the cRBCs flowed through. After the cRBCs were eluted (with the solution described above), the iRBCs (>95% parasitaemia for NMR analysis; ≥92% for HPLC analysis) were recovered from the column. For experiments on cRBCs, ~3 ml of eluate was collected from the column, while it was in the magnetic field. There was <5% contamination of this predominantly cRBC suspension with iRBCs. For experiments on uRBCs that had been cultured (for ~48 h at 37°C in parasite culture medium) in separate flasks not containing iRBCs (henceforth referred to as uRBCs), the cells were also passed through the column placed within the magnetic field and the eluate collected.
After passing through the column the cells (iRBCs, cRBCs or uRBCs) were, in all cases, resuspended (typically at a density of 1–4×10⁸ cells/50 ml) in parasite culture medium, and were allowed to recover at 37°C, typically for 1 h, but in some cases for up to 4 h. HPLC experiments using iRBCs sampled 1, 2, 3 and 5.5 h post-magnet-enrichment revealed that amino acid levels remained approximately constant throughout this time period (results not shown). This suggests that a 1 h recovery time was adequate and, furthermore, that minor differences in the average age of the trophozoite–iRBC population between experiments would not give rise to significant variation in the metabolite levels.
At the end of the recovery period, the cell suspensions (in 50 ml tubes) were cooled to 4°C within 80 s in a dry-ice/ethanol bath, and then centrifuged (700×g, 3 min) at 4°C to sediment the cells. The supernatant solutions were aspirated, and the pellets were resuspended in ice-cold PBS (not supplemented with glucose or Albumax II; ~50 ml) before being centrifuged again as above. The washed cells were then resuspended in a known volume (1–2 ml) of ice-cold PBS and a sample (10 μl) was taken for cell counting (using an improved Neubauer counting chamber) before pelleting the cells by centrifugation (5000×g, 1 min) at 4°C. The supernatant solutions were removed, and the pellets frozen immediately by transferring to liquid nitrogen. The frozen pellets were stored at −80°C prior to extraction.
Extraction of metabolites
For the 1H-NMR studies, the metabolites were extracted using HClO4, which has previously been shown to have advantages over other extraction media [5]. Ice-cold HClO4 (5% w/v; 800 μl) was added to each of the frozen pellets and the samples were transferred to an ultrasonic bath for 20 min, with mixing (30 s using a vortex) at 5 and 15 min. At the end of the 20 min the samples were centrifuged (20800×g, 10 min) and the supernatant solutions were collected and approximately neutralized by the addition of 10 M KOH. The samples were then centrifuged at 20800×g for 10 min to remove the precipitated KClO4. The supernatant solutions were adjusted to approximately pH 7.0 by addition of 1 M HCl or KOH, centrifuged again to remove the precipitate (when necessary) then freeze dried and stored at −20°C until analysis.
For HPLC (performed primarily to analyse amino acid levels in iRBCs), methanol was used for extraction. It has been shown previously that methanol and HClO4 extract most amino acids with comparable efficiency [5]. First, the non-naturally occurring amino acid benzylserine (dissolved in methanol) was added to the pellets as a reference compound, in an amount proportional to the number of iRBCs in the sample (3.26 mmol per 107 iRBCs). HPLC-grade methanol (300 μl) was then added. The samples were mixed by vortexing, and then incubated at 70°C for 20–25 min, with vortexing every ~5 min. They were then centrifuged (13300×g, 10 min) and the supernatant solutions were filtered into HPLC vials. The methanol was evaporated using a Genevac miVac Duo concentrator (~100 min) and the samples stored at −20°C prior to derivatization.
NMR analysis
The freeze-dried extracts were dissolved in a known volume of D2O (500–600 μl) buffered at pH 7.0 with 100 mM phosphate, with TSP (trimethylsilyl-2,2,3,3-tetradeuteropropionic acid) added at a concentration of 0.145 mM. TSP was used both as an internal chemical shift reference (0 ppm) and as an intensity reference. The pH of the dissolved NMR samples was further adjusted to neutral when necessary, using small volumes of DCl or NaOD (<5 μl). The samples were centrifuged for 5 min at 16100×g to remove any insoluble material, and 490–550 μl of the supernatant solutions were transferred to Wilmad NMR tubes (5 mm OD) for 1H-NMR analysis.
The 1H-NMR spectra were acquired and processed essentially as described previously [5], with 16–128 free induction decays collected over a spectral width of 12 ppm and an acquisition time of 4 s, with a 1 s relaxation delay. Concentrations of metabolites in the NMR samples were estimated by importing the spectra into the Chenomx NMR suite (4.6 or 5.0) [28]. This software uses the known concentration of a reference compound (TSP in this study) to determine the concentrations of other compounds. The Chenomx NMR program, to which a number of compounds had been added previously [5] and to which 2,3-bisphosphoglycerate (5 mM with TSP at 1 mM) was added for the purpose of this study, was able to fit almost all of the peaks in the spectra. The identity of sorbitol was confirmed by addition of an authenticated standard. The peak assignments for myoinositol and acetate were confirmed in 2D NMR [HSQC (heteronuclear single-quantum coherence)] analyses of parasite extracts, as described in our previous study [5]. The peak assignments for sarcosine and formate were reliant on a limited number of spectral signals and should be regarded as tentative. The signal-to-noise ratios of the lowest intensity signals from which metabolite concentrations were estimated were typically>6 (Supplementary Figure S1).
HPLC analysis
The freeze-dried extracts were dissolved in 95 μl of 100 mM sodium bicarbonate (in water, pH 9) and sonicated for 30 s to ensure complete solubilization of the pellets. A 5-μl aliquot of 10 mM TNBS (2,4,6-trinitrobenzenesulfonic acid, used to derivatize, and thus allow HPLC-detection of compounds containing amino groups [29]) in methanol was added and the samples were then incubated for 2 h at 37°C.
The derivatized samples were analysed using a Dionex Ultimate 3000 RSLC system. The analytes were separated on a Grace Vision HT C18 HL column (1.5 μm, 2.0×100 mm) at 35°C, using a flow rate of 0.5 ml/min with 100 mM ammonium acetate in water, pH 7 (A), and acetonitrile (B) as the mobile phase. The mobile phase gradient was set up as follows: 0 min: 90% A and 10% B, 10 min: 50% A and 50% B, 12–14 min: 100% B, 15–20 min: 90% A and 10% B. The derivatized compounds were detected at 335 nm using a Dionex Diode Array Detector.
Measurements of radiolabelled aspartate and CQ uptake in X. laevis oocytes expressing PfCRT or rat GLAST (glutamate–aspartate transporter)
In vitro transcription, oocyte preparation and microinjection of PfCRT cRNA (20 ng per oocyte) and GLAST cRNA (5 ng per oocyte) were performed as described elsewhere [12,30]. GLAST cRNA was a gift from Professor Stefan Bröer [31]. [3H]CQ (0.25 μM; 20 Ci/mmol) and [14C]L-aspartate (6.4 μM; 217 mCi/mmol) uptake by oocytes was measured (3–5 days post-injection) as described previously [30] over 2 h at 27.5°C, and in a medium that, unless specified otherwise, contained 96 mM NaCl, 2 mM KCl, 1 mM MgCl2, 1.8 mM CaCl2, 10 mM MES and 10 mM Tris-base (pH 5.5). [3H]CQ uptake was measured in the presence of 15 μM unlabelled CQ.
RESULTS
1H-NMR estimates of metabolite amounts in uRBCs and P. falciparum-iRBCs
In initial experiments, the metabolite profile of iRBCs (infected with 3D7 parasites) was compared with that of cRBCs cultured in the same flask, as well as with that of uRBCs (from the same batch) cultured concurrently in a separate flask. Six independent experiments were performed with O+ blood from four different donors, with the blood having been stored at 4°C for 6–23 days prior to use.
Representative 1H-NMR spectra of HClO4 extracts derived from iRBCs, cRBCs and uRBCs are shown in Figure 1. Overall, more than 40 metabolites were identified in the 1H-NMR analysis. These included amino acids, GSSG, nucleotides, soluble phospholipid precursors, carboxylates, polyamines and HEPES (Table 1). GSH was not detected, consistent with it having been oxidized to GSSG during the preparation of samples for NMR analysis, as noted previously [5]. Glucose was not detected in the 3D7 iRBCs and the amount detected in uRBCs and cRBCs was highly variable. Low levels of glucose were detected in some, but not all, of the extracts obtained from RBCs infected with other parasite strains (see Table 3); again, the amounts detected were highly variable. The absence of glucose from most, although not all, samples, and the high degree of variability seen, is most likely due to the rapid loss of glucose during sample preparation. Glucose is unusually susceptible to loss during sample preparation because: (i) it traverses the parasite and erythrocyte plasma membranes extremely rapidly (on a timescale of a few seconds under physiological conditions [5,32]); and (ii) in the case of iRBCs, it is consumed by the parasite's primary means of energy generation, glycolysis, at a very high rate. Although the cells were cooled to 4°C before processing, and this will have slowed both transport and metabolism, there will have been residual levels of both activities operating throughout the sample preparation procedure, leading to the loss of glucose.
Figure 1. Representative 1H-NMR spectra of HClO4 extracts of iRBCs (top), cRBCs (middle) and uRBCs (bottom).
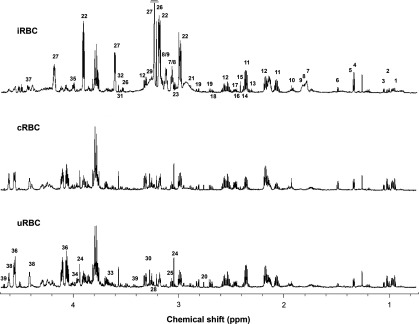
1. Leucine, 2. Isoleucine, 3. Valine, 4. Lactate, 5. Threonine, 6. Alanine, 7. Putrescine, 8. Spermidine, 9. Spermine, 10. Acetate, 11. Glutamate, 12. Oxidized glutathione, 13. 4-Aminobutyrate, 14. Pyruvate, 15. Succinate, 16. α-Ketoglutarate, 17. Glutamine, 18. Malate, 19. Aspartate, 20. Sarcosine, 21. Asparagine, 22. HEPES, 23. Lysine, 24. Creatine, 25. Ornithine, 26. Choline, 27. Phosphocholine, 28. Carnitine, 29. Arginine, 30. Betaine, 31. myo-Inositol, 32. Glycine, 33. Sorbitol, 34. Serine, 35. Phosphoethanolamine, 36. 2,3-Bisphosphoglycerate, 37. NAD+, 38. ATP, 39. Glucose. Other metabolites listed in Table 1 are not in the region shown. The horizontal bar in the top panel signifies that the peak was truncated.
Table 1. Metabolite amounts in uRBCs, cRBCs and RBCs infected with 3D7 trophozoites (iRBCs).
The metabolite amounts (μmol per 1012 cells; obtained by 1H-NMR) are the means (shown ±S.D.) from 6 independent cell preparations (obtained on different days). The cRBC preparations contained up to 5% contamination with iRBCs and the iRBC preparations had up to 5% contamination with cRBCs. Depending on the metabolite, the amounts presented here are all within 95%-109% of the values that would have been obtained had the cell preparations been 100% pure. nd, not detected in some or all replicates. aP<0.001, bP<0.01 and cP<0.05, compared to uRBC, from one-way ANOVA tests using the natural logarithm transformed data (nd data excluded). The P values were corrected for multiple hypothesis testing using the False Discovery Rate (FDR) method of Benjamini and Hochberg [51]. Red shading: more abundant in iRBCs than in uRBCs; green shading: less abundant in iRBCs than in uRBCs.
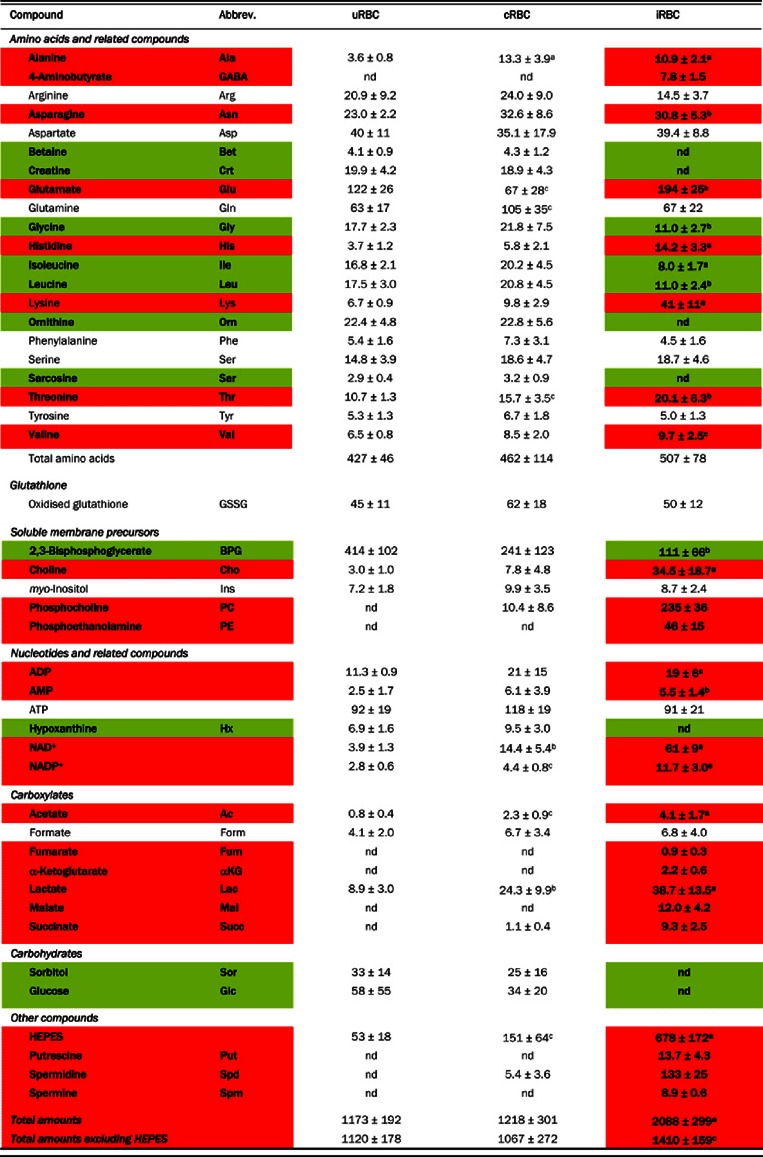 |
Table 3. Metabolite amounts in RBCs infected with mature trophozoite-stage pfcrt transfectant parasites.
The amounts (μmol per 1012 cells; obtained with 1H-NMR) are from the indicated number of independent cell preparations (obtained on different days), and are shown as means±S.D. The amounts shown are derived from cell preparations with up to 5% contamination with cRBCs. a: P<0.001; b: P<0.01 and c: P<0.05 from FDR-adjusted one-way ANOVA tests using the natural logarithm transformed data (see Table 1). Metabolites for which there were significant differences in abundance among lines are shown in bold.
| ANOVA | C2GC03 | C4Dd2 | C67G8 | |
|---|---|---|---|---|
| No.of independent cultures | 9 | 8 | 7 | |
| CQ resistance status | CQS | CQR | CQR | |
| Amino acids | ||||
| Alanine | b | 15.2±4.5 | 20.8±6.6 | 26.7±3.4 |
| 4-Aminobutyrate | 4.7±2.7 | 4.8±1.4 | 3.6±1.1 | |
| Arginine | c | 24.8±7.5 | 27.9±6.7 | 16.8±6.6 |
| Asparagine | a | 22.6±4.5 | 39.0±8.8 | 42±9 |
| Aspartate | a | 54±5 | 105±30 | 102±26 |
| Glutamate | b | 163±26 | 148±34 | 105±24 |
| Glutamine | a | 44±10 | 66±10 | 79±21 |
| Glycine | a | 12.8±2.5 | 24.1±5.8 | 27.2±1.5 |
| Histidine | b | 14.4±5.9 | 21.2±5.4 | 25.0±5.2 |
| Isoleucine | a | 7.4±1.2 | 10.4±1.2 | 12.3±1.9 |
| Leucine | a | 10.7±1.9 | 18.5±3.8 | 24.3±13.3 |
| Lysine | 31.8±7.5 | 29.1±12.1 | 28.4±6.0 | |
| Phenylalanine | 9.0±6.3 | 8.4±3.6 | 6.5±2.2 | |
| Serine | a | 13.3±3.0 | 22.3±4.0 | 25.3±4.5 |
| Threonine | b | 15.3±2.6 | 20.4±4.4 | 22.4±4.5 |
| Tyrosine | b | 4.4±0.7 | 6.5±1.5 | 7.0±1.3 |
| Valine | b | 6.9±1.0 | 10.2±2.6 | 9.4±1.0 |
| Total amino acids | b | 454±52 | 582±89 | 562±62 |
| Glutathione | ||||
| GSSG | 43±7 | 41±6 | 47±6 | |
| Soluble membrane precursors | ||||
| 2,3-Bisphosphoglycerate | 122±40 | 146±39 | 183±61 | |
| Choline | 69±14 | 70±15 | 80±38 | |
| myo-Inositol | c | 9.4±6.3 | 9.7±1.3 | 15.2±3.4 |
| Phosphocholine | 301±85 | 226±93 | 253±117 | |
| Phosphoethanolamine | 52±15 | 49±20 | 55±23 | |
| Nucleotides and related compounds | ||||
| ADP | 18.0±4.5 | 15.9±2.5 | 19.7±8.6 | |
| ATP | 114±19 | 111±22 | 127±22 | |
| NAD+ | 42±7 | 35.4±12.7 | 51±15 | |
| NADP+ | 4.0±0.7 | 4.4±1.2 | 4.5±0.3 | |
| Carboxylates | ||||
| Acetate | 10.3±9.0 | 7.0±3.8 | 15.6±8.1 | |
| Formate | 8.6±6.2 | 9.1±5.5 | 8.5±4.8 | |
| Fumarate | 1.0±0.4 | 0.8±0.5 | 1.2±0.6 | |
| α-Ketoglutarate | 2.5±0.7 | 3.6±1.1 | 2.6±1.0 | |
| Lactate | 36.3±14.5 | 38.5±10.5 | 43±11 | |
| Malate | 13.3±8.7 | 13.7±3.2 | 10.7±4.5 | |
| Succinate | a | 7.7±1.5 | 4.0±1.7 | 3.7±0.5 |
| Other compounds | ||||
| HEPES | c | 446±39 | 479±92 | 1024±577 |
| Putrescine | 14.3±3.6 | 10.0±5.8 | 9.4±6.0 | |
| Spermidine | c | 144±29 | 101±30 | 87±37 |
| Spermine | a | 9.9±1.9 | 22.2±11.6 | 27.2±9.1 |
| Glucose | 6.3±8.5 | 25.6±31.0 | 38.7±53.9 | |
| Total amounts | 1927±227 | 2005±309 | 2669±851 | |
| Total amounts excluding HEPES | 1481±212 | 1526±255 | 1646±283 | |
Calculation of the ‘energy charge ratio’ [(ATP+0.5 ADP)/(ATP+ADP+AMP)] using the averaged data from Table 1 yielded values of 0.92, 0.89 and 0.87 for uRBCs, cRBCs and iRBCs, respectively. These all fall within the normal range (0.85–0.95) for cells dependent on glycolysis [33], consistent with the cells having been in good condition prior to extraction.
The metabolite profiles of uRBCs and cRBCs were similar to one another, but quite different from the metabolite profile of iRBCs (Figure 1 and Table 1). In particular, the γ-amino acid GABA (4-aminobutyrate), the phospholipid precursors phosphocholine and phosphoethanolamine, the TCA (tricarboxylic acid) cycle intermediates fumarate, α-ketoglutarate, malate and succinate, and the polyamines putrescine, spermidine and spermine, were all undetectable by 1H-NMR in uRBCs but present in iRBCs. Conversely, betaine, creatine, hypoxanthine, ornithine, sarcosine and sorbitol were detected by 1H-NMR in uRBCs and cRBCs but not in iRBCs (note however that ornithine was detectable in iRBCs by HPLC; below).
Some compounds were present in all three cell types, but were significantly more abundant in iRBCs than in either of the uRBC populations (Table 1). HEPES (the most abundant solute in iRBCs) was one such compound, consistent with this exogenous buffering agent (used widely for the in vitro culture of malaria parasites) being taken up by the parasite, as shown previously in a study of D10 parasites isolated from their host RBCs [5]. Other compounds significantly more abundant in iRBCs than in uRBCs or cRBCs included the amino acids glutamate, histidine, lysine and threonine, as well as choline, NAD+ and NADP+ and acetate. Alanine and lactate were elevated in both iRBCs and cRBCs relative to uRBCs. Conversely, isoleucine and leucine were less abundant in iRBCs than in uRBCs and cRBCs. 2,3-Bisphosphoglycerate was significantly less abundant in cRBCs than in uRBCs, and was less abundant still in iRBCs, consistent with a previous study [34].
1H-NMR estimates of metabolite amounts in RBCs infected with different P. falciparum strains
Using 1H-NMR the intracellular amounts of 39 metabolites were estimated for a number of different CQS and CQR strains derived originally from field isolates (the CQS strains 3D7 and D10 and the CQR strains 7G8 and K1). The results are presented in Table 2. The ANOVA test identified a range of metabolites for which levels showed significant differences among these genetically divergent strains (Table 2). Choline and phosphocholine in particular showed marked variation between strains, being >30-fold and >5-fold more abundant, respectively, in 3D7 (CQS) and 7G8 (CQR) iRBCs than in D10 (CQS) and K1 (CQR) iRBCs (Table 2). These differences, as well as many others, did not track with the CQ resistance status of the strain, and presumably result from genetic differences other than those in pfcrt. We did however observe that a number of different amino acids, as well as the total pool of amino acids, were elevated in both CQR strains compared with both CQS strains.
Table 2. Metabolite amounts in RBCs infected with different (non-transfectant) P. falciparum strains.
The amounts (μmol per 1012 cells; obtained by 1H-NMR) are the means±S.D. from the indicated number of independent cell preparations (obtained on different days). In all cases, the cells were mature trophozoite-infected RBCs. The amounts shown are derived from cell preparations with up to 5% contamination with cRBCs. nd, not detected in some or all replicates. a: P<0.001; b: P<0.01 and c: P<0.05 from FDR-adjusted one-way ANOVA tests using the natural logarithm transformed data (see Table 1; nd data excluded). Metabolites for which there were significant differences in abundance among strains are shown in bold.
| ANOVA | 3D7 | D10 | 7G8 | K1 | |
|---|---|---|---|---|---|
| No. of independent cultures | 10 | 9 | 10 | 8 | |
| CQ resistance status | CQS | CQS | CQR | CQR | |
| Amino acids | |||||
| Alanine | a | 7.8±1.7 | 11.5±1.8 | 20.4±4.7 | 13.9±3.2 |
| 4-Aminobutyrate | a | 4.3±2.5 | 34.9±8.9 | 23.2±9.3 | 26.0±7.2 |
| Arginine | a | 33.2±16.1 | 69±21 | 50±9 | 76±18 |
| Asparagine | a | 29.0±7.7 | 30.0±4.7 | 42±8 | 35.9±6.1 |
| Aspartate | a | 54±12 | 50±10 | 117±21 | 185±54 |
| Glutamate | a | 166±18 | 237±26 | 245±37 | 238±46 |
| Glutamine | c | 58±9 | 54±11 | 50±9 | 44±8 |
| Glycine | a | 8.8±3.2 | 11.3±1.7 | 21.7±5.1 | 12.9±2.2 |
| Histidine | a | 8.9±3.3 | 9.6±3.3 | 20.3±5.1 | 13.7±2.8 |
| Isoleucine | c | 5.9±1.4 | 5.6±1.6 | 8.4±1.6 | 6.3±1.9 |
| Leucine | a | 9.7±2.9 | 11.1±2.4 | 17.8±3.6 | 11.4±3.2 |
| Lysine | a | 48±22 | 96±20 | 77±13 | 239±64 |
| Phenylalanine | c | 2.3±3.2 | 4.4±4.3 | 3.7±3.4 | 9.0±14.9 |
| Serine | a | 15.3±4.0 | 12.6±2.5 | 27.3±7.6 | 18.2±3.7 |
| Threonine | b | 15.7±3.6 | 18.3±2.4 | 21.8±3.9 | 16.8±3.0 |
| Tyrosine | a | 4.4±2.0 | 4.4±1.5 | 6.8±1.3 | 4.1±0.8 |
| Valine | a | 7.9±1.7 | 9.3±1.0 | 11.8±2.2 | 8.1±1.0 |
| Total amino acids | a | 479±92 | 669±63 | 763±99 | 960±126 |
| Glutathione | |||||
| GSSG | c | 43±10 | 54±10 | 48±7 | 54±9 |
| Soluble membrane precursors | |||||
| 2,3-Bisphosphoglycerate | b | 114±29 | 81±25 | 110±21 | 132±18 |
| Choline | a | 33.2±11.5 | nd | 52±9 | 1.2±0.8 |
| myo-Inositol | b | 5.4±1.5 | 7.8±1.4 | 7.2±1.6 | 8.1±1.8 |
| Phosphocholine | a | 220±51 | 36.7±15.5 | 223±41 | 36.2±14.5 |
| Phosphoethanolamine | a | 38.7±11.3 | 89±29 | 82±21 | 60±20 |
| Nucleotides and related compounds | |||||
| ADP | 14.3±3.1 | 28.3±12.7 | 17.9±5.7 | 19.2±7.7 | |
| AMP | nd | 4.2±3.5 | nd | nd | |
| ATP | b | 88±16 | 124±46 | 121±20 | 137±17 |
| NAD+ | 56±9 | 64±9 | 60±10 | 54±5 | |
| NADP+ | c | 9.9±1.8 | 8.7±1.6 | 7.8±1.2 | 8.5±1.0 |
| Carboxylates | |||||
| Acetate | 10±6 | 15±19 | 10.5±4.3 | 15±12 | |
| Formate | 9.9±5.8 | 14±24 | 11.5±5.4 | 15.4±8.4 | |
| Fumarate | a | 0.8±0.6 | 2.6±0.3 | 1.5±0.4 | 1.0±0.6 |
| α-Ketoglutarate | 2.5±1.8 | 2.6±1.3 | 3.4±0.6 | 2.8±1.3 | |
| Lactate | 31.0±7.6 | 30±14 | 40±11 | 50±34 | |
| Malate | a | 13.8±6.5 | 33.6±7.4 | 20.4±3.4 | 15.4±7.1 |
| Succinate | a | 8.5±1.5 | 14.6±2.4 | 9.1±2.6 | 4.9±2.7 |
| Other compounds | |||||
| HEPES | 540±88 | 590±80 | 632±92 | 544±85 | |
| Putrescine | a | 26.1±8.6 | 51±15 | 30.9±6.2 | 31.2±9.9 |
| Spermidine | 164±22 | 180±26 | 165±22 | 167±19 | |
| Spermine | a | 8.4±2.2 | 12.5±2.0 | 16.1±2.6 | 16.6±2.4 |
| Total amounts | a | 1991±170 | 2210±234 | 2532±242 | 2425±194 |
| Total amounts excluding HEPES | a | 1450±150 | 1620±172 | 1900±190 | 1881±190 |
We also estimated metabolite amounts for three transfectant lines that differ solely with respect to the isoform of PfCRT that they express (the CQS line C2GC03 and the CQR lines C4Dd2 and C67G8; Table 3). The ANOVA test identified a number of metabolites for which levels showed significant differences between lines (Table 3). We again observed that many individual amino acids, as well as the total pool of amino acids, were elevated in both CQR lines relative to the CQS line. Across Tables 2 and 3, RBCs infected with all the four (transfectant and non-transfectant) CQR strains showed higher amounts of aspartate, asparagine, glycine, leucine and serine than those infected with any of the three CQS strains. The amount of the polyamine spermine was also greater for CQR strains than for CQS strains.
Figure 2 shows the ratios of the mean amounts for each (detectable) amino acid in CQR versus CQS strains. In the case of aspartate, the level seen in all CQR strains was >1.8-fold higher than that seen in all CQS strains, with the actual amounts differing by ≥48 μmol per 1012 cells in all cases. For the other amino acids that were consistently higher in the CQR strains than the CQS strains the actual amounts were much lower. These differences in amino acid abundance were observed both in genetically disparate CQS (3D7 and D10) and CQR (7G8 and K1) strains derived originally from field isolates (Table 2, Figure 2), and in the transfectant lines that differ solely with respect to the form of pfcrt expressed (Table 3 and Figure 2). The results obtained with the transfectant lines allow the differences to be attributed to the differences in pfcrt.
Figure 2. Differences in amino acid amounts in RBCs infected with CQR and CQS parasites.

Black bars show the mean amino acid amounts for CQR strains (using averaged data for 7G8, K1, C4Dd2 and C67G8) divided by those for CQS strains (3D7, D10 and C2GC03). The white bars show the mean amino acid amounts for the non-transfectant CQR strains (7G8 and K1) divided by those for the non-transfectant CQS strains (3D7 and D10). The grey bars show the mean amino acid amounts for the transfectant CQR strains (C4Dd2 and C67G8) divided by those for the CQS transfectant line C2GC03.
HPLC measurements of metabolites in RBCs infected with different P. falciparum strains
The finding that mutations in pfcrt give rise to significant differences in amino acid abundance was confirmed using HPLC. The amino acid profiles of the transfectant CQS C2GC03 and CQR C67G8 lines were compared using the methanol extraction method, with the extracts subjected to a derivatization procedure to facilitate the detection of compounds containing amino groups. The HPLC-based approach enabled the detection of 18 amino acids and two polyamines. The absolute amounts of these metabolites were not quantified; rather, in each experiment, the metabolite amounts were normalized to that of the non-naturally occurring amino acid benzylserine (added to each sample as a reference compound), allowing the determination of the relative amounts of each amino acid in the two lines. Representative HPLC traces for each line are shown in Figure 3, and the averaged data from three independent cell preparations are presented in Table 4.
Figure 3. Representative HPLC traces for RBCs infected with C2GC03 (top) or C67G8 (bottom) trophozoites.

1. Aspartate, 2. Glutamate, 3. Cystine, 4. Background, 5. Asparagine, 6. Glutamine, 7. Serine, 8. Citrulline, 9. Glycine, 10. 4-Aminobutyrate, 11. Alanine, 12. Threonine, 13. Valine, 14. Derivatization artifact, 15. Methionine, 16. Unknown, 17. Isoleucine, 18. Tryptophan, 19. Phenylalanine, 20. Benzylserine (a non-naturally occurring amino acid to which other peaks were normalized), 21. Spermine, 22. Ornithine, 23. Lysine, 24. Spermidine.
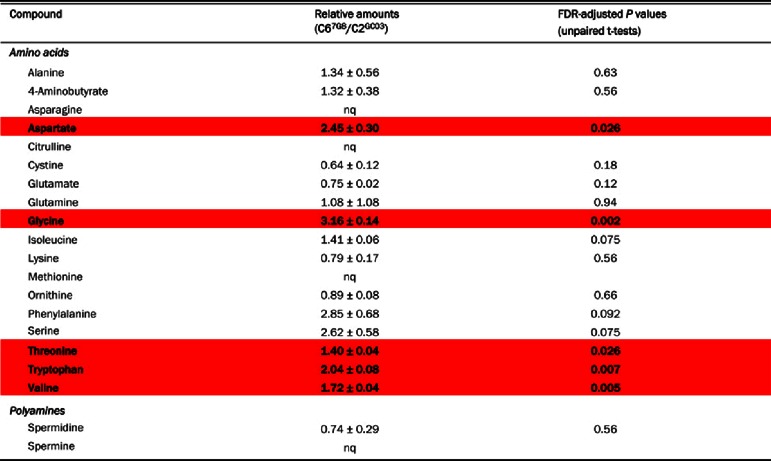
Table 4. Relative intracellular metabolite amounts obtained by HPLC in RBCs infected with C2GC03 or C67G8 trophozoites.
The data are averaged from three independent cell preparations (obtained on different days) for each line and are shown ±S.E.M. A value >1 indicates that a metabolite is more abundant in C67G8 iRBCs; a value <1 indicates that a metabolite is more abundant in C2GC03 iRBCs. nq, not quantified because these compounds were not detected in all experiments (asparagine and spermine were only detected in experiments with C67G8 iRBCs). Red shading: significantly more abundant in C67G8 iRBCs than in C2GC03 iRBCs.
 |
The data obtained with HPLC were, in general, consistent with those obtained with 1H-NMR. Of the 20 metabolites detected by HPLC, two (asparagine and spermine) were only detected for C67G8. This is consistent with the 1H-NMR data (Table 3), which revealed greater amounts of asparagine and spermine for C67G8 than for C2GC03. For each of 13 compounds (12 amino acids+spermidine), the ratio of the amount in the C67G8 iRBCs relative to the amount in C2GC03 iRBCs was obtained using both HPLC and 1H-NMR. The two methods gave good agreement for the following compounds (although statistical significance was not reached with HPLC in all cases): alanine, aspartate, glutamine, glycine, isoleucine, serine, threonine and valine, all of which were more abundant in C67G8 iRBCs than in C2GC03 iRBCs; glutamate and spermidine, both of which were more abundant in C2GC03 iRBCs than in C67G8 iRBCs; and GABA and lysine, levels of which did not differ significantly between the two parasite lines. The HPLC measurements indicated a relatively high level of phenylalanine in C67G8 iRBCs compared to C2GC03 iRBCs; however, this difference was not statistically significant as there was a high level of inter-experimental variation, most likely as a consequence of the low levels of phenylalanine present in both lines. The 1H-NMR measurements also indicated no significant difference between phenylalanine levels in C67G8 and C2GC03 iRBCs (Table 3).
HPLC enabled the detection of several metabolites that were not detected by 1H-NMR. Citrulline and methionine were not quantified, because they were not detected in all experiments. Tryptophan was present at twice the amount in C67G8 than in C2GC03 iRBCs. The amounts of ornithine and the dimeric amino acid cystine did not differ significantly between C67G8 and C2GC03 iRBCs.
Expression of PfCRT in Xenopus oocytes
One possible explanation for the higher abundance of amino acids in RBCs infected with CQR parasites is that PfCRT normally serves to efflux haemoglobin-derived amino acids from the DV, and that this function is compromised by CQ-resistance-conferring mutations. Using the Xenopus oocyte expression system, we tested whether aspartate, the amino acid showing the greatest difference in abundance between CQS and CQR strains, is a substrate of the wild-type (PfCRTCQS) or mutant (PfCRTCQR) protein. As shown in Figure 4(a), oocytes expressing PfCRTCQS or PfCRTCQR did not accumulate [14C]L-aspartate above the levels measured in non-injected oocytes (P>0.05; ANOVA with Tukey–Kramer multiple comparisons test), whereas oocytes expressing the rat glutamate/aspartate transporter GLAST showed a marked increase in [14C]L-aspartate uptake relative to non-injected oocytes (P<0.001). There was no significant difference in [14C]L-aspartate uptake between PfCRTCQS- and PfCRTCQR-expressing oocytes (P>0.05). Furthermore, [14C]L-aspartate uptake into PfCRTCQR and PfCRTCQS-expressing oocytes was not affected by the presence of the PfCRTCQR inhibitors saquinavir (250 μM; [35]), verapamil (250 μM) or CQ (750 μM) [12], or by choline (250 μM), artemisinin (500 μM), or unlabelled L-aspartate (200 μM) (results not shown). In the same experiments, the transport of [3H]CQ into oocytes expressing PfCRTCQR was significantly higher than that measured in all other oocyte types (Figure 4b; P<0.001).
Figure 4. L-Aspartate and CQ uptake by Xenopus oocytes expressing PfCRT.
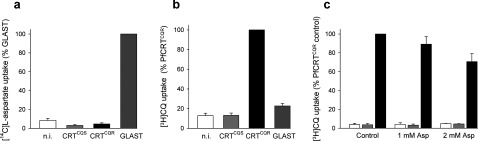
[14C]L-aspartate uptake (a) and [3H]CQ uptake (b) in n.i. (non-injected) oocytes and in oocytes expressing PfCRTCQS, PfCRTCQR or rat GLAST. Uptake is shown as the means + S.E.M. from nine separate experiments, within which measurements were made from ten oocytes per treatment. (c) Effect of unlabelled L-aspartate (1 and 2 mM) on the uptake of [3H]CQ into n.i. oocytes (white bars) and oocytes expressing PfCRTCQS (grey bars) or PfCRTCQR (black bars). Uptake is shown as the means + S.E.M. from three separate experiments, within which measurements were made from ten oocytes per treatment.
To investigate further whether there might be an interaction between L-aspartate and PfCRT, we examined whether unlabelled L-aspartate affected the uptake of [3H]CQ into Xenopus oocytes expressing PfCRT. As shown in Figure 4(c), the addition of 1 mM unlabelled L-aspartate had no significant effect on either the uptake of [3H]CQ by oocytes expressing PfCRTCQR or the diffusion of [3H]CQ into non-injected oocytes or oocytes expressing PfCRTCQS (P>0.05). A modest but significant reduction in [3H]CQ uptake was observed in PfCRTCQR-expressing oocytes in the presence of 2 mM unlabelled L-aspartate (P<0.05), whereas the addition of 2 mM unlabelled L-aspartate had no effect on [3H]CQ uptake into non-injected or PfCRTCQS-expressing oocytes (P>0.05).
DISCUSSION
Metabolomic comparisons have been applied to great effect in a variety of systems to unravel physiological differences between genders, strains, species and healthy versus diseased tissues. In this study, we have carried out metabolomic comparisons of iRBCs, uRBCs and cRBCs, and of RBCs infected with different strains of P. falciparum.
There were significant differences in the abundance of many metabolites between iRBCs and uRBCs, with cRBCs having levels similar to uRBCs for most metabolites (Table 1). As has been noted previously [34], iRBCs have significantly lower levels of 2,3-bisphosphoglycerate than their uninfected counterparts. Glucose was absent from the iRBCs for most of the strains, but present at significant levels in both uRBCs and cRBCs. This difference is likely to be due to intracellular glucose in the iRBCs being consumed by residual glycolysis during the cell isolation procedure; in the uninfected cells glycolysis is two orders of magnitude slower [34] and this will not have been an issue. Sorbitol was also present at significant levels in uRBCs and cRBCs. This is consistent with a previous study in which exposure of uRBCs to elevated extracellular glucose concentrations was found to result in an increased intracellular sorbitol content [36]. The end-product of glycolysis, lactate, was detected in all cell types, but other glycolytic intermediates were below the level of detection. As noted previously, the intraerythrocytic parasite has significant concentrations of TCA cycle intermediates [3,5]. A recent study has provided evidence that a conventional TCA cycle operates at low levels in asexual blood-stage P. falciparum parasites [37]. Fumarate and malate were not detected in either uRBCs or cRBCs. The detection of succinate in cRBCs, but not uRBCs may be due to succinate being exported from the parasite and parasitized RBC, to the external medium (from where it may be taken up by cRBCs).
The much higher levels of the membrane precursors choline and phosphocholine in iRBCs than in uRBCs and cRBCs reflects the fact that the parasite, unlike the mature RBC, carries out extensive membrane synthesis [38]. The amounts of choline and phosphocholine differed markedly between iRBCs infected with different strains, being>30-fold and>5-fold more abundant, respectively, in RBCs infected with 3D7 or 7G8 parasites than in those infected with D10 or K1 parasites. The basis for this difference is not known, but may relate to differences in choline uptake between different parasites. There is physiological evidence for a membrane-potential-dependent choline transporter on the parasite plasma membrane [39,40] but its molecular identity (and, therefore, whether there may be polymorphisms in the transporter in some strains) remains to be discovered.
As has been noted previously, there is a significant concentration of the neurotransmitter GABA associated with the parasite [5]. A recent study has reported that TCA cycle intermediates are used to synthesize glutamate, which is then decarboxylated to yield GABA in P. falciparum iRBCs [37]. The buffer HEPES, used widely for malaria parasite culture, is also present (and highly abundant) in iRBCs infected with all strains. HEPES was found previously to be an abundant solute in D10 parasites isolated from their host RBCs [5]. The mechanism by which HEPES gains entry into the parasite is not known; given its physicochemical properties, transport proteins are probably involved. The extent to which the uptake of this exogenous agent might affect the physiology of the parasite is yet to be explored. Previous mass spectrometry studies have identified additional metabolites (not detected in this study by 1H-NMR) that differ in abundance between uRBCs and P. falciparum iRBCs [3,4].
The comparison of the metabolite profiles of RBCs infected with different CQS and CQR parasites, including parasites expressing different pfcrt alleles on a single genetic background, uncovered some significant differences. The most striking finding was that the amounts of many individual amino acids, as well as the total amount of amino acids, were elevated in RBCs infected with CQR parasites compared to those infected with CQS parasites. Of particular note was aspartate, which was present in substantially greater amounts for all (non-transfectant and transfectant) CQR strains (102–185 μmol per 1012 cells) than for all CQS strains (50–54 μmol per 1012 cells). Asparagine, glycine, leucine, serine and the polyamine spermine were also found in greater amounts for all CQR strains than for all CQS strains, though the relative differences were less pronounced. In the pfcrt transfectant lines, both the 1H-NMR and HPLC analyses indicated higher glycine and serine levels in parasites bearing CQ-resistance-conferring mutations in PfCRT, with the relative differences similar to or greater than that seen for aspartate; however, the amounts involved were substantially lower than was the case for aspartate.
The DV is the site at which the parasite digests the haemoglobin endocytosed from the host RBC. Adult human haemoglobin contains every proteinogenic amino acid except for isoleucine, and haemoglobin digestion is essential for parasite survival [41]. The amino acids produced are used for protein synthesis, and the process might also be important to maintain osmotic balance in the host cell [42] and to ensure that there is sufficient space for parasite growth inside the RBC [43]. The extent to which haemoglobin-derived peptides are broken down within the DV is not yet clear (reviewed in [44]). It is believed that small peptides, including some dipeptides, are generated by proteases located in the DV [45]; however, the localization of exoaminopeptidases that digest small peptides into individual amino acids has been controversial [46–49]. Based on bioinformatic analyses of PfCRT and the requirement that haemoglobin breakdown products be effluxed from the DV, it has been suggested that the natural function of PfCRT might be amino acid and/or peptide transport [50].
One potential explanation for our findings was that (wild-type) PfCRT does indeed transport amino acids out of the DV, and that this function is compromised in part by CQ-resistance-conferring mutations, leading to a build-up of amino acids such as aspartate in this organelle. However, neither PfCRTCQS nor PfCRTCQR mediated aspartate transport when expressed in Xenopus oocytes. The finding that 2 mM unlabelled L-aspartate caused a modest decrease in [3H]CQ uptake by PfCRTCQR-expressing oocytes raises the possibility of an interaction between aspartate and mutant PfCRT. However, any such interaction must be low-affinity and does not result in significant translocation of aspartate.
An alternative possibility is that mutations in PfCRT give rise to the altered amino acid profile observed here via an indirect effect. For example, the build-up of amino acids could result from pfcrt-linked changes in DV physiology that affect haemoglobin degradation. Indeed, this was suggested in a recent study in which haemoglobin-derived peptides ranging in size from 2-mers to 32-mers were shown to accumulate in erythrocytes infected with CQR parasites [2]. With the exception of GSSG, peptides fell below the detection limit in our study. Perhaps the small peptides that are proposed to be trapped within the DV of CQR parasites [2] degrade over time to produce amino acids, leading to the increased levels of many amino acids observed in this study.
In summary, a comparison of the metabolite profiles of RBCs infected with different strains of P. falciparum has revealed significant variations between strains, some of which associate with mutations in PfCRT. The information gained here sheds light on the biochemical changes brought about by mutations in PfCRT, and may provide insights into the elusive natural function of this protein.
Online data
ACKNOWLEDGEMENTS
We are grateful to Professor David Fidock for providing the pfcrt transfectant lines used in this study, to Professor Stefan Bröer for providing GLAST cRNA, to Robert Forrester and Dr Teresa Neeman for helpful discussions, and to the Canberra Branch of the Australian Red Cross Blood Service for the provision of blood.
AUTHOR CONTRIBUTION
Kiaran Kirk conceived of the study. Rongwei Teng, Adele M. Lehane, Rowena E. Martin, Pauline R. Junankar and Kiaran Kirk designed and coordinated the study. Rongwei Teng performed 1H-NMR experiments; Adele M. Lehane and Markus Winterberg performed HPLC experiments; Sarah H. Shafik and Robert L. Summers performed Xenopus oocyte experiments; Rongwei Teng, Adele M. Lehane, Markus Winterberg, Rowena E. Martin and Sarah H. Shafik undertook the analysis of the data. Rongwei Teng, Adele M. Lehane, Donelly A. van Schalkwyk and Pauline R. Junankar participated in the preparation of samples for analysis. Adele M. Lehane and Kiaran Kirk wrote the manuscript, with contributions from all the authors.
FUNDING
This work was supported by grants from the Australian National Health and Medical Research Council (NHMRC) [grant numbers 316933 and 525428 (to K.K.) and 1007035 (to R.E.M.)], and by the L’Oréal Australia For Women in Science programme (to R.E.M.). A.M.L. was supported by an NHMRC Overseas Biomedical Fellowship [grant number 585519] and R.E.M. was supported by NHMRC Australian Biomedical Fellowships [grant numbers 520320 and 1053082].
References
- 1.Volkman S. K., Neafsey D. E., Schaffner S. F., Park D. J., Wirth D. F. Harnessing genomics and genome biology to understand malaria biology. Nat. Rev. Genet. 2012;13:315–328. doi: 10.1038/nrg3187. [DOI] [PubMed] [Google Scholar]
- 2.Lewis I. A., Wacker M., Olszewski K. L., Cobbold S. A., Baska K. S., Tan A., Ferdig M. T., Llinas M. Metabolic QTL analysis links chloroquine resistance in Plasmodium falciparum to impaired hemoglobin catabolism. PLoS Genet. 2014;10:e1004085. doi: 10.1371/journal.pgen.1004085. [DOI] [PMC free article] [PubMed] [Google Scholar]
- 3.Olszewski K. L., Morrisey J. M., Wilinski D., Burns J. M., Vaidya A. B., Rabinowitz J. D., Llinas M. Host-parasite interactions revealed by Plasmodium falciparum metabolomics. Cell Host Microbe. 2009;5:191–199. doi: 10.1016/j.chom.2009.01.004. [DOI] [PMC free article] [PubMed] [Google Scholar]
- 4.Sana T. R., Gordon D. B., Fischer S. M., Tichy S. E., Kitagawa N., Lai C., Gosnell W. L., Chang S. P. Global mass spectrometry based metabolomics profiling of erythrocytes infected with Plasmodium falciparum. PLoS ONE. 2013;8:e60840. doi: 10.1371/journal.pone.0060840. [DOI] [PMC free article] [PubMed] [Google Scholar]
- 5.Teng R., Junankar P. R., Bubb W. A., Rae C., Mercier P., Kirk K. Metabolite profiling of the intraerythrocytic malaria parasite Plasmodium falciparum by 1H NMR spectroscopy. NMR Biomed. 2009;22:292–302. doi: 10.1002/nbm.1323. [DOI] [PubMed] [Google Scholar]
- 6.Volkman S. K., Sabeti P. C., DeCaprio D., Neafsey D. E., Schaffner S. F., Milner D. A., Daily J. P., Sarr O., Ndiaye D., Ndir O., et al. A genome-wide map of diversity in Plasmodium falciparum. Nat. Genet. 2007;39:113–119. doi: 10.1038/ng1930. [DOI] [PubMed] [Google Scholar]
- 7.Wootton J. C., Feng X., Ferdig M. T., Cooper R. A., Mu J., Baruch D. I., Magill A. J., Su X. Z. Genetic diversity and chloroquine selective sweeps in Plasmodium falciparum. Nature. 2002;418:320–323. doi: 10.1038/nature00813. [DOI] [PubMed] [Google Scholar]
- 8.Fidock D. A., Nomura T., Talley A. K., Cooper R. A., Dzekunov S. M., Ferdig M. T., Ursos L. M., Sidhu A. B., Naude B., Deitsch K. W., et al. Mutations in the P. falciparum digestive vacuole transmembrane protein PfCRT and evidence for their role in chloroquine resistance. Mol. Cell. 2000;6:861–871. doi: 10.1016/S1097-2765(05)00077-8. [DOI] [PMC free article] [PubMed] [Google Scholar]
- 9.Cooper R. A., Ferdig M. T., Su X. Z., Ursos L. M., Mu J., Nomura T., Fujioka H., Fidock D. A., Roepe P. D., Wellems T. E. Alternative mutations at position 76 of the vacuolar transmembrane protein PfCRT are associated with chloroquine resistance and unique stereospecific quinine and quinidine responses in Plasmodium falciparum. Mol. Pharmacol. 2002;61:35–42. doi: 10.1124/mol.61.1.35. [DOI] [PubMed] [Google Scholar]
- 10.Bray P. G., Mungthin M., Hastings I. A., Biagini G. A., Saidu D. K., Lakshmanan V., Johnson D. J., Hughes R. H., Stocks P. A., O’Neill P. M., et al. PfCRT and the trans-vacuolar proton electrochemical gradient: regulating the access of chloroquine to ferriprotoporphyrin IX. Mol. Microbiol. 2006;62:238–251. doi: 10.1111/j.1365-2958.2006.05368.x. [DOI] [PMC free article] [PubMed] [Google Scholar]
- 11.Fitch C. D. Ferriprotoporphyrin IX, phospholipids, and the antimalarial actions of quinoline drugs. Life Sci. 2004;74:1957–1972. doi: 10.1016/j.lfs.2003.10.003. [DOI] [PubMed] [Google Scholar]
- 12.Martin R. E., Marchetti R. V., Cowan A. I., Howitt S. M., Broer S., Kirk K. Chloroquine transport via the malaria parasite's chloroquine resistance transporter. Science. 2009;325:1680–1682. doi: 10.1126/science.1175667. [DOI] [PubMed] [Google Scholar]
- 13.Cabrera M., Natarajan J., Paguio M. F., Wolf C., Urbach J. S., Roepe P. D. Chloroquine transport in Plasmodium falciparum. 1. Influx and efflux kinetics for live trophozoite parasites using a novel fluorescent chloroquine probe. Biochemistry. 2009;48:9471–9481. doi: 10.1021/bi901034r. [DOI] [PMC free article] [PubMed] [Google Scholar]
- 14.Lehane A. M., Kirk K. Chloroquine resistance-conferring mutations in pfcrt give rise to a chloroquine-associated H+ leak from the malaria parasite's digestive vacuole. Antimicrob. Agents Chemother. 2008;52:4374–4380. doi: 10.1128/AAC.00666-08. [DOI] [PMC free article] [PubMed] [Google Scholar]
- 15.Sanchez C. P., McLean J. E., Rohrbach P., Fidock D. A., Stein W. D., Lanzer M. Evidence for a pfcrt-associated chloroquine efflux system in the human malarial parasite Plasmodium falciparum. Biochemistry. 2005;44:9862–9870. doi: 10.1021/bi050061f. [DOI] [PubMed] [Google Scholar]
- 16.Sidhu A. B., Verdier-Pinard D., Fidock D. A. Chloroquine resistance in Plasmodium falciparum malaria parasites conferred by pfcrt mutations. Science. 2002;298:210–213. doi: 10.1126/science.1074045. [DOI] [PMC free article] [PubMed] [Google Scholar]
- 17.Yuan J., Cheng K. C., Johnson R. L., Huang R., Pattaradilokrat S., Liu A., Guha R., Fidock D. A., Inglese J., Wellems T. E., et al. Chemical genomic profiling for antimalarial therapies, response signatures, and molecular targets. Science. 2011;333:724–729. doi: 10.1126/science.1205216. [DOI] [PMC free article] [PubMed] [Google Scholar]
- 18.Lehane A. M., Kirk K. Efflux of a range of antimalarial drugs and ‘chloroquine resistance reversers’ from the digestive vacuole in malaria parasites with mutant PfCRT. Mol. Microbiol. 2010;77:1039–1051. doi: 10.1111/j.1365-2958.2010.07272.x. [DOI] [PubMed] [Google Scholar]
- 19.Sanchez C. P., Stein W. D., Lanzer M. Dissecting the components of quinine accumulation in Plasmodium falciparum. Mol. Microbiol. 2008;67:1081–1093. doi: 10.1111/j.1365-2958.2008.06108.x. [DOI] [PubMed] [Google Scholar]
- 20.Summers R. L., Nash M. N., Martin R. E. Know your enemy: understanding the role of PfCRT in drug resistance could lead to new antimalarial tactics. Cell. Mol. Life Sci. 2012;69:1967–1995. doi: 10.1007/s00018-011-0906-0. [DOI] [PMC free article] [PubMed] [Google Scholar]
- 21.Koncarevic S., Bogumil R., Becker K. SELDI-TOF-MS analysis of chloroquine resistant and sensitive Plasmodium falciparum strains. Proteomics. 2007;7:711–721. doi: 10.1002/pmic.200600552. [DOI] [PubMed] [Google Scholar]
- 22.Jiang H., Patel J. J., Yi M., Mu J., Ding J., Stephens R., Cooper R. A., Ferdig M. T., Su X. Z. Genome-wide compensatory changes accompany drug-selected mutations in the Plasmodium falciparum crt gene. PLoS ONE. 2008;3:e2484. doi: 10.1371/journal.pone.0002484. [DOI] [PMC free article] [PubMed] [Google Scholar]
- 23.Waller K. L., Muhle R. A., Ursos L. M., Horrocks P., Verdier-Pinard D., Sidhu A. B., Fujioka H., Roepe P. D., Fidock D. A. Chloroquine resistance modulated in vitro by expression levels of the Plasmodium falciparum chloroquine resistance transporter. J. Biol. Chem. 2003;278:33593–33601. doi: 10.1074/jbc.M302215200. [DOI] [PubMed] [Google Scholar]
- 24.Mu J., Awadalla P., Duan J., McGee K. M., Joy D. A., McVean G. A., Su X. Z. Recombination hotspots and population structure in Plasmodium falciparum. PLoS Biol. 2005;3:e335. doi: 10.1371/journal.pbio.0030335. [DOI] [PMC free article] [PubMed] [Google Scholar]
- 25.Wellems T. E., Panton L. J., Gluzman I. Y., do Rosario V. E., Gwadz R. W., Walker-Jonah A., Krogstad D. J. Chloroquine resistance not linked to mdr-like genes in a Plasmodium falciparum cross. Nature. 1990;345:253–255. doi: 10.1038/345253a0. [DOI] [PubMed] [Google Scholar]
- 26.Allen R. J., Kirk K. Plasmodium falciparum culture: the benefits of shaking. Mol. Biochem. Parasitol. 2010;169:63–65. doi: 10.1016/j.molbiopara.2009.09.005. [DOI] [PubMed] [Google Scholar]
- 27.Lambros C., Vanderberg J. P. Synchronization of Plasmodium falciparum erythrocytic stages in culture. J. Parasitol. 1979;65:418–420. doi: 10.2307/3280287. [DOI] [PubMed] [Google Scholar]
- 28.Weljie A. M., Newton J., Mercier P., Carlson E., Slupsky C. M. Targeted profiling: quantitative analysis of 1H NMR metabolomics data. Anal. Chem. 2006;78:4430–4442. doi: 10.1021/ac060209g. [DOI] [PubMed] [Google Scholar]
- 29.Mokrasch L. C. Use of 2,4,6-trinitrobenzenesulfonic acid for the coestimation of amines, amino acids, and proteins in mixtures. Anal. Biochem. 1967;18:64–71. doi: 10.1016/0003-2697(67)90057-7. [DOI] [Google Scholar]
- 30.Broer S. Xenopus laevis oocytes. Methods Mol. Biol. 2003;227:245–258. doi: 10.1385/1-59259-387-9:245. [DOI] [PubMed] [Google Scholar]
- 31.Bröer A., Brookes N., Ganapathy V., Dimmer K. S., Wagner C. A., Lang F., Broer S. The astroglial ASCT2 amino acid transporter as a mediator of glutamine efflux. J. Neurochem. 1999;73:2184–2194. [PubMed] [Google Scholar]
- 32.Saliba K. J., Krishna S., Kirk K. Inhibition of hexose transport and abrogation of pH homeostasis in the intraerythrocytic malaria parasite by an O-3-hexose derivative. FEBS Lett. 2004;570:93–96. doi: 10.1016/j.febslet.2004.06.032. [DOI] [PubMed] [Google Scholar]
- 33.Ataullakhanov F. I., Vitvitsky V. M. What determines the intracellular ATP concentration. Biosci. Rep. 2002;22:501–511. doi: 10.1023/A:1022069718709. [DOI] [PubMed] [Google Scholar]
- 34.Mehta M., Sonawat H. M., Sharma S. Malaria parasite-infected erythrocytes inhibit glucose utilization in uninfected red cells. FEBS Lett. 2005;579:6151–6158. doi: 10.1016/j.febslet.2005.09.088. [DOI] [PubMed] [Google Scholar]
- 35.Martin R. E., Butterworth A. S., Gardiner D. L., Kirk K., McCarthy J. S., Skinner-Adams T. S. Saquinavir inhibits the malaria parasite's chloroquine resistance transporter. Antimicrob. Agents Chemother. 2012;56:2283–2289. doi: 10.1128/AAC.00166-12. [DOI] [PMC free article] [PubMed] [Google Scholar]
- 36.Vincent T. E., Mendiratta S., May J. M. Inhibition of aldose reductase in human erythrocytes by vitamin C. Diabetes Res. Clin. Pract. 1999;43:1–8. doi: 10.1016/S0168-8227(98)00119-3. [DOI] [PubMed] [Google Scholar]
- 37.Macrae J. I., Dixon M. W., Dearnley M. K., Chua H. H., Chambers J. M., Kenny S., Bottova I., Tilley L., McConville M. J. Mitochondrial metabolism of sexual and asexual blood stages of the malaria parasite Plasmodium falciparum. BMC Biol. 2013;11:67. doi: 10.1186/1741-7007-11-67. [DOI] [PMC free article] [PubMed] [Google Scholar]
- 38.Vial H. J., Eldin P., Tielens A. G., van Hellemond J. J. Phospholipids in parasitic protozoa. Mol. Biochem. Parasitol. 2003;126:143–154. doi: 10.1016/S0166-6851(02)00281-5. [DOI] [PubMed] [Google Scholar]
- 39.Biagini G. A., Pasini E. M., Hughes R., De Koning H. P., Vial H. J., O’Neill P. M., Ward S. A., Bray P. G. Characterization of the choline carrier of Plasmodium falciparum: a route for the selective delivery of novel antimalarial drugs. Blood. 2004;104:3372–3377. doi: 10.1182/blood-2004-03-1084. [DOI] [PubMed] [Google Scholar]
- 40.Lehane A. M., Saliba K. J., Allen R. J., Kirk K. Choline uptake into the malaria parasite is energized by the membrane potential. Biochem. Biophys. Res. Commun. 2004;320:311–317. doi: 10.1016/j.bbrc.2004.05.164. [DOI] [PubMed] [Google Scholar]
- 41.Liu J., Istvan E. S., Gluzman I. Y., Gross J., Goldberg D. E. Plasmodium falciparum ensures its amino acid supply with multiple acquisition pathways and redundant proteolytic enzyme systems. Proc. Natl. Acad. Sci. U.S.A. 2006;103:8840–8845. doi: 10.1073/pnas.0601876103. [DOI] [PMC free article] [PubMed] [Google Scholar]
- 42.Lew V. L., Macdonald L., Ginsburg H., Krugliak M., Tiffert T. Excess haemoglobin digestion by malaria parasites: a strategy to prevent premature host cell lysis. Blood Cells Mol. Dis. 2004;32:353–359. doi: 10.1016/j.bcmd.2004.01.006. [DOI] [PubMed] [Google Scholar]
- 43.Allen R. J., Kirk K. Cell volume control in the Plasmodium-infected erythrocyte. Trends Parasitol. 2004;20:7–10. doi: 10.1016/j.pt.2003.10.015. [DOI] [PubMed] [Google Scholar]
- 44.Skinner-Adams T. S., Stack C. M., Trenholme K. R., Brown C. L., Grembecka J., Lowther J., Mucha A., Drag M., Kafarski P., McGowan S., et al. Plasmodium falciparum neutral aminopeptidases: new targets for anti-malarials. Trends Biochem. Sci. 2010;35:53–61. doi: 10.1016/j.tibs.2009.08.004. [DOI] [PubMed] [Google Scholar]
- 45.Klemba M., Gluzman I., Goldberg D. E. A Plasmodium falciparum dipeptidyl aminopeptidase I participates in vacuolar hemoglobin degradation. J. Biol. Chem. 2004;279:43000–43007. doi: 10.1074/jbc.M408123200. [DOI] [PubMed] [Google Scholar]
- 46.Curley G. P., O’Donovan S. M., McNally J., Mullally M., O’Hara H., Troy A., O’Callaghan S. A., Dalton J. P. Aminopeptidases from Plasmodium falciparum, Plasmodium chabaudi chabaudi and Plasmodium berghei. J. Eukaryot. Microbiol. 1994;41:119–123. doi: 10.1111/j.1550-7408.1994.tb01483.x. [DOI] [PubMed] [Google Scholar]
- 47.Dalal S., Klemba M. Roles for two aminopeptidases in vacuolar hemoglobin catabolism in Plasmodium falciparum. J. Biol. Chem. 2007;282:35978–35987. doi: 10.1074/jbc.M703643200. [DOI] [PubMed] [Google Scholar]
- 48.Kolakovich K. A., Gluzman I. Y., Duffin K. L., Goldberg D. E. Generation of hemoglobin peptides in the acidic digestive vacuole of Plasmodium falciparum implicates peptide transport in amino acid production. Mol. Biochem. Parasitol. 1997;87:123–135. doi: 10.1016/S0166-6851(97)00062-5. [DOI] [PubMed] [Google Scholar]
- 49.McGowan S., Porter C. J., Lowther J., Stack C. M., Golding S. J., Skinner-Adams T. S., Trenholme K. R., Teuscher F., Donnelly S. M., Grembecka J., et al. Structural basis for the inhibition of the essential Plasmodium falciparum M1 neutral aminopeptidase. Proc. Natl. Acad. Sci. U.S.A. 2009;106:2537–2542. doi: 10.1073/pnas.0807398106. [DOI] [PMC free article] [PubMed] [Google Scholar]
- 50.Martin R. E., Kirk K. The malaria parasite's chloroquine resistance transporter is a member of the drug/metabolite transporter superfamily. Mol. Biol. Evol. 2004;21:1938–1949. doi: 10.1093/molbev/msh205. [DOI] [PubMed] [Google Scholar]
- 51.Benjamini Y., Hochberg Y. Controlling the false discovery rate–a practical and powerful approach to multiple testing. J. Roy. Stat. Soc. 1995;57:289–300. [Google Scholar]
Associated Data
This section collects any data citations, data availability statements, or supplementary materials included in this article.