Abstract
Background
Adiponectin plasma levels in chronic kidney disease (CKD) are two to three times higher than in individuals with normal kidney function. Despite adiponectin's anti-diabetic, anti-inflammatory and anti-atherogenic properties, patients with CKD have insulin resistance, systemic inflammation and accelerated atherogenesis. Hence, although adiponectin production is increased by adipose tissue in end-stage renal disease (ESRD), it is unclear if its effects on metabolism remain intact.
Methods
To determine if there is adiponectin resistance in ESRD, we measured tissue levels of adiponectin receptor-1 (AdipoR1) and adiponectin downstream effectors in ESRD patients compared with normal kidney function controls. Blood and tissue samples were obtained from participants at the time of kidney transplantation or kidney donation. A follow-up blood sample was obtained 3–6 months after transplantation.
Results
AdipoR1 was higher in muscle and peripheral blood mononuclear cells collected from ESRD patients. There was also a nonsignificant increase in AdipoR1 in visceral fat of ESRD compared with controls. Compared with controls, phosphorylation of the adiponectin downstream effector adenosine monophosphate-activated protein kinase (AMPK) was higher in ESRD while acetyl-CoA carboxylase phosphorylation (ACC-P) and carnitine palmitoyl transferase-1 (CPT-1) levels were lower. In vitro, exposure of C2C12 cells to uremic serum resulted in upregulation of AdipoR1 and increased phosphorylation of AMPK but decreased ACC-P and CPT-1 expression.
Conclusion
Both our in vivo and in vitro observations indicate that uremia results in upregulation of AdipoR1 but adiponectin resistance at the post-receptor level.
Keywords: adiponectin, cell signaling, ESRD, inflammation
INTRODUCTION
Adipokines, cytokines produced by adipose tissue, may serve as a link between obesity and its detrimental consequences [1]. Adiponectin is the most abundant cytokine produced by adipose tissue [2] and, unlike most other cytokines, has anti-inflammatory, anti-diabetic and anti-atherogenic properties [1]. Adiponectin levels measured in end-stage renal disease (ESRD) patients are two to three times higher than in individuals with normal kidney function [3]. Plasma levels of adipokines are elevated in ESRD independent of the body mass index (BMI) [4, 5] and had been associated with atherosclerosis, erythropoietin-resistant anemia, dampening of the immune response, malnutrition and increased mortality [6]. Adiponectin levels decrease after renal function is restored post-kidney transplantation, but never normalize to levels seen in patients with normal kidney function [7, 8]. ESRD and chronic kidney disease (CKD) patients do not have the beneficial effects of high adiponectin levels, possibly because these patients have higher circulating inflammatory cytokines, greater insulin resistance and have accelerated atherosclerosis [9].
We recently demonstrated increased adiponectin production from both visceral and subcutaneous adipose tissue in ESRD patients compared with normal kidney function controls [4], but it is not known if the adiponectin signaling pathway is altered in the uremic state. There are limited data on adiponectin receptors and downstream signaling in ESRD patients compared with normal kidney function controls.
Adiponectin has two membrane receptors, Adiponectin Receptor-1 and Adiponectin Receptor-2 (AdipoR1 and AdipoR2) [10]. There are no clear differences in the intracellular signaling pathways of AdipoR1 and AdipoR2 because both activate 5′ adenosine monophosphate-activated protein kinase (AMPK) and PPAR alpha pathways. Depending on the tissue studied, expression of one of the receptors will predominate. AdipoR1 seems to be more tightly linked to activation of AMPK pathways that inhibit gluconeogenesis and is more prominent in muscle tissue. Conversely, AdipoR2 seems to be associated more closely with the activation of PPAR alpha pathways that promote energy dissipation and the inhibition of inflammation and oxidative stress. AdipoR2 is expressed at higher levels in liver and adipose tissue.
Adiponectin binds to AdipoR1 in muscle tissue and activates the AMPK pathway by increasing the phosphorylation of AMPK. When the AMPK pathway is activated, it inactivates acetyl coenzyme A carboxylase (ACC) via phosphorylation resulting in fatty acid oxidation, glucose uptake and lactate production. The inactivation of ACC causes a decreased production of malonyl coenzyme A, which increases the production of carnitine palmitoyl transferase-1 (CPT-1), which is the rate-limiting step for fatty acid oxidation [11]. Consequently, tissue triglyceride content decreases and insulin sensitivity increases.
Metabolic and cardiovascular diseases are leading causes of morbidity in patients with CKD and ESRD. Whether the elevated adiponectin levels found in patients with kidney disease are cardio-protective remains controversial [12–14]. The disagreement is likely due to the complexity of the adiponectin signaling network as well as the lack of understanding of the biology of the hormone in the different stages of kidney disease.
If there are alterations in adiponectin signaling due to uremia, interventions could be developed to restore the protective functions of adiponectin in ESRD. The purpose of this study was to investigate whether the adiponectin signaling pathway is altered in patients with ESRD. We harvested adipose and muscle tissue from ESRD patients and donors with normal kidney function at the time of kidney transplantation. In both ESRD patients and controls, we quantified tissue levels of AdipoR1 and adiponectin downstream effectors.
MATERIALS AND METHODS
Design and subjects
We conducted a case–control study to determine mRNA and protein expression of AdipoR1 in muscle, blood and adipose tissue of ESRD participants and controls with normal kidney function. In muscle tissue, we also quantified expression of proteins that are part of adiponectin's cell signaling pathway including AMPK-P, acetyl-CoA carboxylase phosphorylation (ACC-P) and CPT-1.
Participants were recruited from the Thomas Jefferson University Hospital (TJUH) transplant program. Criteria for inclusion in the study included having ESRD and undergoing kidney transplantation at our institution. ESRD patients on renal replacement therapy or with CKD Stage 5 not on renal replacement therapy were included. The control group consisted of kidney donors with normal kidney function. Multi-organ transplants and patients with a functional pancreas transplant were excluded. Blood samples were obtained after fasting on the morning of transplantation or donation. While the participants were under general anesthesia for kidney donation or kidney transplantation, 250 mg of omental visceral fat, 250 mg of subcutaneous fat and 100 mg of skeletal muscle from the rectus abdominis were obtained. A follow-up blood sample was obtained 3–6 months post-transplantation once serum creatinine levels and immunosuppressive therapy had remained stable for at least 1 month (patients had unchanged calcineurin inhibitor dose with goal trough tacrolimus level of 5–7 ng/mL). The TJUH immunosuppression protocol withdraws steroids after the second month post-transplantation unless the participants were highly sensitized or had lost a prior transplant secondary to acute rejection. The immunosuppression regimen includes twice-daily tacrolimus to achieve a goal trough level of 5–7 ng/mL 3 months after transplantation and mycophenolic acid 1000 mg twice daily. All patients in the study cohort were maintained on tacrolimus. Only two participants did not receive mycophenolic acid, and one of these was maintained on azathioprine. Regarding steroid treatment, 10 of 21 ESRD participants received 5 mg of prednisone for maintenance immunosuppression at the time of the follow-up visit.
The study protocol was approved by the Institutional Review Board at TJU and written informed consent was obtained from each participant.
Biochemical assays
Approximately 100 mg of adipose tissue and 50 mg of muscle were submerged in RNAlater (Ambion, Carlsbad, CA), and blood was stored in Paxgene blood RNA tubes (Preanalytix, Hombrechtikon, Switzerland). RNA extraction from peripheral blood mononuclear cells (PBMCs) was performed with Paxgene blood RNA kit (Preanalytix) and RNA extraction from tissue was performed with RNeasy Lipid Tissue Mini Kit (Qiagen, Valencia, CA). AdipoR1 mRNA differential expression was performed with TaqMan Assays-on-Demand (Applied Biosystems, Foster City, CA). Reverse transcription and real-time polymerase chain reactions (RT-PCRs) were performed under universal conditions. The final expression value was normalized to GAPDH. Data are presented as the average ratios in tissue of target mRNA to a reference gene in arbitrary units. Adipose tissue immunoblot methods have previously been described [4]. For muscle immunoblot, 50 mg of muscle from ESRD participants and controls were homogenized with a bead beater in 400 mL of Laemmli buffer with protease and phosphatase inhibitors. The homogenate was spun at 1500 g for 10 min at 4°C and the upper layer was retrieved for protein quantification using the BCA method (Thermo Scientific, Rockford, IL). Twenty micrograms of the sample were mixed with 4X NuPAGE LDS sample buffer (Life Technologies, Grand Island, NY) and mercaptoethanol, and then loaded in a polyacrylamide gel (NuPAGE Novex 4–12% Bis Tris gels, NuPAGE Tris acetate 3–8% gels and Novex Tris–glycine 8–16%; Life Technologies) under reducing and heated conditions. Proteins were then transferred to a polyvinylidene fluoride membrane (Life Technologies). After transfer, membranes were blocked with 5% bovine serum albumin. Membranes were incubated with the primary antibody [AdipoR1, CPT-1 (Abcam, Cambridge, MA, USA), β-actin (Santa Cruz Biotechnology, Santa Cruz, CA), tubulin, AMPKp and ACCp (Cell Signaling Technology, Danvers, MA)] overnight at 4°C. Horseradish peroxidase conjugate secondary antibodies were incubated for 1h, and immunoreactivity, for target proteins and controls, was detected by an enhanced chemiluminescence system (SuperSignal West Dura Chemiluminescent Substrate; Thermo Scientific, Rockford, IL). Densitometry analysis of the blots was performed using imageJ software, http://rsbweb.nih.gov/ij/.
C2C12 culture and experiments
C2C12 myoblasts were obtained from American Type Culture Collection (ATCC, Manassas, VA). Cells were cultured in DMEM media supplemented with 20% fetal bovine serum, 100 U/mL penicillin and 100 µg/mL streptomycin (Life Technologies). Cells were differentiated to myotubes for the normal and uremic serum experiments by changing the growth media to DMEM and 2% horse serum (Gibco; Life Technologies). After differentiation, the media were changed to DMEM with uremic or normal serum obtained from study participants. After 5–48 h of exposure to uremic and normal serum, the cells were washed and lysed for western blot (WB) analysis with Laemmli buffer as previously described in the muscle immunoblotting section. Experiments were performed at least three times.
Statistical methods
Continuous data were summarized by the mean and SD. Data that were not normally distributed were presented as the median and interquartile range. Categorical data were summarized by frequencies and percentages. The Mann–Whitney U-test was used to compare differences in mRNA expression between ESRD and controls and the Student t-test to compare differences in densitometry readings. Correlation of mRNA expression levels between PBMC and tissue levels (skeletal muscle, visceral fat and subcutaneous fat) was calculated using Spearman's correlation coefficients. The significance level for all tests was set, in advance, at 0.05. All statistical analyses were conducted using SAS 9.3 (SAS Institute, Cary, NC).
RESULTS
Baseline characteristics
Our study sample included 21 ESRD patients without diabetes and 23 kidney donors with normal renal function as controls. The clinical characteristics of the study population are described in Table 1. In summary, the ESRD participants were older (46 versus 43 years, P = 0.39), heavier (81.6 versus 73.9 kg, P = 0.11) and had higher BMI (27 versus 25.7, P = 0.36) although the differences were not statistically significant. Compared with ESRD participants, the controls were also more frequently females (65 versus 29%, P = 0.02), but the percentages of African-American, Caucasian and other races in both groups were not significantly different (P = 0.99). The differences in baseline characteristics between our ESRD participants and healthy controls are representative of the ESRD and kidney donor population in the USA with older age and more obesity in recipients than donors and more female donors than recipients [15, 16].
Table 1.
Participants baseline characteristicsa
| Controls (n = 23) | ESRD, non-DM (n = 21) | Pb | |
|---|---|---|---|
| Age (years) | 43 (35, 49) | 46 (40, 52) | 0.39 |
| BMI (kg/m2) | 25.7 (22.1, 28.9) | 27.0 (23.8, 30.7) | 0.36 |
| Height (in) | 67 (64, 71) | 69 (67, 72) | 0.19 |
| Weight (lb) | 163 (144, 186) | 180 (166, 205) | 0.11 |
| Fasting blood sugar (mg/dL) | 87 (81, 92) | 91 (86, 96) | 0.14 |
| Creatinine (mg/dL) | 0.8 (0.7, 0.9) | 7.7 (5.7, 9.6) | <0.01 |
| Ccr (mL/min)d | 118 (109, 142) | 9.5 (8, 15)c | <0.01 |
| Sex (female) | 15 (65%) | 6 (29%) | 0.02 |
| Race | 0.99 | ||
| African-American | 4 (17%) | 4 (19%) | |
| Caucasian | 17 (74%) | 15 (71%) | |
| Other | 2 (9%) | 2 (10%) |
BMI, body mass index; Ccr, creatinine clearance; ESRD, end-stage renal disease.
aMedian (first quartile, third quartile) for continuous data or frequencies (percent) for categorical data.
bWilcoxon test or Fisher's exact test.
cn = 8 computed for ESRD participants that were not yet on dialysis.
dClearance in controls measured by 24 h urine collection, in ESRD participants that were not on dialysis pretransplantation by modification of diet in renal disease equation.
AdipoR1 protein and mRNA expression in ESRD
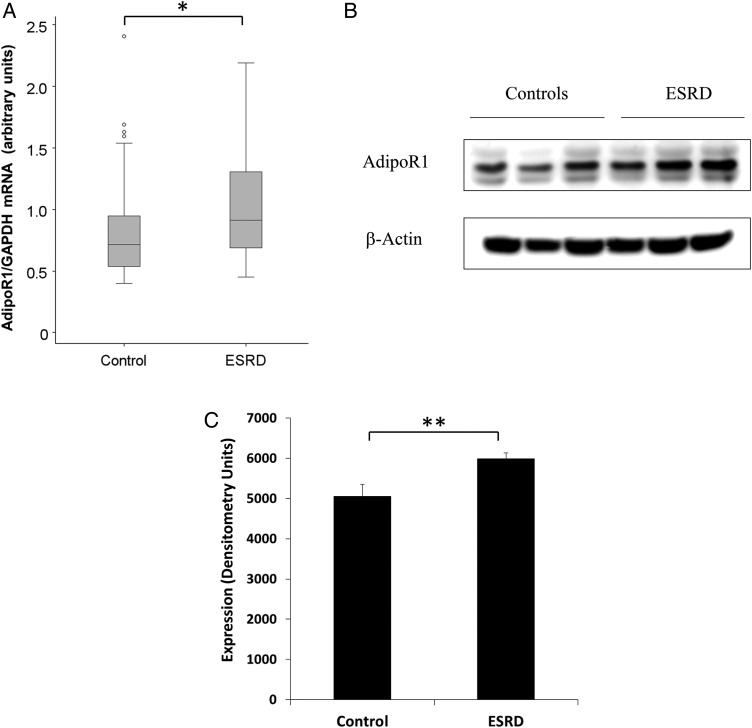
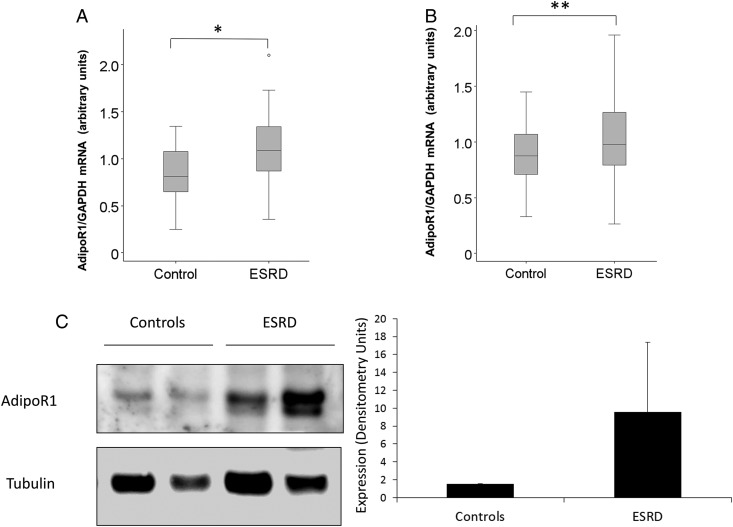
As shown in Figure 1, AdipoR1 mRNA and protein levels in skeletal muscle were higher in ESRD participants than in normal kidney function controls as detected by RT PCRs (Figure 1A), WB analysis (Figure 1B) and densitometry (Figure 1C). We also studied protein and mRNA expression levels of AdipoR1 in visceral and subcutaneous adipose tissue. Figure 2 demonstrates higher AdipoR1 mRNA expression in visceral fat (Figure 2A) and subcutaneous fat (Figure 2B). Although not statistically significant, AdipoR1 protein levels were higher in visceral adipose tissue (Figure 2C).
FIGURE 1:
AdipoR1 mRNA and protein expression is increased in skeletal muscle of ESRD participants. (A) The mRNA expression of AdipoR1 in muscle of ESRD participants compared with normal kidney function controls (*P < 0.001). (B) The protein expression of AdipoR1 protein in muscle of three ESRD participants compared with three controls by WB. (C) The representative densitometry analysis of the protein expression of AdipoR1 in muscle of ESRD participants versus controls (**P < 0.05).
FIGURE 2:
AdipoR1 mRNA expression is increased in adipose tissue of ESRD. (A) The mRNA expression of AdipoR1 mRNA in subcutaneous fat of ESRD participants versus normal kidney function controls (*P < 0.001). (B) The mRNA expression of AdipoR1 in visceral fat of ESRD participants versus normal kidney function controls (**P < 0.05). (C) A trend in higher protein expression of AdipoR1 in visceral fat of two ESRD participants versus two normal kidney function controls by WB with the representative densitometry analysis (between groups P = 0.28).
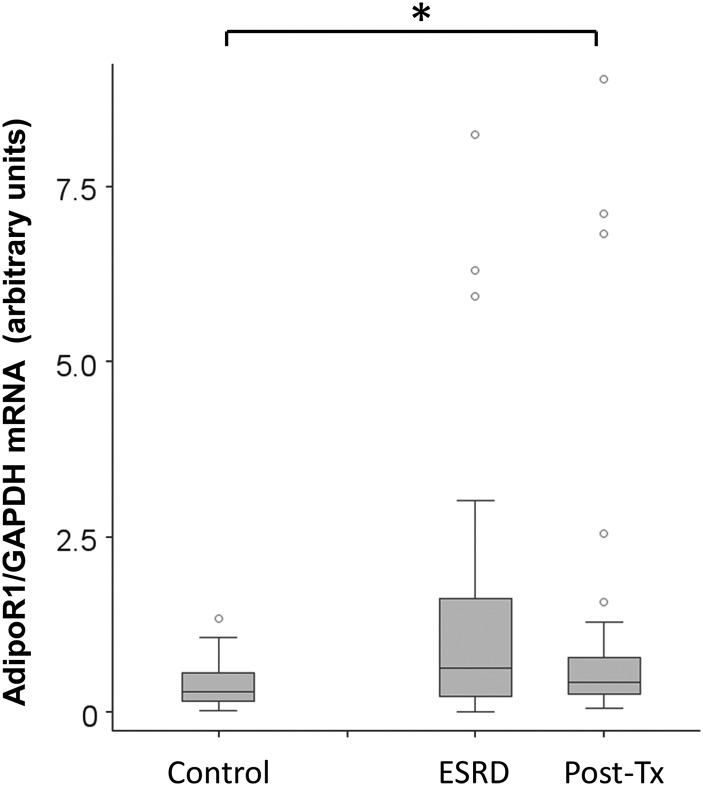
We then quantified AdipoR1 mRNA expression in PBMC in ESRD participants before kidney transplantation and 3–6 months post-transplantation when renal function was stable. As shown in Figure 3, AdipoR1 mRNA levels in PBMC were higher in ESRD participants compared with normal kidney function controls before transplantation (P = 0.01). Following renal transplantation, AdipoR1 mRNA levels in PBMC remained higher compared with controls. There was no significant difference in AdipoR1 mRNA expression levels in PBMC pre- and post-kidney transplantation.
FIGURE 3:
AdipoR1 mRNA 1 expression is higher in PBMCs of ESRD and kidney transplant recipients compared with controls. AdipoR1 mRNA expression was assayed in PBMC of ESRD participants before kidney transplantation and after transplant once kidney function was stable at nadir. AdipoR1 mRNA expression levels in kidney disease patients were compared with normal kidney function controls (*P < 0.05).
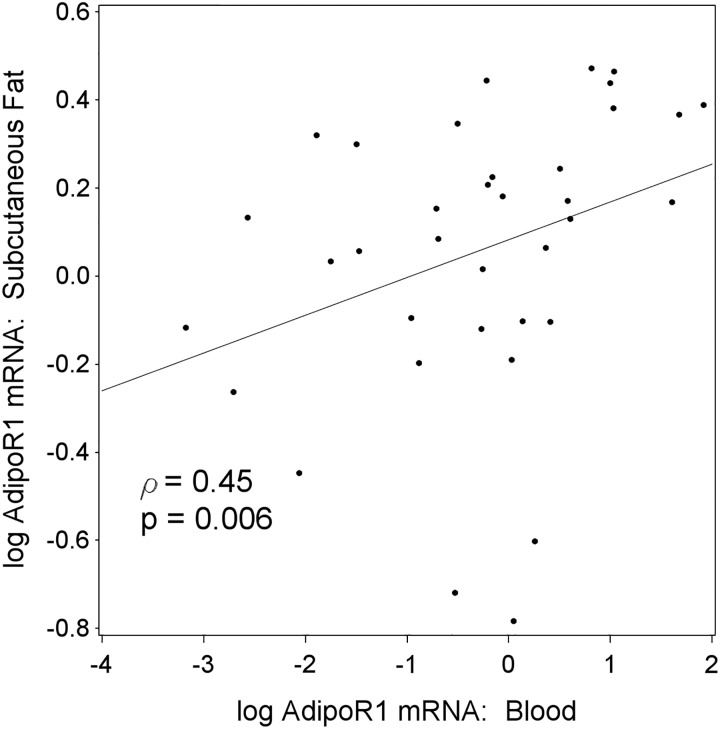
Due to the limited availability of adipose and muscle tissue longitudinally, we studied the correlation of adiponectin receptor levels in tissue and PBMC. We detected a statistically significant correlation of AdipoR1 mRNA levels between PBMC and subcutaneous fat in ESRD participants (Figure 4, P = 0.006). No correlation was found between AdipoR1 mRNA levels in PBMC and visceral fat or skeletal muscle in ESRD participants or between PBMC and either fat or muscle in controls (data not shown).
FIGURE 4:
Correlation of AdipoR1 mRNA levels between PBMC and tissue in ESRD participants. AdipoR1 mRNA levels in PBMC showed a significant correlation with the mRNA levels in subcutaneous fat of ERSD participants (P < 0.01).
Adiponectin downstream effectors in uremic muscle
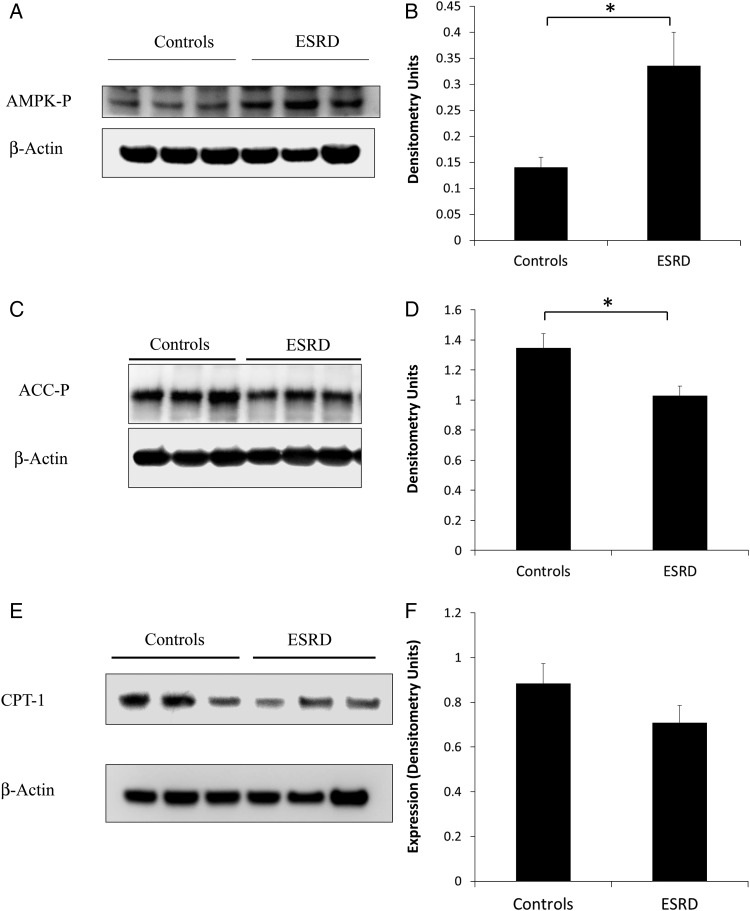
Adiponectin downstream effectors were assayed in skeletal muscle of ESRD participants and controls (Figure 5). Compared with controls, phosphorylation of AMPK was higher (Figure 5A and B) and phosphorylation of ACC (Figure 5C and D) was lower in muscle tissue of ESRD participants. CPT-1 protein levels (Figure 5E and F) were also lower in ESRD participants compared with normal kidney function controls although this difference did not reach statistical significance.
FIGURE 5:
Downstream effectors of adiponectin in muscle tissue. (A) AMPK-P levels in muscle tissue of ESRD participants versus normal kidney function controls by WB. (B) Representative densitometry of AMPK-P levels in muscle tissue of ESRD versus controls (*P < 0.05). (C) ACC-P levels in muscle tissue of ESRD participants versus normal kidney function controls by WB. (D) Representative densitometry of ACC-P levels in muscle tissue of ESRD versus controls (*P < 0.05). (E) CPT-1 protein levels in muscle tissue of ESRD participants versus normal kidney function controls by WB. (F) Representative densitometry of CPT-1 levels in muscle tissue of ESRD versus controls (P = 0.21).
Exposure to uremic serum upregulates AdipoR1 in C2C12 cells
To determine if the changes in adiponectin downstream effectors and the increase in AdipoR1 seen in ESRD participants are secondary to uremia, we exposed a myoblast cell line (C2C12) to different percentages of uremic and normal human serum.
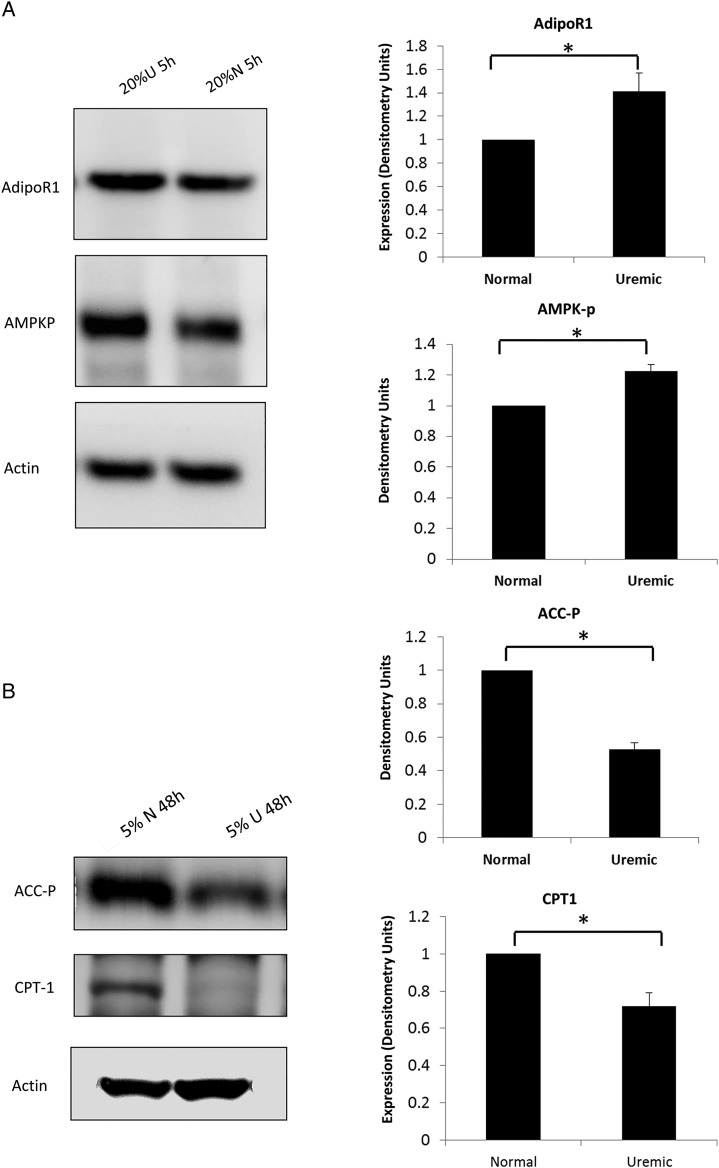
Figure 6A and B demonstrates that muscle cells exposed to uremic serum have higher levels of AdipoR1, increased phosphorylation of AMPK but decreased phosphorylation of ACC and lower CPT-1 levels (P < 0.05 for all panels). These results are consistent with the data obtained in ESRD participants and normal kidney function controls.
FIGURE 6:
Downstream effectors of adiponectin in C2C12 cells after treatment with uremic or normal serum. (A) AdipoR1 and AMPK-P levels by WB and correspondent densitometry analysis in C2C12 muscle cells exposed to 20% normal and 20% uremic serum for 5 h (representative WB of one of the three times the experiment was conducted). (B) ACC-P levels and CPT-1 protein expression by WB and correspondent densitometry analysis in C2C12 muscle cells exposed to 5% normal and 5% uremic serum for 48 h (representative WB of one of the triplicate conditions, *P < 0.05 for all).
DISCUSSION
Two major findings of this study are that in ESRD, there is upregulation of AdipoR1 in muscle tissue and there is disruption in the normal adiponectin signaling pathway compared with subjects with normal renal function. Assays on adiponectin downstream effectors demonstrated enhanced phosphorylation of AMPK but reduced phosphorylation of ACC and lower CPT-1 levels in ESRD muscle tissue compared with normal controls, suggesting that the adiponectin signaling is intact up to AMPK phosphorylation. In addition, following in vitro exposure of muscle cells to human uremic serum, AdipoR1 increased and the same alterations in adiponectin downstream effectors were detected. Both in vivo and in vitro results indicate that uremia upregulates adiponectin receptor expression in muscle and confers adiponectin resistance at the post-receptor level.
Adiponectin is a molecule, largely produced by fat cells, that has anti-inflammatory, anti-diabetic and anti-atherogenic properties [1]. Adiponectin circulates at a relatively high concentration (1–30 µg/mL) and is metabolized in the liver and possibly other organs, although the metabolic pathways have not been completely elucidated [17]. Because adiponectin normally circulates in plasma as a multimer, the high molecular weight makes it unlikely to be cleared by the glomerulus. When adiponectin binds to its specific receptor in muscle tissue, phosphorylation of AMPK increases, leading to an increase in ACC phosphorylation. Phosphorylated ACC leads to an increase in CPT-1 [11]. The net effect in muscle of the adiponectin downstream effectors is an increase in insulin sensitivity demonstrated by an increase in fatty acid oxidation, glucose uptake and lactate production [18, 19].
It is known that adiponectin plasma levels in CKD increase as glomerular filtration rate (GFR) decreases [20]. It has been postulated that the elevated adiponectin levels observed in CKD are a reflection of decreased renal clearance. Contrary to this notion, we previously demonstrated that adiponectin levels in both visceral and subcutaneous fat tissue are elevated in ESRD despite concomitant elevated plasma adiponectin levels indicating that adiponectin production is increased in ESRD [4]. In the same study, we could not demonstrate differences in mRNA expression of AdipoR2 in ESRD participant muscle or adipose tissue compared with controls. Because AdipoR1 is the most prominent adiponectin receptor in muscle and is responsible for the metabolic actions of the hormone, we focus on AdipoR1 to examine adiponectin downstream effectors in muscle. Our results demonstrate higher AdipoR1 protein in human ESRD skeletal muscle and most likely adipose tissue compared with controls. Similar upregulation of adiponectin receptor in renal tissues in uremia has been described in a mouse model of CKD by Yu et al. [21]. Shen et al. [22] reported higher expression of AdipoR1 in PBMC of ESRD patients compared with those of normal kidney function controls. Our data extend these findings to human muscle tissue, which, in addition to liver, is the main metabolic target for adiponectin. Increased adiponectin production and increased receptor expression, despite increased adiponectin levels, suggest a positive feedback system to explain adiponectin regulation in uremia. However, our assays of adiponectin downstream effectors revealed some novel findings. In human ESRD muscle, phosphorylation of AMPK is higher, as expected due to both higher circulating adiponectin and higherAdipoR1 levels in target tissues. However, contrary to the expected response of increased phosphorylation of ACC and CPT-1 expression, we found that both phosphorylation of ACC and expression of CPT-1 were lower in ESRD tissue. Our results indicate a block in adiponectin receptor signaling following phosphorylation of AMPK.
Chen et al. [23] investigated the adiponectin pathway in humans without known CKD. The investigators cultured human myocytes from lean, obese and obese diabetic participants and exposed the cells to globular adiponectin (gAdipo). They demonstrated that myocytes cultured from obese and obese diabetic participants have blunted activation of AMPK with exposure to gAdipo that was overcome with an increase in gAdipo dose. Moreover, myocytes from obese diabetics had no changes in ACC phosphorylation or fatty acid oxidation despite increased AMPK phosphorylation after exposure to higher doses of gAdipo. There was no difference in the expression of adiponectin receptors between the lean, obese and obese diabetic groups; there was also no difference in LKB1 activity, indicating that, with normal kidney function, the AMPK phosphorylation pathway was intact. Our data on ESRD patients and C2C12 cells exposed to uremic serum are reminiscent of the data of Chen et al. on obese patients where adiponectin signaling is altered downstream of phosphorylation of AMPK [23]. Similar to what was demonstrated in obese diabetic human myocytes after exposure to higher gAdipo levels, factors contained in the uremic and the proinflammatory environment may block the adiponectin signal transduction pathway resulting in adiponectin resistance distal to AMPK phosphorylation. Our data do not fully define adiponectin metabolism in ESRD but may provide some insights for new hypotheses and avenues of research. Future studies that focus on adiponectin post-receptor signaling will be necessary to determine the resistance mechanisms.
Our findings are not limited to ESRD but also apparent in CKD. We examined AdipoR1 mRNA expression in PBMC 3–6 months after kidney transplantation (GFR range: 40–60 mL/min) and found similar upregulation in AdipoR1 expression compared with normal kidney function controls. Therefore, we conclude that upregulation of AdipoR1 is present at earlier stages of CKD. Contrary to our findings, Shen et al. [24] reported that compared with controls with normal kidney function, AdipoR1 mRNA expression was higher in PBMCs in ESRD but lower in transplant patients with CKD. The discrepancy may be due to the inclusion of diabetics in the study by Shen et al. [24], as diabetes is commonly associated with lower circulating adiponectin and lower adiponectin receptor expression. It is also possible that different immunosuppressive drugs may affect AdipoR1 expression. However, there are no data on the effects of calcineurin inhibitors or antimetabolites on AdipoR1 expression. AdipoR1 expression decreases in rodents following exposure to steroids [24]. Similarly, in humans with normal kidney function, exposure to moderate doses of steroids (equivalent to 25 mg of prednisone) results in downregulation of AdipoR2. Diabetics have lower AdipoR2 expression, with no change in expression after similar exposure to steroids [26]. Our study was able to demonstrate higher AdipoR1 mRNA expression in ESRD participants after transplantation compared with controls despite the fact that half of them were on 5 mg of prednisone. The role of low dose steroids in AdipoR1 expression in CKD will need further studies. We were unable to obtain tissue after kidney transplantation to study adiponectin downstream effectors in more modest CKD. However, because insulin resistance is demonstrated in the early stages of kidney disease [9], it is quite possible that adiponectin resistance also occurs early in the course of kidney disease. We were only able to demonstrate a moderate positive correlation between blood and subcutaneous adipose tissue mRNA levels in patients with ESRD. Estimation of tissue results from blood samples should be considered with caution based on data from our study in ESRD patients. Future studies at earlier CKD stages that examine the adiponectin functional pathway in tissues could provide further insights on changes in adiponectin metabolism in CKD.
The role of adiponectin as a biomarker for cardiovascular disease in CKD is controversial. Low levels of adiponectin have been associated with increased risk of cardiovascular disease in dialysis patients by some groups [12], although others have found that high levels were associated with mortality in patients with CKD with or without diabetes [14, 27]. Other groups have emphasized that the relationship between adiponectin levels and cardiovascular disease in CKD may not be linear but quadratic with very high and very low levels associated with worse outcomes [13]. Altered adiponectin metabolism in diabetic patients may explain why there are different associations between adiponectin levels and cardiovascular disease in patients with ESRD and in those with diabetes mellitus. Adiponectin is involved in many biological pathways that should confer protection to vascular disease, inflammation and insulin resistance. Delineation of the adiponectin axis in CKD may help to clarify its role in the multiple metabolic and cardiovascular abnormalities that are exacerbated by uremia.
Our study has some limitations. Our human tissue studies are limited to ESRD and normal renal function controls, and we were unable to address earlier stages of CKD. The imbalance in the participant groups are intrinsic to the study population we are studying as there are more female donors and male recipients. Studies with more homogeneous groups should follow ours to validate our results. We did obtain mRNA data in PBMC longitudinally but since there is only a moderate positive correlation between blood and subcutaneous tissue mRNA levels, extrapolations of tissue results from blood samples should be considered with caution. Further studies should be done to determine if our findings can be reproduced. The data on adiponectin downstream effectors provides a static picture of adiponectin metabolism in ESRD. More detailed mechanistic studies are needed to fully determine adiponectin functions in ESRD.
In summary, we demonstrate that adiponectin receptor expression is upregulated by uremia in human tissues and our data indicate that adiponectin resistance occurs at the post-receptor level. This study reinforces the concept that impaired renal clearance of adiponectin does not fully explain elevated adiponectin levels in CKD. Further research is needed to determine the role of increased adiponectin production in kidney disease patients.
ACKNOWLEDGEMENTS
This work was supported in part by NIH grants (T32GM008562 for M.P.M.C.) and ADA grants (7-12-JF-41 for M.P.M.C.).
CONFLICT OF INTEREST STATEMENT
The authors have no interests to disclose. The results presented in this paper have not been published previously in whole or part, except in abstract format.
REFERENCES
- 1.Kadowaki T, Yamauchi T, Kubota N, et al. Adiponectin and adiponectin receptors in insulin resistance, diabetes, and the metabolic syndrome. J Clin Invest. 2006;116:1784–1792. doi: 10.1172/JCI29126. [DOI] [PMC free article] [PubMed] [Google Scholar]
- 2.Maeda K, Okubo K, Shimomura I, et al. cDNA cloning and expression of a novel adipose specific collagen-like factor, apM1 (AdiPose Most abundant Gene transcript 1) Biochem Biophys Res Commun. 1996;221:286–289. doi: 10.1006/bbrc.1996.0587. [DOI] [PubMed] [Google Scholar]
- 3.Adamczak M, Chudek J, Wiecek A. Adiponectin in patients with chronic kidney disease. Semin Dial. 2009;22:391–395. doi: 10.1111/j.1525-139X.2009.00587.x. [DOI] [PubMed] [Google Scholar]
- 4.Martinez Cantarin MP, Waldman SA, Doria C, et al. The adipose tissue production of adiponectin is increased in end-stage renal disease. Kidney Int. 2013;83:487–494. doi: 10.1038/ki.2012.421. [DOI] [PMC free article] [PubMed] [Google Scholar]
- 5.Roubicek T, Bartlova M, Krajickova J, et al. Increased production of proinflammatory cytokines in adipose tissue of patients with end-stage renal disease. Nutrition. 2009;25:762–768. doi: 10.1016/j.nut.2008.12.012. [DOI] [PubMed] [Google Scholar]
- 6.Stenvinkel P, Alvestrand A. Inflammation in end-stage renal disease: sources, consequences, and therapy. Semin Dial. 2002;15:329–337. doi: 10.1046/j.1525-139x.2002.00083.x. [DOI] [PubMed] [Google Scholar]
- 7.Chudek J, Adamczak M, Karkoszka H, et al. Plasma adiponectin concentration before and after successful kidney transplantation. Transplant Proc. 2003;35:2186–2189. doi: 10.1016/j.transproceed.2003.08.001. [DOI] [PubMed] [Google Scholar]
- 8.Idorn T, Hornum M, Bjerre M, et al. Plasma adiponectin before and after kidney transplantation. Transpl Int. 2012;25:1194–1203. doi: 10.1111/j.1432-2277.2012.01560.x. [DOI] [PubMed] [Google Scholar]
- 9.Becker B, Kronenberg F, Kielstein JT, et al. Renal insulin resistance syndrome, adiponectin and cardiovascular events in patients with kidney disease: the mild and moderate kidney disease study. J Am Soc Nephrol. 2005;16:1091–1098. doi: 10.1681/ASN.2004090742. [DOI] [PubMed] [Google Scholar]
- 10.Yamauchi T, Kamon J, Ito Y, et al. Cloning of adiponectin receptors that mediate antidiabetic metabolic effects. Nature. 2003;423:762–769. doi: 10.1038/nature01705. [DOI] [PubMed] [Google Scholar]
- 11.Yamauchi T, Kamon J, Minokoshi Y, et al. Adiponectin stimulates glucose utilization and fatty-acid oxidation by activating AMP-activated protein kinase. Nat Med. 2002;8:1288–1295. doi: 10.1038/nm788. [DOI] [PubMed] [Google Scholar]
- 12.Zoccali C, Mallamaci F, Tripepi G, et al. Adiponectin, metabolic risk factors, and cardiovascular events among patients with end-stage renal disease. J Am Soc Nephrol. 2002;13:134–141. doi: 10.1681/ASN.V131134. [DOI] [PubMed] [Google Scholar]
- 13.Rao M, Li L, Tighiouart H, et al. Plasma adiponectin levels and clinical outcomes among haemodialysis patients. Nephrol Dial Transplant. 2008;23:2619–2628. doi: 10.1093/ndt/gfn070. [DOI] [PMC free article] [PubMed] [Google Scholar]
- 14.Menon V, Li L, Wang X, et al. Adiponectin and mortality in patients with chronic kidney disease. J Am Soc Nephrol. 2006;17:2599–2606. doi: 10.1681/ASN.2006040331. [DOI] [PubMed] [Google Scholar]
- 15.Bethesda, MD: National Institutes of Health, NIDDK; 2011. United States Renal Data System: USRDS 2011 Annual Data Report. [Google Scholar]
- 16.2011 Annual Report of the U.S. Organ Procurement and Transplantation Network and the Scientific Registry of Transplant Recipients: Transplant Data 2011. Department of Health and Human Services, Health Resources and Service Administration, Healthcare Systems Bureau, Division of Transplantation, Rockville, MD; United Network for Organ Sharing, Richmond, VA; University Renal Research and Education Association, Ann Arbor, MI.
- 17.Halberg N, Schraw TD, Wang ZV, et al. Systemic fate of the adipocyte-derived factor adiponectin. Diabetes. 2009;58:1961–1970. doi: 10.2337/db08-1750. [DOI] [PMC free article] [PubMed] [Google Scholar]
- 18.Yamauchi T, Kamon J, Waki H, et al. The fat-derived hormone adiponectin reverses insulin resistance associated with both lipoatrophy and obesity. Nat Med. 2001;7:941–946. doi: 10.1038/90984. [DOI] [PubMed] [Google Scholar]
- 19.Tomas E, Tsao TS, Saha AK, et al. Enhanced muscle fat oxidation and glucose transport by ACRP30 globular domain: acetyl-CoA carboxylase inhibition and AMP-activated protein kinase activation. Proc Natl Acad Sci USA. 2002;99:16309–16313. doi: 10.1073/pnas.222657499. [DOI] [PMC free article] [PubMed] [Google Scholar]
- 20.Nanayakkara PW, Le Poole CY, Fouque D, et al. Plasma adiponectin concentration has an inverse and a non-linear association with estimated glomerular filtration rate in patients with K/DOQI 3–5 chronic kidney disease. Clin Nephrol. 2009;72:21–30. doi: 10.5414/cnp72021. [DOI] [PubMed] [Google Scholar]
- 21.Yu Y, Bao BJ, Fan YP, et al. Changes of adiponectin and its receptors in rats following chronic renal failure. Ren Fail. 2014;36:92–97. doi: 10.3109/0886022X.2013.830975. [DOI] [PubMed] [Google Scholar]
- 22.Shen YY, Charlesworth JA, Kelly JJ, et al. Up-regulation of adiponectin, its isoforms and receptors in end-stage kidney disease. Nephrol Dial Transplant. 2007;22:171–178. doi: 10.1093/ndt/gfl552. [DOI] [PubMed] [Google Scholar]
- 23.Chen MB, McAinch AJ, Macaulay SL, et al. Impaired activation of AMP-kinase and fatty acid oxidation by globular adiponectin in cultured human skeletal muscle of obese type 2 diabetics. J Clin Endocrinol Metab. 2005;90:3665–3672. doi: 10.1210/jc.2004-1980. [DOI] [PubMed] [Google Scholar]
- 24.Shen YY, Charlesworth JA, Kelly JJ, et al. The effect of renal transplantation on adiponectin and its isoforms and receptors. Metabolism. 2007;56:1201–1208. doi: 10.1016/j.metabol.2007.04.016. [DOI] [PubMed] [Google Scholar]
- 25.de Oliveira C, de Mattos AB, Biz C, et al. High-fat diet and glucocorticoid treatment cause hyperglycemia associated with adiponectin receptor alterations. Lipids Health Dis. 2011;10:11. doi: 10.1186/1476-511X-10-11. [DOI] [PMC free article] [PubMed] [Google Scholar]
- 26.Jang C, Inder WJ, Obeyesekere VR, et al. Adiponectin, skeletal muscle adiponectin receptor expression and insulin resistance following dexamethasone. Clin Endocrinol (Oxf) 2008;69:745–750. doi: 10.1111/j.1365-2265.2008.03242.x. [DOI] [PubMed] [Google Scholar]
- 27.Jorsal A, Tarnow L, Frystyk J, et al. Serum adiponectin predicts all-cause mortality and end stage renal disease in patients with type I diabetes and diabetic nephropathy. Kidney Int. 2008;74:649–654. doi: 10.1038/ki.2008.201. [DOI] [PubMed] [Google Scholar]


