

Abstract
Parkinson's disease (PD), the most common degenerative movement disorder, is caused by a preferential loss of midbrain dopaminergic (mDA) neurons. Both α-synuclein (α-syn) missense and multiplication mutations have been linked to PD. However, the underlying intracellular signalling transduction pathways of α-syn-mediated mDA neurodegeneration remain elusive. Here, we show that transgenic expression of PD-related human α-syn A53T missense mutation promoted calcineurin (CN) activity and the subsequent nuclear translocation of nuclear factor of activated T cells (NFATs) in mDA neurons. α-syn enhanced the phosphatase activity of CN in both cell-free assays and cell lines transfected with either human wild-type or A53T α-syn. Furthermore, overexpression of α-syn A53T mutation significantly increased the CN-dependent nuclear import of NFATc3 in the mDA neurons of transgenic mice. More importantly, a pharmacological inhibition of CN by cyclosporine A (CsA) ameliorated the α-syn-induced loss of mDA neurons. These findings demonstrate an active involvement of CN- and NFAT-mediated signalling pathway in α-syn-mediated degeneration of mDA neurons in PD.
INTRODUCTION
Parkinson's disease (PD) is pathologically characterized by a preferential loss of midbrain dopaminergic (mDA) neurons in the substantia nigra pas compacta (SNpc) and the presence of α-synuclein (α-syn)-containing cytoplasmic inclusions, termed Lewy bodies and Lewy neurites (1). Both missense mutation and gene multiplication in α-syn cause autosomal dominant forms of familial PD (2). In addition, the α-syn gene locus is also associated with the more common sporadic PD (3). Together, these genetic and neuropathological studies clearly indicate a prominent role of α-syn in the pathogenesis of PD. A variety of in vitro and in vivo experiments have been conducted to determine the underlying pathogenic mechanisms of the α-syn-induced degeneration of mDA neurons (4–8). For example, α-syn has been shown to interact with and affect the activity of the enzymes phospholipase D (9), protein kinase C, extracellular regulated kinases (10) and protein phosphatase 2A (11). In addition, α-syn binds to Ca2+ through a novel C-terminal domain, which affects the functional properties of α-syn (12). However, only a few of these studies have been carried out in SNpc DA neurons. The signalling pathways of α-syn-mediated mDA neuron loss remain to be established.
Calcineurin (CN) is a Ca2+/calmodulin-dependent serine/threonine-specific protein phosphatase enriched in neurons (13). The nuclear factor of activated T-cell (NFAT) family of transcription factors, including NFATc1, NFATc2, NFATc3 and NFATc4, are the main downstream targets of CN (14). In the resting cells, NFAT proteins are hyperphosphorylated and mainly reside in the cytoplasm. Upon activation, NFAT proteins undergo rapid dephosphorylation by CN and translocate into the nucleus, where they regulate gene transcription, in many cases via associations with other transcription factors (15). While the NFAT family of transcription factors was initially characterized in the immune system, recent studies have highlighted the importance of this family of proteins in neurons, where they are involved in the regulation of synaptic plasticity, axonal growth and neuronal survival (16,17). However, the involvement of CN and NFAT in the α-syn-mediated degeneration of mDA neurons is unclear.
In our present study, we investigated whether the presence of pathogenic α-syn affected the CN/NFAT signalling pathway in Human Embryonic Kidney 293 (HEK293) cells transfected with either wild-type (WT) or PD-related A53T mutant α-syn and in mDA neurons of α-syn A53T transgenic mice (18). We found that the overexpression of α-syn activated the CN and NFAT pathway in cell lines and mDA neurons, whereas the inhibition of CN/NFAT activity protected mDA neurons against α-syn-mediated cytotoxicity.
RESULTS
α-syn activates the phosphatase activity of calcineurin in cell-free assays
The CN phosphatase activity can be determined using the chromogenic substrate para-nitrophenyl phosphate (p-NPP) (19). We found that recombinant human α-syn proteins significantly enhanced the CN-mediated dephosphorylation of p-NPP in a cell-free assay (Fig. 1A). We then further examined the effect of α-syn on the CN activity by using RII peptide as the specific substrate in additional cell-free assays (20). Compared with the conveniently measurable p-NPP assay, the RII peptide assay is more sensitive and only a small amount of CN is needed (21). The sequence of phospho-RII peptide represents the phosphorylation site of the regulatory subunit of cAMP-dependent protein kinase, a well characterized and more physiological phosphopeptide substrate (20). We found that α-syn significantly enhanced the CN-induced dephosphorylation of phospho-RII in a dose-dependent manner (Fig. 1B).
Figure 1.

α-syn activates the phosphatase activity of purified calcineurin. (A–B) The effects of recombinant α-syn proteins on the purified CN activity were determined in vitro using p-NPP (A) or RII peptide (B) as the substrate. The CN activity assayed in the absence of α-syn represented 100% activity. Data were presented as mean ± SEM (n = 3). ***p < 0.001 compared with the control group.
Overexpression of WT or A53T α-syn enhances CN enzymatic activity and induces the translocation of NFATc1 and NFATc3 in HEK293 cells
CN normally consists of one catalytic subunit of calcineurin A (CnA) and one regulatory subunit of calcineurin B (CnB). The phosphatase activity of CN is fully activated upon the calcium-dependent binding of calmodulin to the CnA–CnB complex in response to the elevation of intracellular calcium (21). To explore the potential regulatory role of α-syn on CN, we examined the CN phosphatase activity and the CnA expression level in HEK293 cells transiently transfected with WT or PD-linked mutant A53T α-syn. We found that the phosphatase activity of CN was significantly increased by 28 and 35% in cells transfected with either WT or A53T α-syn compared with cells transfected with empty vectors (Fig. 2A). Moreover, the expression levels of the CnA subunit protein were not significantly altered in the α-syn-expressing cells (Fig. 2B). These results suggest that the overexpression of α-syn enhanced the activity of CN without affecting its protein expression levels.
Figure 2.

The overexpression of WT or A53T α-syn enhances the calcineurin enzymatic activity and induces the translocation of NFATc1 and NFATc3 in HEK293 cells. (A) The CN activity was measured using a synthetic peptide, RII, as the substrate and presented in form of millimoles of phosphate released/mg of protein/min at 30°C (n = 4). Data were presented as mean ± SEM. *P < 0.05, **P < 0.01 compared with the empty vector group. (B) Representative western blot analyses of CN expression levels in three groups (n = 4). Data were presented as mean ± SEM. (C) Western blot detection of NFATc1 and NFATc3 in the cytoplasmic and nuclear fractions from the control vector-, WT- and A53T α-syn-transfected HEK293 cells (n = 4). Forty-eight hours after transfection, the cells were harvested for western blot analysis. The β-actin (cytoplasmic) and HDAC1 (nuclear) expression levels were used as the loading control. The histograms represent the quantification of cytoplasmic and nuclear NFATc3 corrected by the loading control. (D, E) Bar graph depicts the nuclear/cytoplasmic ratios of NFATc1 and NFATc3. All histograms in D and E represent values as a percentage compared with the control group. Data were presented as mean ± SEM. *P < 0.05, **P < 0.01.
We next examined the activation of NFAT family proteins in α-syn-expressing cells. Antibodies against four different NFAT family members, including NFATc1, NFATc2, NFATc3 and NFATc4, were used to measure the expression of endogenous NFAT in the HEK293 cells. Consistent with a previous report (22), HEK293 cells predominantly expressed NFATc1 and NFATc3. To investigate whether the α-syn-induced activation of CN is sufficient to trigger the nuclear translocation of NFAT proteins, we examined the cytoplasmic and nuclear distribution of NFATc1 and NFATc3 in HEK293 cells transfected with either empty vector or α-syn expression constructs. Forty-eight hours after transfection, the cells were harvested for western blot analysis. The overexpression of both WT and A53T α-syn substantially altered the cytosolic and nuclear distribution of NFATc1 and NFATc3; a significant decrease in the cytoplasmic fraction and an increase in the nuclear fraction were observed (Fig. 2C). Accordingly, the nucleus/cytoplasm ratios of NFATc1 and NFATc3 proteins were significantly increased in the α-syn-transfected cells (Fig. 2D and E). Moreover, the total NFATc1 and NFATc3 levels did not differ in the whole cell extracts prepared from α-syn and empty vector-transfected cells (data not shown). Together, these data demonstrate that the overexpression of α-syn may lead to the enhanced CN activity and subsequent nuclear translocation of the NFAT family of transcription factors in cultured cells.
Stimulation of calcium ionophore ionomycin leads to nuclear translocation of NFATc3 in cultured mDA neurons
We investigated the expression levels of Nfatc1, Nfatc2, Nfatc3 and Nfatc4 mRNA in the SNpc DA neurons of 12-month-old mice by sequencing the total RNA prepared from the SNpc DA neurons isolated by laser capture microdissection. RNA sequencing was also used to compare the expression of Nfat family mRNA in the whole brain of 12-month-old mice. The RNA sequencing analyses showed that Nfatc3 mRNA was predominantly expressed in the mouse SNpc DA neurons and whole brain (Fig. 3A). To investigate the activation of CN/NFAT pathway in mDA neurons, we treated the cultured neurons with ionomycin and then stained them with antibodies specific for NFATc1-c4. Ionomycin can induce the release of calcium from the intracellular storage place (23). The mDA neurons did not show obvious staining for NFATc1, NFATc2 and NFATc4 (data not shown). In the resting cells, NFATc3 signals were mainly detected in the cytoplasm, whereas ionomycin treatment led to an almost complete nuclear translocation of NFATc3 (Fig. 3B). Here, tyrosine hydroxylase (TH), a cytosolic protein (24), served not only as a marker for dopaminergic neurons but also as an indicator of the cytosol of these neurons (Fig. 3B). These results suggest that NFATc3 is abundantly expressed in mDA neurons and can be regulated by Ca2+ stimulation.
Figure 3.
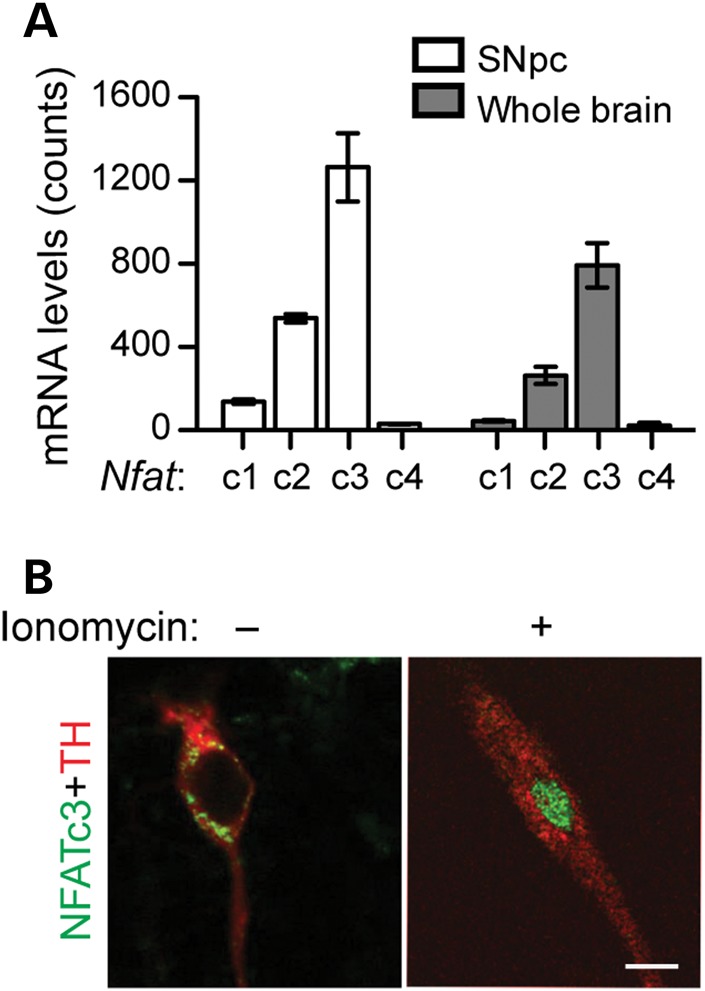
Stimulation of calcium ionophore ionomycin leads to the nuclear translocation of NFATc3 in cultured midbrain DA neurons. (A) RNA sequencing reveals the expression of Nfatc1, Nfatc2, Nfatc3 and Nfatc4 in SNpc DA neurons and the whole brain of 12-month-old control mice. Two independent SNpc and whole brain RNA samples were analysed. (B) Representative images show co-staining of endogenous NFATc3 (green) and TH (red) in primary mDA neurons with (+) or without (–) ionomycin stimulation. Scale bar: 20 μm.
The nuclear translocation of NFATc3 is significantly increased in the mDA neurons of A53T α-syn transgenic mice
To further examine whether NFATc3 is activated in the mDA neurons of A53T α-syn transgenic mice, we examined the expression levels of NFATc3 in the nuclear and cytoplasmic fractions of midbrain homogenates from 1-month-old non-transgenic (nTg) and A53T α-syn transgenic mice by western blot analysis. The total levels of NFATc3 were not significantly changed in the midbrain homogenates of A53T α-syn mice compared with controls (Fig. 4A). In contrast, the transgenic mouse midbrain homogenates showed a marked increase of NFATc3 immunoreactivity in the nuclear fraction and a trend towards the decrease of NFATc3 in the cytoplasmic fraction compared with the controls (Fig. 4B, top panel). Moreover, a significant increase in the nuclear/cytoplasmic ratio of NFATc3 was found in the mDA neurons of A53T α-syn mice (Fig. 4B, bottom panel).
Figure 4.

A53T transgenic mice show significant neuron loss accompanied by NFATc3 translocation in midbrain dopaminergic neurons. (A) Western blot was used to determine the level of A53T α-syn overexpression in the midbrain homogenate from 1-month-old A53T transgenic mice compared with littermate nTg mice using an antiserum (C20) recognizing both human and mouse α-syn. β-actin and TH were used as the loading control. The bar graph estimates the level of α-syn overexpression (normalized against the TH expression) in the midbrain of 1-month-old A53T mice compared with that of age-matched littermate nTg mice (n = 4 per genotype). (B) Western blot detection of NFATc3 in total, cytoplasmic and nuclear homogenates from the midbrains of nTg and A53T mice (n = 4 per group). The expression of β-actin (total and cytoplasmic) or nucleoporin 62 (nuclear) was used as the loading control. The histograms represent the quantification of total, cytoplasmic and nuclear NFATc3 corrected by the loading control. Data were presented as mean ± SEM. **P < 0.01 compared with the nTg group. (C) Representative images of NFATc3 (green) and TH (red) co-staining in the midbrain sections of 1-month-old nTg and A53T mice. Topro3 (blue) staining marked the nucleus. The arrowhead points to the cytoplasmic localization of NFATc3. The asterisks label the nuclear localization of NFATc3. Scale bar: 10 μm. (D) The percentage of total cellular NFATc3 staining of TH-positive neurons (n = 4 animals per genotype, and n = 16 neurons per animals) and the nuclear/cytoplasmic ratio of NFATc3 staining. All histograms represent A53T mice values as a percentage compared with the nTg group. Data were presented as mean ± SEM. **P < 0.01.
To further confirm the increased nuclear translocation of NFATc3 in the mDA neurons of A53T α-syn transgenic mice, we checked the subcellular distribution of NFATc1, NFATc2, NFATc3 and NFATc4 in the mDA neurons of 1-month-old A53T α-syn transgenic and littermate nTg mice by immunostaining. The mDA neurons of A53T α-syn transgenic mice did not show obvious staining for NFATc1, NFATc2 and NFATc4 antibodies (data not shown). In contrast, NFATc3 staining was detected in the mDA neurons of both nTg and A53T α-syn transgenic mice (Fig. 4C). While the NFATc3 signals were mainly detected in the cytosol of nTg neurons, they were predominantly distributed in the nuclei of mDA neurons in A53T α-syn transgenic mice (Fig. 4C). An additional image analysis revealed a significant increase in the nuclear distribution of NFATc3 in the mDA neurons of A53T α-syn transgenic mice compared with the controls (Fig. 4D). Therefore, both western blot and immunocytochemistry analyses demonstrate that overexpression of PD-related A53T α-syn leads to the nuclear translocation of NFATc3 in mDA neurons.
Pharmacological inhibition of CN activity ameliorated α-syn-induced mDA neuron loss in primary culture
The immunosuppressant cyclosporine A (CsA) is a specific inhibitor of CN (21). We found that pre-treatment with CsA blocked the WT α-syn-induced dephosphorylation of NFATc3 in transfected HEK293 cells (Fig. 5A). We then investigated whether CN/NFATc3 activation was involved in the α-syn-mediated loss of TH-positive mDA neurons (18). We treated mDA neuronal cultures from neonatal A53T α-syn and littermate control pups with the CN inhibitor CsA or vehicle (DMSO) after 5 days in vitro and then counted the numbers of surviving TH-positive neurons 2 days after the treatment. We observed an ∼47% loss of TH-positive mDA neurons in the vehicle-treated A53T α-syn cultures compared with the controls (Fig. 5B). In contrast, treatment with 1 μm CsA, which did not affect the survival of control TH-positive neurons, significantly increased the survival of TH-positive neurons in the A53T α-syn cultures compared with the vehicle-treated ones (Fig. 5B). Furthermore, we found that CsA treatment blocked the nuclear translocation of NFATc3 in the TH-positive dopaminergic neurons of A53T α-syn cultures (Fig. 5C). These observations provide direct evidence that the CN/NFATc3 pathway is involved in α-syn-induced mDA neuron loss.
Figure 5.
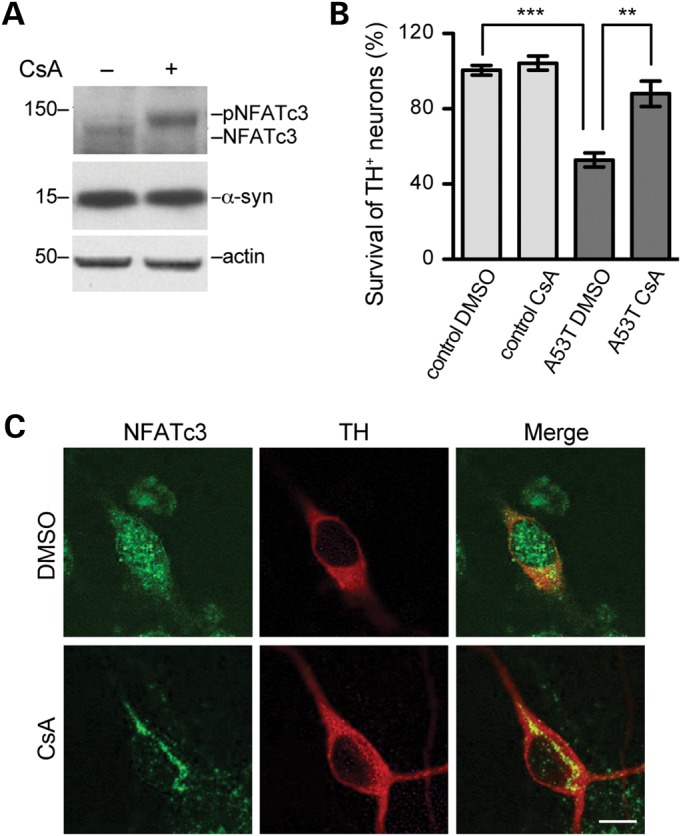
CsA treatment ameliorated A53T α-syn-induced loss of midbrain dopaminergic neurons. (A) CsA induces NFATc3 phosphorylation in HEK293 cells transfected with WT α-syn. (B) Survival of TH-positive neurons treated with DMSO or 1 μm CsA. Y-axis represents the survival rate (%) of TH-positive neurons. Six pairs of control and A53T cultures were analysed for DMSO or CsA treatment, respectively. For each culture, 200–500 TH-positive neurons were counted. Data were presented as mean ± SEM. **P < 0.01, ***P < 0.001 compared with the A53T DMSO group. (C) Representative images show co-staining of NFATc3 (green) and TH (red) in primary mDA neurons from neonatal A53T α-syn pups treated with CsA or DMSO. Scale bar: 20 μm.
DISCUSSION
In this study, we employed a new line of α-syn A53T conditional transgenic mice to investigate the CN/NFAT signalling pathway in mDA neurons (18). We found that α-syn promoted the CN phosphatase activity, leading to NFATc3 nuclear import in cell cultures and mDA neurons of transgenic mice expressing PD-related A53T α-syn. Moreover, the pharmacological inhibition of CN activity ameliorated α-syn-induced loss of mDA neurons. These findings suggest that the CN/NFATc3 signalling pathway may contribute to α-syn-mediated mDA neuron loss in PD.
α-syn overexpression has been used to generate cellular and animal models of PD. The overexpression of WT or mutant α-syn induces cell death in dopaminergic cell lines and primary dopaminergic neuron cultures (8,25). Transgenic mice expressing WT or mutant α-syn show motor deficits and changes in dopamine levels (5). Although the excessive aggregation of α-syn has been associated with neurodegeneration, the mechanism by which α-syn injures dopaminergic neurons remains to be fully established. Several hypotheses have been proposed, including α-syn-induced Ca2+ dyshomeostasis. More recently, oligomeric forms of α-syn have been proposed to be the most neurotoxic form of this protein. α-syn oligomers trigger Ca2+ influx and the subsequent caspase activation in cultured neurons and neuroblastoma cells (26,27). α-syn has been suggested to be able to form Ca2+ permeable pores in the plasma membrane, much like other aggregating proteins, such as amyloid β peptides and prion proteins (28). Notably, the SNpc DA neurons are pace-making neurons that keep firing through an L-type calcium channel (29). As the result, the alteration of calcium homeostasis may make the SNpc DA neurons more vulnerable to PD-related degeneration (29). In line with this notion, the analyses of central nervous system tissues from patients with PD suggest a role for cellular Ca2+ overload in the death of vulnerable neurons in this disease (29). The hypothesis that α-syn may trigger Ca2+ influx, together with the more general concept that perturbed Ca2+ homeostasis is of central importance to neurodegenerative processes (30), prompted us to determine the potential effects of increased α-syn levels on processes downstream of the Ca2+-signalling pathway.
In our study, we identified a new calcium-dependent pathway in dopaminergic neuron loss. We found that α-syn directly activated CN activity on the small phosphorylated compound p-NPP as well as the 19 amino acid phosphopeptide RII. In addition, we also observed a similar increase in the CN activity in WT or A53T α-syn-transfected HEK293 cells. The activation of CN leads to the dephosphorylation of key signal transduction molecules, including the NFAT family of transcription factors (31). The dephosphorylated NFAT is transferred from the cytosol into the nucleus, where it induces the expression of target genes, such as cytokine genes, in human T cells in cooperation with other transcription factors, such as AP-1 (32). Here, we found a typical nuclear translocation of NFATc3 in mDA neurons in response to ionomycin stimulation. More importantly, we observed a significant translocation of NFATc3 from the cytosol to the nucleus in the mDA neurons of A53T α-syn transgenic mice. However, the function and downstream targets of NFAT in mDA neurons remain to be determined.
Although originally described in T cells, NFATs are now known to participate in the regulation of CN-mediated transcriptional activity in axonal growth, dendritic branching and presynaptic differentiation (17,33,34). A combined deletion of either NFATc3/NFATc4 or NFATc2/NFATc3/NFATc4 isoforms leads to a marked deficiency in axonal development (16). Moreover, NFATc3 and NFATc4 have also been implicated in the regulation of neuronal survival (35). For example, NFATc4 activation has also been recently proposed to mediate deafferentation-induced neuronal loss in the cochlear nucleus (36). Furthermore, increased CN levels and the associated shuttling of NFATc3 and NFATc4 from the cytosol to the nucleus are indicated in methamphetamine-induced neuron death (37). NFAT translocation also induced FasL protein expression in striatal GABAergic neurons, which may be related to neuronal apoptosis and cognitive defects in patients who abuse methamphetamine (38). Given that NFAT activation contributes to the loss of neurons, the α-syn-mediated translocation of NFATc3 may contribute to the mDA neurodegeneration in PD. In support of this hypothesis, we found that treatment with the CN inhibitor CsA rescued the α-syn-induced loss of primary mDA neuron cultures. Notably, CsA not only inhibits CN-dependent NFAT transcriptional activation but also blocks the mitochondrial Ca2+ fluxes by binding to the mitochondrial receptor cyclophylin D (CypD) (39,40). However, whether the mitochondrial calcium homeostasis is altered in the mDA neurons of A53T α-syn transgenic mice remains to be determined. In addition, it will be interesting to identify the downstream targets of NFATc3 in mDA neurons, which may provide new molecular targets for potential therapeutic interventions.
MATERIALS AND METHODS
Cell line culture and transfection
HEK293 cells were cultured in 100-mm dishes with Dulbecco's Modified Eagle's Medium supplemented with 10% heat-inactivated foetal bovine serum (FBS) (Invitrogen) and penicillin/streptomycin (Sigma–Aldrich). Six micrograms of WT and A53T α-syn cDNAs in the pcDNA3.1expression vector (Invitrogen) were used for each transfection via the Fugene 6 Transfection Reagent (Roche Applied Science) according to the manufacturer's instructions. The cells were allowed to grow for 48 h after transfection before being harvested for the following experiments. The cell suspension was washed with three volumes of ice-cold phosphate-buffered saline by repeated centrifugation at 500×g for 2 min at 4°C. The cells were lysed in appropriate buffers to determine the CN enzyme activity and for the western blot analysis.
Nuclear and cytoplasmic fractionation
The NE-PER nuclear and cytoplasmic extraction kit (Thermo Fisher Scientific, Inc.) was used to separate the cytoplasmic and nuclear fractions of HEK293 cells and mouse midbrain tissues according to the instruction of the manufacturer. β-actin was used as the loading control for the cytosolic proteins, and histone deacetylase-1 (HDAC1) was used as the loading control of nuclear proteins.
Western blot analysis
The HEK293 cells or midbrain tissues were homogenized in SDS buffer (50 mm Tris–HCl, 150 mm NaCl, 2 mm EDTA, pH 7.6, and 2% SDS) supplemented with protease inhibitors (Roche Applied). Following 15-min incubation on ice, the protein extracts were clarified by centrifugation at 15 000×g for 30 min at 4°C. The protein contents of the supernatants were quantified using an assay kit based on bicinchoninic acid (Thermo Scientific), and the supernatants were then separated by 4–12% NuPage Bis-Tris–polyacrylamide gel electrophoresis (Invitrogen) using MES or MOPS running buffer (Invitrogen). After transferring to nitrocellulose membranes, the membranes were immunoblotted with the appropriate dilutions of primary antibodies: α-syn (1 : 500, Santa Cruz), β-actin (1 : 1000, Sigma), tyrosine hydroxylase (anti-TH antibody, 1 : 1000, Santa Cruz), NFATc3 (F-1 monoclonal antibody, 1 : 500, Santa Cruz), NFATc1 (7A6 monoclonal antibody, 1 : 500, Santa Cruz) or calcineurin (pan-calcineurin A antibody, 1 : 1000, Cell Signaling). The signals were visualized by enhanced chemiluminescence development (Thermo Scientific) and quantified by a Scion Image System (Frederick, MD).
Calcineurin activity assay
The CnA and CnB subunits for the activity assay were expressed and purified according to the description (40). The protein purity was analysed by SDS–PAGE. The purified CnA was concentrated with an Amicon Ultra Filter Unit and diluted in 50 mm Tris–HCl, 0.5 mm dithiothreitol, 0.1 mg/ml BSA and 50% glycerol. A colorimetric assay was used to determine the activities of CN with 20 mm p-NPP or RII peptide as the substrate. The reaction was terminated after reacting at 30°C for 10 min. The same vehicle without recombinant human α-syn (ProSpec, Israel) was used as a control. The recombinant human α-synuclein produced in Escherichia Coli is purified by proprietary chromatographic techniques, and the purity is >95.0% as determined by SDS–PAGE. The CN activity of each sample was determined in triplicate. The phosphatase activities are presented as % of the control.
The CN activity in HEK293 cells was determined with a Calcineurin Cellular Assay Kit (PLUS-AK-816, Enzo Life Sciences) according to manufacturer's instructions. Briefly, the CN activity was measured as the dephosphorylation rate of the RII peptide. The amount of PO4 released was calorimetrically determined with the classic malachite green reagent. The activity was calculated as the difference in protein phosphatase activity in 2× assay buffer and 2× EGTA buffer. The CN activity of each sample was determined in triplicate. The phosphatase activities are presented as millimoles of phosphate released/mg of protein/min at 30°C.
Human A53T α-syn transgenic mice
The PITX3-IRES-tTA/tetO-A53T double transgenic mice were generated as previously described (18). Mice were housed in a 12-h light/dark cycle and fed a regular diet ad libitum. All mouse work followed the guidelines approved by the Institutional Animal Care and Use Committees of the National Institute of Child Health and Human Development, NIH.
Genotyping
The genomic DNA was extracted from a tail biopsy using the DirectPCR Lysis Reagent (Viagen Biotech, Inc., Los Angeles, CA, USA) and subjected to PCR amplification using specific sets of PCR primers for each genotype, including PITX3-IRES2-tTA transgenic mice (PITX3-F: GACTGGCTTGCCCTCGTCCCA and PITX3-R: GTGCACCGAGGCCCCAGATCA), α-syn A53T transgenic mice (PrpEx2-F: TACTGCTCCATTTTGCGTGA and SNCA-R: TCCAGAATTCCTTCCTGTGG) and tetO-H2Bj-GFP mice (H2BGFP0872F, AAGTTCATCTGCACCACCG and H2BGFP1416R, TCCTTGAAGAAGATGGTGCG).
Immunohistochemistry and light microscopy
To immune-stain the mouse midbrain sections, the mice were sacrificed and then perfused via cardiac infusion with 4% paraformaldehyde in cold PBS. To obtain frozen sections, the brain tissues were removed, cryo-protected in 30% sucrose for 24 h and sectioned at 40 μm thickness using a cryostat (Leica CM1950). Antibodies specific to NFATc3 (1 : 300, Sigma–Aldrich USA, St. Louis, MO, USA), α-syn and tyrosine hydroxylase (TH) (1 : 1000, Pel-Freez Biologicals, Rogers, AR, USA) were used as suggested by the manufacturers. Alexa 488- or Alexa 568-conjugated secondary antibody (1 : 500, Invitrogen) was used to visualize the staining. The fluorescence images were captured using a laser scanning confocal microscope (LSM 510; Zeiss, Thornwood, NJ, USA). Sections from Bregma-2.92 to -3.16 mm of control and A53T transgenic mice were used for immunostaining and the following image analyses. Sixteen TH-positive neurons were selected from each brain that showed intact nuclear structure based on Topro3 staining. The paired images in all figures were collected at the same gain and offset settings. Post-collection processing was uniformly applied to all paired images. The images are presented as either a single optic layer after acquisition in z-series stack scans at 0.8-μm intervals from individual fields or as maximum intensity projections to represent confocal stacks.
Laser capture microdissection and RNA-sequencing analysis
We adopted whole-genome gene expression analyses of DA neurons isolated from the SNpc of 12-month-old α-syn A53T transgenic mice and age-matched control mice. To facilitate the identification of mDA neurons, we generated the Pitx3-tTA::tetO-H2Bj-GFP::tetO-A53T triple transgenic mice and control Pitx3-tTA::tetO-H2Bj-GFP double transgenic mice, in which the histone-GFP fusion proteins (H2Bj-GFP) are restricted to the nucleus of TH-positive DA neurons in both the SNpc and ventral tegmental area (VTA) (18). The midbrain DA neurons were isolated directly without any staining owing to the strong GFP signals, and the integrity of RNA was preserved for the later RNAseq experiments. The strong GFP signals allowed directly isolate the midbrain DA neurons without any staining and help to preserve the integrity of RNA for the later RNAseq experiments. The total RNA was extracted with the PicoPure Isolation kit (Applied Biosystems). The genomic DNA was eliminated during the RNA isolation process. The RNA quantity was measured with NanoDrop-Spectrophotometer, and the quality was evaluated with BioAnalyzer. The libraries for TruSequencing were set up from 100-ng total RNA fragmented to ∼200-base pair length. The cDNA libraries were amplified by PCR and validated by the BioAnalyzer. The deep RNA sequencing was performed on the Illumina HiSeq 2500 on 2 × 100 bp type for 200 cycles with the Illumina TruSeq SBS kit. After sequencing instrument generates the sequencing images, both image analysis step and base call steps were run using standard Illumina pipeline. Raw sequences were filtered and trimmed based upon quality scores over read cycles. Then, we aligned the paired-end sequencing reads to mouse reference genome (mm10) using Bowtie2 (2.1.0) package and Samtools (0.1.14) toolkit. We then utilized Cufflinks (2.1.1) to annotate sequencing reads and estimate transcripts abundances. The 10-mm transcript sequences from NCBI Reference Sequence Database were used as the annotation reference. We used DEGSeq, a Bioconductor R package, in downstream count-based analysis for differential expression among samples with different genotypes.
Primary neuronal culture and treatment
Primary midbrain neuronal cultures were prepared from P0 pups of breeding pairs fed with doxycycline (DOX). Briefly, individual midbrain containing SNpc and VTA was subjected to papain digestion (5 U/ml, Worthington) for 40 min at 37°C. The digested tissue was carefully triturated into single cells using increasingly smaller pipette tips. The cells were then centrifuged at 250×g for 5 min and re-suspended in warm Basal Medium Eagle supplemented with 5% heat-inactivated FBS, 1× B27 (Gibco), 1× N2 (Gibco), 1× GlutaMAX, 0.45% D-glucose (Sigma), 10 U/ml penicillin (Gibco) and 10 g/ml streptomycin (Gibco). The dissociated cells from each midbrain were equally divided and plated onto four 12-mm round coverslips pre-coated with poly-D-lysine and laminin (BD Bioscience), and the slips were maintained at 37°C in a 95% O2- and 5% CO2-humidified incubator. Twenty-four hours after seeding, the cultures were switched to serum-free medium supplemented with 5 m cytosine-d-arabino-furanoside (Sigma), which was used to suppress the proliferation of glia. The cells in two sister coverslips were maintained in the presence of 1 μg/ml DOX after plating. After 5 days in vitro, DOX-treated or non-treated cells were exposed to 1 μm CsA (Sigma) or DMSO vehicle control for another 48 h. The cells were then fixed with 4% paraformaldehyde and 4% sucrose in PBS for 15 min, permeabilized by 0.1% Triton X-100 for 5 min and blocked in 10% non-immune donkey serum for 1 h at room temperature (RT). The cells were then double-labelled with primary antibodies against TH (1 : 1000, Santa Cruz) and NFATc3 (1 : 1000, Sigma) overnight at 4°C in a humidified chamber. After three washes with PBS, donkey-derived secondary antibodies conjugated to Alexa Fluor 488 and Alexa Fluor 546 (1 : 1000, Invitrogen) were applied and incubated for 1 h at RT in the dark. After extensive washes, the nuclei were stained with Topro3 iodide (1 : 1000, Invitrogen). Finally, the coverslips were mounted on glass slides with Prolong Gold antifade reagent (Invitrogen), and the fluorescence signals were detected using a laser scanning confocal microscope (LSM 510; Zeiss). The total number of all TH-positive neurons on each of the four sister coverslips was counted under a 25× objective. Owing to the different amounts of midbrain neurons in each mouse, we used the relative survival rate of TH-positive neurons in each midbrain. The rate was calculated by dividing the number of TH-positive neurons on the non-DOX-treatment coverslip with the number of TH-positive neurons on the DOX-treated coverslip from the same midbrain preparation.
Image analysis
To quantitatively assess the marker protein distributions, images were taken using identical settings and exported to ImageJ (NIH) for imaging analyses. The images were converted to an 8-bit colour scale (fluorescence intensity from 0 to 255) using ImageJ. The areas of interest were first selected with Polygon or Freehand selection tools and then subjected to measurement by mean optical intensities or area fractions. The mean intensity for the background area was subtracted from the selected area to determine the net mean intensity.
Statistical analysis
A statistical analysis was performed using GraphPad Prism 5 (GraphPad Software, Inc., La Jolla, CA). The data are presented as the mean ± SEM. Statistical significances were determined by comparing means of different groups and conditions using t-test, one-way ANOVA with post hoc test. *P < 0.05, **P < 0.01, ***P < 0.001.
FUNDING
This work was supported in part by the intramural research programs of National Institute on Aging (AG000928, AG000929) and by the National Natural Science Foundation of China (Project 81072648 and 81373389).
ACKNOWLEDGEMENTS
The authors thank members of Cai lab for providing various supports, Mr Christopher Letson and Dr J. Raphael Gibbs for helping with RNAseq experiments, and China Scholarship Council (CSC) for its international exchange programs.
Conflict of Interest statement. None declared.
REFERENCES
- 1.Forno L.S. Neuropathology of Parkinson's disease. J. Neuropathol. Exp. Neurol. 1996;55:259–272. doi: 10.1097/00005072-199603000-00001. [DOI] [PubMed] [Google Scholar]
- 2.Hardy J., Cai H., Cookson M.R., Gwinn-Hardy K., Singleton A. Genetics of Parkinson's disease and parkinsonism. Ann. Neurol. 2006;60:389–398. doi: 10.1002/ana.21022. [DOI] [PubMed] [Google Scholar]
- 3.Singleton A.B., Farrer M., Johnson J., Singleton A., Hague S., Kachergus J., Hulihan M., Peuralinna T., Dutra A., Nussbaum R., et al. α-Synuclein locus triplication causes Parkinson's Disease. Science. 2003;302:841. doi: 10.1126/science.1090278. [DOI] [PubMed] [Google Scholar]
- 4.Feany M.B., Bender W.W. A drosophila model of Parkinson's disease. Nature. 2000;404:394–398. doi: 10.1038/35006074. [DOI] [PubMed] [Google Scholar]
- 5.Giasson B.I., Duda J.E., Quinn S.M., Zhang B., Trojanowski J.Q., Lee V.M. Neuronal alpha-synucleinopathy with severe movement disorder in mice expressing A53T human alpha-synuclein. Neuron. 2002;34: 521–533. doi: 10.1016/s0896-6273(02)00682-7. [DOI] [PubMed] [Google Scholar]
- 6.Lakso M., Vartiainen S., Moilanen A.M., Sirvio J., Thomas J.H., Nass R., Blakely R.D., Wong G. Dopaminergic neuronal loss and motor deficits in Caenorhabditis elegans overexpressing human alpha-synuclein. J. Neurochem. 2003;86:165–172. doi: 10.1046/j.1471-4159.2003.01809.x. [DOI] [PubMed] [Google Scholar]
- 7.Thiruchelvam M.J., Powers J.M., Cory-Slechta D.A., Richfield E.K. Risk factors for dopaminergic neuron loss in human alpha-synuclein transgenic mice. Eur. J. Neurosci. 2004;19:845–854. doi: 10.1111/j.0953-816x.2004.03139.x. [DOI] [PubMed] [Google Scholar]
- 8.Zhou W., Schaack J., Zawada W.M., Freed C.R. Overexpression of human alpha-synuclein causes dopamine neuron death in primary human mesencephalic culture. Brain Res. 2002;926:42–50. doi: 10.1016/s0006-8993(01)03292-9. [DOI] [PubMed] [Google Scholar]
- 9.Ahn B.H., Rhim H., Kim S.Y., Sung Y.M., Lee M.Y., Choi J.Y., Wolozin B., Chang J.S., Lee Y.H., Kwon T.K., et al. Alpha-synuclein interacts with phospholipase D isozymes and inhibits pervanadate-induced phospholipase D activation in human embryonic kidney-293 cells. J. Biol. Chem. 2002;277:12334–12342. doi: 10.1074/jbc.M110414200. [DOI] [PubMed] [Google Scholar]
- 10.Ostrerova N., Petrucelli L., Farrer M., Mehta N., Choi P., Hardy J., Wolozin B. Alpha-synuclein shares physical and functional homology with 14–3-3 proteins. J. Neurosci. 1999;19:5782–5791. doi: 10.1523/JNEUROSCI.19-14-05782.1999. [DOI] [PMC free article] [PubMed] [Google Scholar]
- 11.Peng X.M., Tehranian R., Dietrich P., Stefanis L., Perez R.J. Alpha-synuclein activation of protein phosphatase 2A reduces tyrosine hydroxylase phosphorylation in dopaminergic cells. J. Cell Sci. 2005;118:3523–3530. doi: 10.1242/jcs.02481. [DOI] [PubMed] [Google Scholar]
- 12.Nielsen M.S., Vorum H., Lindersson E., Henning Jensen P. Ca2+ binding to α-synuclein regulates ligand binding and oligomerization. J. Biol. Chem. 2001;276:22680–22684. doi: 10.1074/jbc.M101181200. [DOI] [PubMed] [Google Scholar]
- 13.Klee C.B., Crouch T.H., Krinks M.H. Calcineurin: a calcium- and calmodulin-binding protein of the nervous system. Proc. Natl. Acad. Sci. USA. 1979;76:6270–6273. doi: 10.1073/pnas.76.12.6270. [DOI] [PMC free article] [PubMed] [Google Scholar]
- 14.Crabtree G.R., Olson E.N. NFAT signaling: choreographing the social lives of cells. Cell. 2002;109:S67–S79. doi: 10.1016/s0092-8674(02)00699-2. [DOI] [PubMed] [Google Scholar]
- 15.Macian F. NFAT proteins: key regulators of T-cell development and function. Nat. Rev. Immunol. 9999;5:472–484. doi: 10.1038/nri1632. [DOI] [PubMed] [Google Scholar]
- 16.Graef I.A., Wang F., Charron F., Chen L., Neilson J., Tessier-Lavigne M., Crabtree G.R. Neurotrophins and netrins require calcineurin/NFAT signaling to stimulate outgrowth of embryonic axons. Cell. 2003;113: 657–670. doi: 10.1016/s0092-8674(03)00390-8. [DOI] [PubMed] [Google Scholar]
- 17.Nguyen T., Giovanni S.Di. NFAT signaling in neural development and axon growth. Int. J. Dev. Neurosci. 2008;26:141–145. doi: 10.1016/j.ijdevneu.2007.10.004. [DOI] [PMC free article] [PubMed] [Google Scholar]
- 18.Lin X., Parisiadou L., Yu J., Liu G., Sun L., Sgobio C., Shim H., Gu X.L., Luo J., Long C.X., et al. Heterologous expression of Parkinson's disease-related mutant alpha-synuclein causes the dysfunction of Nurr1 and degeneration of midbrain dopaminergic neurons in transgenic mice. J. Neurosci. 2012;32:9248–9264. doi: 10.1523/JNEUROSCI.1731-12.2012. [DOI] [PMC free article] [PubMed] [Google Scholar]
- 19.Pallen C.J., Wang J.H. Calmodulin-stimulated dephosphorylation of p-nitrophenyl phosphate and free phosphotyrosine by calcineurin. J. Biol. Chem. 1983;258:8550–8553. [PubMed] [Google Scholar]
- 20.Blumenthal D., Takio K., Hansen R.S., Krebs E.G. Dephosphorylation of cAMP-dependent protein kinase regulatory subunit (Type II) by calmodulin-dependent protein phosphatase. J. Biol. Chem. 1986;262:8140–8145. [PubMed] [Google Scholar]
- 21.Rusnak F., Mertz P. Calcineurin: form and function. Physiol. Rev. 2000;80:1483–1521. doi: 10.1152/physrev.2000.80.4.1483. [DOI] [PubMed] [Google Scholar]
- 22.Li G.D., Zhang X., Li R., Wang X.D., Wang Y.L., Han K.J., Qian X.P., Yang C.G., Liu P., Wei Q., et al. CHP2 activates the calcineurin/nuclear factor of activated T cells signaling pathway and enhances the oncogenic potential of HEK293 cells. J. Biol. Chem. 2008;283:32660–32668. doi: 10.1074/jbc.M806684200. [DOI] [PubMed] [Google Scholar]
- 23.Liu C., Hermann T.E. Characterization of ionomycin as a calcium ionophore. J. Biol. Chem. 1978;253:5892–5894. [PubMed] [Google Scholar]
- 24.Matsuoka Y., Vila M., Lincoln S., McCormack A., Picciano M., LaFrancois J., Yu X., Dickson D., Langston W.J., McGowan E., et al. Lack of nigral pathology in transgenic mice expressing human alpha-synuclein driven by the tyrosine hydroxylase promoter. Neurobiol. Dis. 2001;8:535–539. doi: 10.1006/nbdi.2001.0392. [DOI] [PubMed] [Google Scholar]
- 25.Zhou W., Hurlbert M.S., Schaack J., Prasad K.N., Freed C.R. Overexpression of human alpha-synuclein causes dopamine neuron death in rat primary culture and immortalized mesencephalon-derived cells. Brain Res. 2000;866:33–43. doi: 10.1016/s0006-8993(00)02215-0. [DOI] [PubMed] [Google Scholar]
- 26.Danzer K.M., Haasen D., Karow A.R., Moussaud S., Habeck M., Giese A., Kretzschmar H., Hengerer B., Kostka M. Different species of α-synuclein oligomers induce calcium influx and seeding. J. Neurosci. 2007;27:9220–9232. doi: 10.1523/JNEUROSCI.2617-07.2007. [DOI] [PMC free article] [PubMed] [Google Scholar]
- 27.Martin Z.S., Neugebauer V., Dineley K.T., Kayed R., Zhang W., Reese L.C., Taglialatela G. Alpha-synuclein oligomers oppose long-term potentiation and impair memory through a calcineurin-dependent mechanism: relevance to human synucleopathic diseases. J. Neurochem. 2012;120:440–452. doi: 10.1111/j.1471-4159.2011.07576.x. [DOI] [PMC free article] [PubMed] [Google Scholar]
- 28.Hettiarachchi N.T., Parker A., Dallas M.L., Pennington K., Hung C.C., Pearson H.A., Boyle J.P., Robinson P., Peers C. α-Synuclein modulation of Ca2+ signaling in human neuroblastoma (SH-SY5Y) cells. J. Neurochem. 2009;111:1192–1201. doi: 10.1111/j.1471-4159.2009.06411.x. [DOI] [PubMed] [Google Scholar]
- 29.Surmeier D.J., Guzman J.N., Sanchez-Padilla J. Calcium, cellular aging, and selective vulnerability in Parkinson's disease. Cell Calcium. 2010;47:175–182. doi: 10.1016/j.ceca.2009.12.003. [DOI] [PMC free article] [PubMed] [Google Scholar]
- 30.Mattson M.P. Calcium and neurodegeneration. Aging Cell. 2007;6: 337–350. doi: 10.1111/j.1474-9726.2007.00275.x. [DOI] [PubMed] [Google Scholar]
- 31.Loh C., Shaw K.T., Carew J., Viola J., Luo C., Perrino B.A., Rao A. Calcineurin binds the transcription factor NFAT1 and reversibly regulates its activity. J. Biol. Chem. 1996;271:10884–10891. doi: 10.1074/jbc.271.18.10884. [DOI] [PubMed] [Google Scholar]
- 32.Rao A. Signaling to gene expression: calcium, calcineurin and NFAT. Nat. Immunol. 2009;10:3–5. doi: 10.1038/ni0109-3. [DOI] [PubMed] [Google Scholar]
- 33.Yoshida T., Mishina M. Distinct roles of calcineurin-nuclear factor of activated T-cells and protein kinase A-cAMP response element-binding protein signaling in presynaptic differentiation. J. Neurosci. 2005;25:3067–3079. doi: 10.1523/JNEUROSCI.3738-04.2005. [DOI] [PMC free article] [PubMed] [Google Scholar]
- 34.Schwartz N., Schohl A., Ruthazer E.S. Neural activity regulates synaptic properties and dendritic structure in vivo through calcineurin/NFAT signaling. Neuron. 2009;62:655–669. doi: 10.1016/j.neuron.2009.05.007. [DOI] [PubMed] [Google Scholar]
- 35.Ulrich J.D., Kim M-S., Houlihan P.R., Shutov L.P., Mohapatra D.P., Strack S., Usachev Y.M. Distinct activation properties of the nuclear factor of activated T-cells (NFAT) isoforms NFATc3 and NFATc4 in neurons. J. Biol. Chem. 2012;287:37594–37609. doi: 10.1074/jbc.M112.365197. [DOI] [PMC free article] [PubMed] [Google Scholar]
- 36.Luoma J.I., Zirpel L. Deafferentation-induced activation of NFAT (nuclear factor of activated T-cells) in cochlear nucleus neurons during a developmental critical period: a role for NFATc4-dependent apoptosis in the CNS. J. Neurosci. 2008;28:3159–3169. doi: 10.1523/JNEUROSCI.5227-07.2008. [DOI] [PMC free article] [PubMed] [Google Scholar]
- 37.Jayanthi S., Deng X.L., Ladenheim B., McCoy M.T., Cluster A., Cai N.S., Cadet J.L. Calcineurin/NFAT-induced up-regulation of the Fas ligand/Fas death pathway is involved in methamphetamine-induced neuronal apoptosis. Proc. Natl. Acad. Sci. USA. 2005;102:868–873. doi: 10.1073/pnas.0404990102. [DOI] [PMC free article] [PubMed] [Google Scholar]
- 38.Liu J., Farmer, J.D., Jr., Lane W.S., Friedman J., Weissman I., Schreiber S.L. Calcineurin is a common target of cyclophilin-cyclosporin A and FKBP-FK506 complexes. Cell. 1991;66:807–815. doi: 10.1016/0092-8674(91)90124-h. [DOI] [PubMed] [Google Scholar]
- 39.Fournier N., Ducet G., Crevat A. Action of cyclosporine on mitochondrial calcium fluxes. J. Bioenerg. Biomembr. 1987;19:297–303. doi: 10.1007/BF00762419. [DOI] [PubMed] [Google Scholar]
- 40.Wang H., Yao S., Lin W., Du Y., Xiang B., He S., Huang C., Wei Q. Different roles of Loop 7 in inhibition of calcineurin. Biochem. Biophys. Res. Commun. 2007;362:925–929. doi: 10.1016/j.bbrc.2007.07.195. [DOI] [PubMed] [Google Scholar]