

Abstract

The tumor-associated glycoprotein-72 (TAG-72) antigen is highly overexpressed in various human adenocarcinomas and anti-TAG-72 monoclonal antibodies, and fragments are therefore useful as pharmaceutical targeting vectors. In this study, we investigated the effects of site-specific PEGylation with MW 2–4 kDa discrete, branched PEGylation reagents on mCC49 Fab′ (MW 50 kDa) via in vitro TAG72 binding, and in vivo blood clearance kinetics, biodistribution, and mouse tumor microPET/CT imaging. mCC49Fab′ (Fab′-NEM) was conjugated at a hinge region cysteine with maleimide-dPEG12-(dPEG24COOH)3 acid (Mal-dPEG-A), maleimide-dPEG12-(dPEG12COOH)3 acid (Mal-dPEG-B), or maleimide-dPEG12-(m-dPEG24)3 (Mal-dPEG-C), and then radiolabeled with iodine-124 (124I) in vitro radioligand binding assays and in vivo studies used TAG-72 expressing LS174T human colon carcinoma cells and xenograft mouse tumors. Conjugation of mCC49Fab′ with Mal-dPEG-A (Fab′-A) reduced the binding affinity of the non PEGylated Fab′ by 30%; however, in vivo, Fab′-A significantly lengthened the blood retention vs Fab′-NEM (47.5 vs 28.1%/ID at 1 h, 25.1 vs 8.4%/ID at 5 h, p < 0.01), showed excellent tumor to background, better microPET/CT images due to higher tumor accumulation, and increased tumor concentration in excised tissues at 72 h by 130% (5.09 ± 0.83 vs 3.83 ± 1.50%ID/g, p < 0.05). Despite the strong similarity of the three PEGylation reagents, PEGylation with Mal-dPEG-B or -C reduced the in vitro binding affinity of Fab′-NEM by 70%, blood retention, microPET/CT imaging tumor signal intensity, and residual 72 h tumor concentration by 49% (3.83 ± 1.50 vs 1.97 ± 0.29%ID/g, p < 0.05) and 63% (3.83 ± 1.50 vs 1.42 ± 0.35%ID/g, p < 0.05), respectively. We conclude that remarkably subtle changes in the structure of the PEGylation reagent can create significantly altered biologic behavior. Further study is warranted of conjugates of the triple branched, negatively charged Mal-dPEG-A.
INTRODUCTION
The tumor-associated glycoprotein-72 (TAG-72) antigen is a mucin-like glycoprotein that is highly overexpressed by human adenocarcinomas of colon, stomach, esophagus, pancreas, ovary, endometrium, lung, prostate, and breast.1–6 Conversely, the TAG-72 antigen is generally minimally found within or absent from normal human tissues.7 In human adenocarcinomas, TAG-72 is predominantly found within extracellular mucin pools, and is to a lesser extent distributed on cell surfaces of adenocarcinoma cells.5 This distribution pattern of the TAG-72 antigen makes it more easily accessible to its specific targeting agent than target antigens predominantly located within cells or only on cell surfaces.
Murine CC49 (mCC49) is a second generation of IgG monoclonal antibody (mAb) that is specifically targeted against the TAG-72 antigen.2,8,9 It exhibits a higher affinity for the TAG-72 antigen in human adenocarcinomas as compared to the first generation B72.3 mAb variant, with mCC49 recognizing a different epitope on the TAG-72 antigen and demonstrating less reactivity with normal human tissues.4 mCC49 has long been used in animal studies to assess the potential clinical efficacy of anti-TAG-72 MAbs. It has also been extensively evaluated in human clinical trials related to radioimmunoguided surgery, molecular imaging, and therapeutics applications.4,5,10–23
Various mAb fragments derived from mCC49 lack the constant (Fc) region but maintain some form of the TAG-72 antigen binding region (Fab), and are well characterized.24–29 These mCC49 fragments are relatively easy to produce as engineered constructs or from enzymatic cleavage of the intact mCC49 mAb, and can take various forms, including Fab′, F(ab′)2, and single-chain Fv (scFv). These mCC49 mAb fragments have previously been shown, primarily as a result of their reduced physical size, to have much more rapid plasma and whole body clearance, reducing normal tissue background more quickly, combined with the potential for increased tumor uptake rate, qualities that have long been thought to have the potential for improving efficacy in humans. However, the much more rapid blood clearance tends to reduce overall exposure of the ligand to the tumor (input function), and the fragments also tend to have lower avidity for the TAG-72 antigen, qualities that reduce optimal tumor uptake and retention.30–35 As a result, the use of such minute mAb fragments will tend ultimately to lead to an overall reduction in tumor targeting, and thus impact negatively upon their potential clinical relevancy for molecular imaging, antigen-directed cancer surgery, and other therapeutics applications in humans. To address this problem, interest has focused on engineering and fine-tuning antibody fragments to achieve improved delivery to the tumor site and to increase tumor accumulation and retention while maintaining high normal tissue background clearance.
One optimization approach is the attachment of polyethylene glycol (PEG) chains.36–39 It is of historical interest that the initial realization of the potential impact of this technology on mAb fragments has its origins in studies conducted in the 1990s evaluating the effects of PEGylation on mAb fragments directed against human colorectal cancer lines in the xenograft mouse model.40–42 PEG is a nonionic, hydrophilic compound that is made up of repeating ethylene oxide units flanked by alcohol groups that can be conjugated to various proteins, peptides, and other biological agents,40,41,43–52 which often results in increased water solubility, increased chemical stability, decreased proteolytic enzyme metabolism, decreased immunogenicity, and increased circulatory half-life of such agents. Tolerance of PEG and PEG-protein conjugates is high.53,54
Traditionally, the conventional manufacturing of PEG products involves a polymerization process that results in a polydispersed mixture of PEG molecules of varying sizes and molecular weights (MW) up to 100 kDa.40,41,43–51 In an effort to overcome the inadequacies of polydispersed mixtures of PEG molecules, various modes of chromatography have been employed to attempt to produce monodispersed PEG products with narrower chain lengths and molecular weight distributions. However, these so-called monodispersed PEG products, even when optimized to an alleged “high purity,” still contain an amalgamation of various individual species of PEG molecules.
In contrast to chromatographically separated PEG products, pure single PEG molecules (discrete PEG, dPEG) can be prepared by stepwise, organic chemistry that does not involve polymerization or chromatographic separation, so that each dPEG species is a pure single compound with a specific structure and MW.52 The production process results in linear molecules of 4 to 48 ethylene oxide units (i.e., from 200 to 2000 Da), and branched molecules of 3 to 9 linear chain branches (i.e., up to 8000 Da). These pure single compounds can contain single points of attachment for proteins, peptide, or antibodies and can contain various functional groups that can play a role in controlling physical and biological properties of the resultant conjugates. Branched constructs can be created to impart a larger real or apparent hydrodynamic volume while adding a smaller mass to the resultant conjugate than can be accomplished by the use of larger polydispersed PEGs.
Early on, PEGylation, using such chromatographically generated PEG compounds, was evaluated with several mAb fragments directed against human colorectal cancer cell lines in xenograft mice.40–42 In 1990, Kitamura et al evaluated the F(ab′)2 of murine mAb, A7 (mA7), conjugated with an estimated 4 PEG polymers with a MW totaling ~20 kDa.42 The PEGylated 125I-labeled F(ab′)2 of mA7 demonstrated a higher tumor-to-blood ratio and lesser uptake by normal tissues than the whole mA7. In 1994, Pedley et al. evaluated the Fab′ and F(ab′)2 mAb fragments of the murine mAb, A5B7, conjugated to varying numbers of PEG polymers.41 The PEGylated 125I-labeled Fab′ and F(ab′)2 of A5B7 demonstrated significantly prolonged plasma half-life and increased accumulation in the tumor and to a lesser extent in normal tissues, but reduced tissue-to-blood ratios compared to non-PEGylated Fab′ and F(ab′)2, resembling that of the whole A5B7. Higher levels of PEGylation gave a greater extension of plasma half-life, but suffered incremental loss in antigen-binding activity and decreased tumor localization. In 1999, Lee et al. evaluated a scFv mAb fragment, mCC49/218 scFv, conjugated with 6 varying length PEG polymers with MWs ranging from 2 to 20 kDa, and PEG:scFv ratios of 1:1 to 1:5.40 These conjugates, via ELISA methodology, demonstrated prolonged plasma half-life as compared to their nonPEGylated parent. The authors concluded that increasing PEG polymer length was more effective for plasma half-life extension than increasing total PEG mass. Li et al. further advanced the art, adding two discrete linear dPEG-DOTA units conjugated to random lysines on a CC49 diabody, finding longer blood retention and better tumor to background than unpegylated or polydisperse pegylated products.55
The primary goal of our current study was to quantitatively evaluate the effect of branched dPEG technology on the blood concentration, renal clearance, tumor accumulation, and background tissue retention. We chose to modify a mCC49 Fab′ fragment targeted against the TAG-72 antigen in LS174T human colorectal cancer cells and xenograft mouse model using these cells. The isotope, 124I (half-life 4.18 d), was chosen in part to discern the best imaging times, which requires data on both sides of an optimal, and therefore longer lived, isotope. We also felt iodination at a tyrosine was the most subtle variable among radiolabeling choices to explore the effects of branched dPEGylation without altering the dPEG termini. To achieve slower renal clearance of 124I-mCC49 Fab without adding significant molecular size, we conjugated it at an exposed hinge region cysteine with one of three triple branched PEGylation agents: Mal-dPEG-A, Mal-dPEG-B, or Mal-dPEG-C, (Figure 1), with masses, 4473.17 Da, 2887.28 Da, and 4299.06 Da, respectively.
Figure 1.
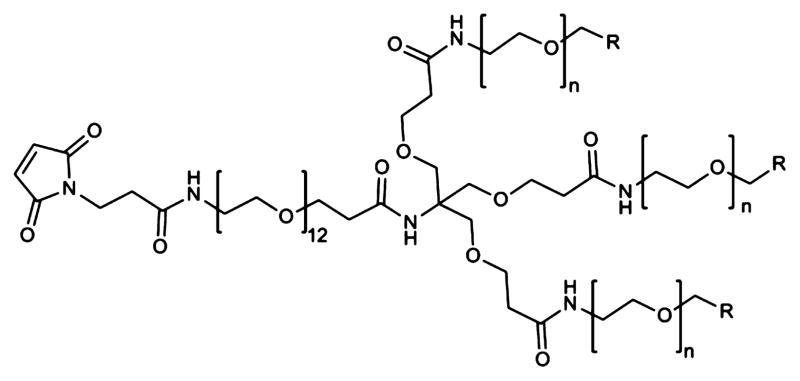
Structure of the PEGylation reagents conjugated via the maleimide to the hinge region cysteine mCC49 Fab′. Mal-dPEG-A, n = 24, R = CH2CH2–COOH, MW = 4473.17 Da; Mal-dPEG-B, n = 12, R = CH2–CH2–COOH, MW = 2887.28 Da. Mal-dPEG-C: n = 24, R = H, MW = 4299.06 Da.
MATERIALS AND METHODS
Additional data and discussion of the preparations is given in the Supporting Information.
Materials
Ficin, sodium tetrathionate, N-ethylmaleimide, and cysteine were obtained from Sigma. Murine mCC49 was a gift of Dr. David Colcher (Beckman Research Institute of City of Hope). PD10-Sepharose resin and the Superdex 200 column were obtained from GE Healthcare. Concentrations were performed on centrifugal concentrators with a 10,000 MW cut off (Millipore). Dithiothreitol was obtained from Fluka. Mercaptoethylamine (cysteamine) was obtained from TCI America. Mal-dPEG-A, Mal-dPEG-B, and Mal-dPEG-C were provided by Quanta BioDesign, Ltd., Powell, OH (full compound names in Figure 1, catalog numbers 11451, 11421, and 1471). The horseradish peroxidase (HRP) labeled mouse Fc binding antibody used in the ELISA was purchased from Jackson Laboratories.
Preparation of Fab′-A, Fab′-B, and Fab′-C (Scheme 1, Figure 1)
Scheme 1.

mCC49 IgG Fragmentation to F(Ab′)2
The method used to prepare the mouse Fab′ fragment with a single reactive cysteine thiol was adapted from the work of Schott et al.25 Ficin (0.1 mL of a 19.2 mg/mL slurry) was desalted on a PD10 column equilibrated in 0.01 M Tris Buffer, pH 8.5. The isolated protein was passed over a 0.5 mL Q-Sepharose column (GE Healthcare) equilibrated in the same buffer. Purified ficin was isolated in the column flow through eluate. CC49 (1.5 mL of a 2 mg/mL solution in PBS) was combined with an equal volume of a 0.2 M Hepes Buffer containing 2 mM EDTA (pH 7). Purified ficin (0.1 mg) and freshly prepared cysteine (0.03 mL of a 1.33 mM solution in DI water) were then added and the reaction was allowed to proceed overnight at 37 °C. The reaction product was concentrated to 0.5 mL and desalted on a PD10 column equilibrated in a 0.01 M Tris Buffer, pH 8.5. The isolated protein was then applied to a 1 mL Q-Sepharose column that was equilibrated in the same buffer. The column was washed with the equilibration buffer and the product F(ab′)2 was eluted with the same buffer containing 0.1 M sodium chloride. The product-containing fractions were adjusted to pH 7.4 by the addition of a 1 M solution of monopotassium phosphate.
Reduction of F(ab)2 to Fab′
A solution of 1 mg mCC49 F(ab)2 in 0.5 mL of a pH 7.4 phosphate buffer was made 4 mM in dithiothreitol by the addition of 0.02 mL of a freshly prepared solution of 0.1 M DTT in DI water. The reaction mixture was incubated at RT for 45 min and then desalted on a PD10 column equilibrated in a 0.1 M sodium phosphate buffer, pH 6.5, containing 1 mM EDTA. The product (1.5 mL) was collected in the column’s exclusion volume.
Reoxidation and Deprotection of Cysteines
The reduced product in 1.5 mL was combined with 0.167 mL of a freshly prepared solution of 3 mg/mL sodium tetrathionate in DI water and the reaction was incubated at RT for 15 min. The solution was then applied to three PD10 columns (0.5 mL/column) equilibrated in 0.1 M sodium phosphate buffer, pH 6.5, 1 mM EDTA and the excluded protein containing fractions (4.5 mL) were combined, concentrated to 0.5 mL, and reacted with 0.056 mL of a freshly prepared 11 mM mercaptoethyl-amine solution in DI water (final MEA conc. = 1.1 mM). The reaction was incubated for 4 h at RT and then desalted on a PD10 column equilibrated in 0.1 M sodium phosphate buffer, pH 6.5, 1 mM EDTA.
Conjugation and Purification of Fab′-A, Fab′-B, Fab′-C, and Fab′-NEM
The desalted product (1.5 mL) was combined with 0.167 mL of a 10 mM solution of either Mal-dPEG-A, Mal-dPEG-B, Mal-dPEG-C, or NEM (diethylmaleimide) in dimethylacetamide. The desalted product (1.5 mL) was combined with 0.167 mL of a 10 mM solution of either Mal-dPEG-A, Mal-dPEG-B, or Mal-dPEG-C in dimethylacetamide. The reactions were allowed to proceed for 4 h at RT and then quenched by the addition of 100 mM N-ethylmaleimide (0.075 mL) in dimethylacetamide. The conjugates were purified by Size Exclusion Chromatography on a Superdex 200 column (Hi Load 16/600) equilibrated in a 0.05 M sodium phosphate buffer (pH 7.2) containing 0.15 M sodium chloride at a flow rate of 0.5 mL/minutes. The fractions were analyzed by their absorbance at 280 nm and aliquots of the product fractions were concentrated and analyzed by SDS-PAGE. Fractions that contained purified product were combined and concentrated to ~0.5 mL via a centrifugal concentrator. The protein purities of the conjugate products were determined by SDS-PAGE and the molecular weights were determined by MALDI. The protein concentrations of the final products were determined by their absorption at 280 nm using an extinction coefficient of 1.49 for the absorbance of a 0.1% protein solution. The extinction coefficient was calculated from the protein sequence using an Online Calculator (http://web.expasy.org/protparam/).
Determination of Relative Binding Constants
The competition assay used to determine relative affinities was adapted from work of Pavlinkova et al.24 The relative affinities of the Fab′-A, -B, and -C conjugates for the TAG-72 antigen were determined by competitive ELISA analysis. Microtiter plates (Nunc MaxiSorp) were coated with bovine sub maxillary mucin (0.33 μg/mL in 0.05 M sodium bicarbonate/carbonate buffer, pH 9.6) and then incubated with solutions containing a fixed concentration of full length mCC49 (0.033 μg/mL) and variable concentrations of the Fab′ conjugates. The amount of full length mCC49 that bound to the plate was determined with an HRP conjugated secondary antibody against the full length mouse antibody’s Fc region. The concentrations of the conjugates that inhibited the binding of the full length mCC49 by 50% were compared to determine their relative antigen affinities.
Radiolabeling of Modified Proteins and Protein Fragments
Radiolabeling, with 124I tracer, of modified proteins or protein fragments was accomplished using a standard Iodogen method.56,57 In a typical radiolabeling experiment, 0.5 to 1 mg of protein was transferred into an Iodogen tube (Pierce, Rockford, IL) containing 100 μL phosphate buffer (0.1 M, pH 7.4) followed by addition of known amounts of 124INa (IBA Molecular, Dulles, VA) in 0.02 M NaOH. An additional 50 μL of phosphate buffer (0.1 M, pH 7.4) was then added to the mixture, it was covered with parafilm, and the mixture was incubated at room temperature for 30 to 45 min with occasional swirling. The 124I labeled protein was loaded onto a Sephadex G-25 (PD-10) size-exclusion column and eluted with Phosphate Buffered Saline (PBS) to separate labeled protein from free 124I. Several fractions, containing approximately 10 drops, were collected and the fractions containing the highest radioactivity were collected and pooled in a preweighed plastic vial. The amount of radioactivity was determined using a dose calibrator. The percent yield of radiolabeling was calculated by dividing the total radioactivity of the pooled samples by the amount of radioactivity added to the Iodogen tube. Purity of the samples was determined by Thin Layer Chromatography (TLC) strips (Whatman) eluted with 85% MeOH:15% Water mixture. The bound protein stayed at the bottom and unbound iodide moved to the solvent front. Radioanalytical data are in Table 1.
Table 1.
Analytical Data on the PEGylated Conjugates and Their Radiolabeled Products
| Conjugate | Protein Conjugation
|
Radiolabeling
|
|||||
|---|---|---|---|---|---|---|---|
| MALDIa MW (Da) | Calculated MWb (Da) | Relative Affinityc | Yield % | RCP d | Radio Conc.mCi/mL | Sp. Ac. mCi/mg-protein | |
| Fab′-A | 52,620 | 52,691 | 0.7 | 79.3 | 98.3 | 1.08 | 6.52 |
| Fab′-B | 51,031 | 51,100 | 0.3 | 24.8 | 82.4 | 0.80 | 9.45 |
| Fab′-C | 52,448 | 52,517 | 0.3 | 17.7 | e | 0.54 | 6.56 |
| Fab′-NEM | 48,343 | b | 1.0 | 22.0 | 98.1 | 0.34 | 6.75 |
All peaks are broad, probably due to a distribution in the number of sodium counterions, unaffected by desalting. Theoretical molecular weights calculated from the experimental MW of the Fab′-NEM plus molecular weights of Mal-dPEGreagents.
Ficin cleavage site is unknown so Fab′-NEM theoretical MW is unknown.
Determined by the CC49 competition ELISA, numbers relative to Fab′-NEM.
Radiochemical purity.
Undetermined due to TLC streaking.
Animal Tumor Model
Animal studies were conducted in compliance with animal protocols approved at The Ohio State University Laboratory Animal Resource. Human colon adenocarcinoma cell line LS174T was obtained from American Type Culture Collection (Manassas, VA) and maintained in McCOY’s 5A (Invitrogen, Carlsbad, CA) supplemented with 10% FBS (Invitrogen) and 1% penicillin and streptomycin (Invitrogen) at 37 °C with 5% CO2. LS174T cell line was passaged twice a week after being washed in PBS and trypsinization. For each reagent, seven 4–6 week-old female athymic nu/nu mice (Charles River Laboratories, MA) were subcutaneously injected with 6 × 10⁶ LS174T cells in 100 μL of PBS on the right and left flanks. Tumors were allowed to grow for 10 days and five mice with proper sizes on both flanks were recruited in the following studies. Potassium iodine (UPSHER-SMITH, MN) was in drinking water at 290 mg/L 24 h prior to injection to block thyroid.
Imaging with microPET/CT
124I-Fab-NEM′, Fab′-A, Fab′-B, and Fab′-C were injected at 45, 60, 75, and 64 μCi, respectively, per mouse via tail in 50–150 μL of PBS. N = 4, 6, 4, and 4 mice were imaged, respectively. Micro-PET/CT (Inveon, Siemens Preclinical, Knoxville, TN) imaging of mice was carried out at 5, 24, and 72 h postinjection (p.i). Animals were anesthetized using isoflurane inhalation with 5% of dial vaporizer for induction and 1.5–2% for maintenance. The process of microPET scanning lasted for nine minutes, and the CT scan lasted five minutes. The microPET/CT images were reconstructed with the OSEM2D algorithm to try to lower possible artifact due to bladder contents. Initial image analysis, including intensity (MBq/mL), volume of tumors and muscle of the front arms were evaluated using Siemens’ proprietary Inveon Research Workplace (IRW). Intensity per milliliter was generated and normalized for injected dose (MBq). Images in the figures were generated by presenting the top 12 through 50% of the histogrammed data to present an appropriate dynamic range. This gave the best range across all samples to show clearance and background in the surrounding tissues. In the 5 h images there was increased distortion due to a poor signal-to-noise (SNR) and we used 30–50% window to better visualize the scan. Large amounts of uptake in the stomach and bladder contents contributed to this problem. This however, did not often interfere with the region of interest (ROI) evaluations of the tumors. In all instances, the CT scan was used to assist in the determination of the tumor volume. The fasciae and subcutaneous fat gave enough tissue contrast to separate the xenograft in the CT volumes. The counts in the right or the left forearm, with the bone volume subtracted, were used for a background tissue metric. There was concern over partial volume effects in measuring the heart. The assumption was that the CT file would be generating an average volume across five minutes of heart beating and respiration. The volume derived would not be exact, but would give a very good approximation of the status of the in vivo blood pool. These data were compared with the actual blood curves generated by radioactivity counting of extracted blood samples (vide infra). Standardized Uptake Values (SUV) were calculated using a formula,58 SUV = Measure radioactivity in ROI in MBq/mL divided by ID/g in MBq/g-Body weight. Tumor to background ratio (T/B) values were calculated as SUV-Tumor/SUV-Arm. The 5 and 24 h data were used, averaging SUV-Tumors and SUV-Arms to obtain a T/B in each mouse, then calculating the mean of the 4 or 5 animals’ T/B at each time.
Biodistribution and Pharmacokinetics
Mice were sacrificed at 72 h after completion of the microPET/CT scanning. Organs and tissues were dissected, including heart, lungs, spleen, liver, kidneys, pancreas, gastrointestinal tract (GI), muscle, skin, blood, tail, and carcass. Organs and tissues were then weighed, and radioactivity was counted using a Wiz II gamma-counter (Perkin-Elmer Wizard II, Model 2480, Waltham, MA). The percentage of injected dose per gram (% ID/g) for each tissue and tumor-to-nontumor tissue ratios were calculated based on our published methods.59,60
For evaluating blood clearance, at 1, 5, 24, 48, and 72 h p.i., mice were anesthetized with isoflurane as mentioned above, and leg skin was sterilized with a 70% ethanol pad. The saphenous vein was punctured using a 25G syringe needle and 5–10 μL of blood was collected using a capillary tube. The radioactivity of the blood samples was counted using the Wiz II gamma-counter and %ID/g was calculated using the same methods mentioned above. A blood factor of 78 mL/kg was used to calculate % ID for each mouse based on the individual weight of the mouse.60 Mean %ID was determined for each dose group at each time point, and area under the mean %ID versus time curve was calculated between 1 and 72 h (AUC1–72h) using the trapezoid rule and expressed as %ID*h. Blood clearance was calculated as dose/AUC and expressed as mL/h/kg.
Statistics
All data are presented as mean ± SD. The data from the in vivo studies (biodistribution, pharmacokinetics, tumor intensity in microPET/CT imaging, and tumor-to-nontumor ratios) were statistically analyzed with a Student t test (Microsoft Excel software). A correlation between radioactivity of blood samples (%ID) and tumor intensity (Bq/mL) of microPET/CT imaging was plotted using an SPSS software (IBS Corporation, NY). A p value of 0.05 was considered to be statistically significant.
RESULTS
Branched dPEGylated Fab′ Conjugates
The structures of the three branched Mal-dPEG molecules are shown in Figure 1 as maleimide derivatives. They differ in the length of the three branched chains, 12 and 24 CH2CH2O units, and in the end-capping moiety. The end-capping group is a carboxylate group in Fab′-A and Fab′-B, and a methoxy group in Fab′-C. The pKa values of the carboxylates are ~4.7 indicating that they will be fully deprotonated at physiologic pH. Fab′-A and Fab′-B will therefore have a net −3 charge, −1 charge from each of the three linear dPEG chains in the branched grouping, while Fab′-C and the parent Fab′-NEM will have no such charge. The MW of the Fab′ is ~50 kDa and therefore the PEGylation agents represent ≤8% of the total mass of the PEGylated Fab′ conjugates.
Supporting Information contains a more detailed description and discussion of the conjugate syntheses and analytical results (Figures S1 and S2). The overall yields for the conversion of F(ab′)2 to the different Fab′-A, -B, and -C conjugates and subsequent purifications as per Scheme 1 were ~25%. Purity of the conjugates was assessed by SDS-PAGE (Figures S1 and S2) and identity was confirmed by Maldi Mass spectral parent ion peaks (Table 1).
In Vitro Assays
The PEGylated Fab′ conjugates were approximately 97% pure after SEC purification, as estimated by nonreducing SDS-PAGE. MALDI mass spectrometry analysis indicated that each purified product contained a single dPEG conjugated to the Fab′ fragment. Although the MALDI parent ion peaks were fairly broad, the differences in theoretical and observed molecular weights (71, 69, and 69 Da) are reasonably rationalized by 3 sodium ions (23 Da) that adhered strongly enough to avoid removal in the desalting step. In the case of Fab′-NEM, the control conjugate, the cysteine thiol was blocked with a N-ethylmaleimide group. Otherwise the conjugates are presumed to have reacted at the available cysteine. The competition assay showed that relative affinity (Table 1) of Fab′ conjugates was lower than Fab′-NEM depending on the structure of the conjugated dPEG. The affinities of Fab′-A, Fab′-B, and Fab′-C were, respectively, 70%, 30%, and 30% of that of the Fab′-NEM (see Table 1), making Fab′-A probably superior from the point of view of avidity.
Blood Clearance
To determine how the PEGylation affected in vivo blood clearance of the Fab′ conjugates, their pharmacokinetics were analyzed. Blood samples were collected after injection and the blood concentration time curves are presented as %ID vs time in Figure 2. PEGylation of Fab′ with Mal-dPEG-A significantly attenuated the blood clearance rate of Fab′-A within the first 24 h. The blood radioactivity for 124I-Fab′-A and 124I-Fab′-NEM were 47.5%/ID vs 28.1% ID/g at 1 h (P < 0.01), 25.1%/ID vs 8.4%ID/g at 5 h (P < 0.01), and 4.1%/ID vs 1.3%ID/g at 24 h (P < 0.05). However, conjugation of Fab′ with Mal-dPEG-B or -C did not increase, but decreased blood radioactivity to 12.4%/ID (P < 0.01) and 19.1%/ID (P < 0.05) at 1 h, and 6.1%/ID (P < 0.05) and 4.2%/ID (P < 0.01) at 5 h, respectively. The Fab′-A conjugate is significantly slower to be cleared from the blood than the NEM, B, and C molecules at the earliest time post injection, but elimination times after that are similar among the conjugates. AUC and clearance values (shown in Figure 2) reflect the significantly greater retention and slower clearance of Fab′-A in blood compared to Fab′-NEM (7.9 and 19.2 mL/h/kg, respectively). Fab′-B and -C are cleared from blood at similar rates (34.2 and 41.0 mL/h/kg).
Figure 2.
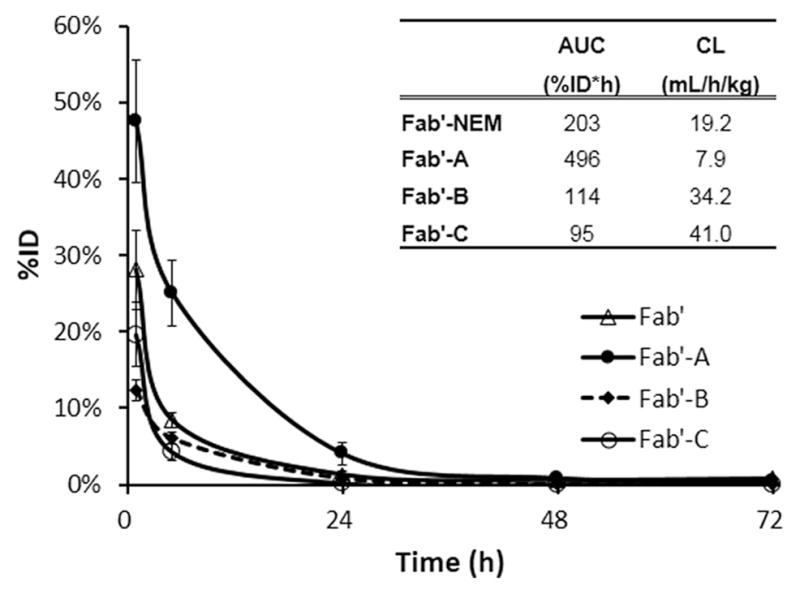
Time-radioactivity curves in mouse blood after administration of 124I-Fab′, 124I-Fab′-A, 124I-Fab′-B, and 124I-Fab′-C. Data were converted to %ID of whole blood pool calculated by assuming 78 mL/kg blood. Data are presented as mean ± SD N = 5. The inset table summarizes observed AUC1–72h and blood clearance (CL).
MicroPET/CT Imaging
MicroPET/CT scanning indicated a significant uptake of each tested molecule in LS174T human colon carcinoma xenografts in nude mice (Figure 3A). The main background tissues for all four conjugates were kidneys, stomach, and lung. Images illustrated in Figure 3A represent microPET/CT scanning at 24 h. Consistent with radioactivity values in the blood, 124I-Fab′-A demonstrated the strongest signals in the tumors at all the time points, as well as the highest absolute background (arm). 124I-Fab′-A produced the highest quality tumor images from 24 h through 72 h. T/B data at 5 and 24 h were 2.8 ± 1.6 and 22 ± 17, 4.1 ± 1.6 and 17 ± 7, 3.0 ± 0.6 and 14 ± 7, 3.2 ± 0.6 and 26 ± 10 for Fab′-NEM, Fab′-A, Fab′-B, and Fab′-C, respectively. The T/B ratio values (SUV-Tumor/SUV-Arm) were not significantly different among the tested compounds.
Figure 3.

microPET/CT images post injection of 124I-Fab′-NEM (45 μCi), 124I-Fab′-A (60 μCi), 124I-Fab′-B (75 μCi), and 124I-Fab′-C (64 μCi) in LS174T xenograft nude mice. Images are windowed identically, as described in Materials and Methods. (A) a representative mouse image from each group of N = 4 at 24 h; (B) a representative mouse from N = 4 injected with Fab′-A at 5, 24, 48, and 72 h.
Correlation of microPET/CT Image Intensity with Early Blood Concentration
The images were quantitatively analyzed to look for associations between the image intensity in tumor and other the quantifiable parameters. Radioactivity intensity of each tumor (SUV)58 is shown in Figure 4 right bars, right axis (and Tables S3 and S4), 124I-Fab′-A demonstrated the highest intensity in the tumors at all time points from 5 to 72 h, followed by 124I-Fab′-NEM, 124I-Fab′-B, and 124I-Fab′-C. Table S3 shows that all of the molecules demonstrated high intensity in tumors, but 124I-Fab′-A was significantly higher than that of 124I-Fab′-B, 124I-Fab′-NEM, and 124I-Fab′-C: at 24 h SUV were 0.39 ± 0.08 vs 0.16 ± 0.10, 0.15 ± 0.04, 0.12 ± 0.04, p < 0.01). This is also true at 72 h except that 124I-Fab′-NEM was not determined (0.17 ± 0.05 vs 0.05 ± 0.02, 0.06 ± 0.02, p < 0.01)). There was no significant differences among the 124I-Fab′-NEM, 124I-Fab′-B, and 124I-Fab′-C (p < 0.05) at any time point.
Figure 4.

Mouse blood radioactivity and LS174T tumor SUV from microPET/CT. Data from blood at 1 and 5 h show a similar pattern, and only 5 h blood is presented. Data are presented as Mean ± SD N = 5 except at 72 h n = 4 for B and N = 3 for C.
Figure 4 also contains (left bar, left axis) the blood radioactivity data at 5 h post administration. There is a strong similarity in the trend between tumor intensities on microPET images at 5, 24, and 72 h and blood radioactivity at 5 h. To determine significance of this trend, we compared the relationship of measured blood %ID values to the microPET tumor SUV values in each mouse using blood %ID at 1 and 5 h and microPET tumor SUV data at 5, 24, and 72 h. Figure 5 shows the results of the correlation analysis in the cases where positive correlations were found with P < 0.05. Positive statistical correlations were found between blood %ID at both 1 and 5 h and microPET tumor SUV at both 5 and 24 h.
Figure 5.

Correlation between blood radioactivity and tumor intensity in microPET/CT images. Blood radioactivity (%ID) of each individual mouse in all four groups was plotted against its normalized microPET tumor SUV. Upper panel, microPET/CT imaging at 5 h; bottom panel, microPET/CT imaging at 24 h.
Biodistribution Studies
Mouse organs and tissues were harvested at 72 h, after imaging. The concentration of radioactivity in each tissue is presented in Table 2 as %ID/g. 124I-Fab′-NEM was significantly accumulated in LS174T tumors (3.83 ± 1.50%ID/g) compared to the rest of tissues, such as muscle (p < 0.05) and blood (p < 0.05). Pegylation of Fab′-NEM with Mal-dPEG-A increased tumor retention of 124I-Fab′ (5.09 ± 0.83 vs 3.83 ± 1.50%ID/g, p > 0.05). A small increase in the uptake by muscle was also observed, in line with the relative blood concentrations. However, conjugation with Mal-dPEG-B and -C significantly (P < 0.05) decreased localization of the Fab′ in the tumors. Consistently, relatively lower concentrations in blood and muscle were also observed in the latter two agents. Since tumor-to-background ratio is critical to an imaging reagent, a comparison of between tumor and other organs/tissues was calculated (Table 2). 124I-Fab′-A generated the highest tumor-to-blood ratio (81 ± 9.7) and tumor-to-muscle ratio (154 ± 47), followed by 124I-Fab′-B (75 ± 70 and 50 ± 35, respectively), 124I-Fab′-NEM (46 ± 24 and 61 ± 12, respectively), and 124I-Fab′-C (2.3 ± 6.8 and 62 ± 7.2, respectively). Pegylation with Mal-dPEG-A improves the tumor to background ratio in the nude mouse model and the data are in line with the microPET/CT data.
Table 2.
Comparison of Biodistribution (%ID/g) of 124I-Fab′-NEM, 124I-Fab′-A, 124I-Fab′-B, and I-Fab′-C in Nude Mice with LS174T Xenograft Tumors at 72 h Post Administrationa
| Fab′-NEM N = 5 | Fab′-A N = 5 | Fab′-B N = 4 | Fab′-C N = 3 | |
|---|---|---|---|---|
| blood | 0.13 ± 0.15 | 0.10 ± 0.05 | 0.02 ± 0.00 | 0.07 ± 0.03 |
| tumor | 3.83 ± 1.50 | 5.09 ± 0.83 | 1.97 ± 0.29 | 1.42 ± 0.35 |
| muscle | 0.07 ± 0.04 | 0.14 ± 0.08 | 0.01 ± 0.00 | 0.02 ± 0.01 |
| lungs | 0.12 ± 0.05 | 0.13 ± 0.04 | 0.04 ± 0.00 | 0.06 ± 0.01 |
| heart | 0.08 ± 0.04 | 0.10 ± 0.04 | 0.01 ± 0.00 | 0.03 ± 0.01 |
| liver | 0.23 ± 0.18 | 0.75 ± 0.41 | 0.22 ± 0.07 | 0.18 ± 0.10 |
| spleen | 0.18 ± 0.09 | 0.25 ± 0.09 | 0.08 ± 0.03 | 0.12 ± 0.05 |
| pancreas | 0.08 ± 0.05 | 0.08 ± 0.05 | 0.01 ± 0.00 | 0.04 ± 0.02 |
| GI | 0.12 ± 0.10 | 0.10 ± 0.05 | 0.05 ± 0.02 | 0.12 ± 0.03 |
| Kidneys | 0.14 ± 0.06 | 0.37 ± 0.20 | 0.05 ± 0.01 | 0.07 ± 0.00 |
| skin | 0.15 ± 0.04 | 0.15 ± 0.07 | 0.08 ± 0.02 | 0.08 ± 0.01 |
| carcass | 0.09 ± 0.04 | 0.18 ± 0.16 | 0.03 ± 0.01 | 0.04 ± 0.00 |
| Tumor/blood | 46 ± 24 | 75 ± 70 | 81 ± 9.7 | 25 ± 6.8 |
| Tumor/muscle | 61 ± 29 | 50 ± 35 | 154 ± 47 | 62 ± 7.2 |
Values were presented as mean ± SD.
DISCUSSION
Blood Retention
To date, both polydispersed and monodispersed PEG have shown the ability to extend blood residence times of antibody fragments. In general, the larger the PEG mass relative to the antibody or fragment mass, the longer the blood clearance delay. Various linear dPEG constructs have been evaluated with several murine anti-TAG-72 diabody analogues (AVP04–07 and AVP04–50). In 2010, Li et al.55 evaluated linear dPEG12 and dPEG24 conjugated to AVP04–07. Likewise, in 2011, Li et al.61 evaluated dPEG12, dPEG24, and dPEG48 conjugated to AVP04–50. These studies, utilizing the xenograft LS174T mouse model for copper-64 (64Cu) microPET imaging, showed decreased kidney uptake and increased tumor uptake attributed to the increased residence time of the PEGylated diabody in the blood, providing a greater tumor exposure to the conjugates. They accomplished this without loss of immunoreactivity of the PEGylated diabodies compared to the unPEGylated diabody.
We explore herein the effect of three PEGylated conjugates of mCC49 Fab′ using triple branched Mal-dPEG reagents specifically bound to a hinge region cysteine through maleimide (Figure 1). We hypothesized that conjugating discrete, branched PEGs of 2–4 kDa (<10% of the total mass) and varying the chain length and charge would produce a useful range of behavior from which to choose either an optimized drug candidate or a point of departure for further variation of the PEGylation agents.
Chapman et al. demonstrated that the blood concentrations of Fab′ fragments (~50 kDa) are directly related to the size and numbers of site-directed PEGs;38 a single 25 kDa PEG (33% of Fab′-PEG mass) increased blood AUC by 7-fold in rats. Fab′ are far larger than scFv (~26 kDa) fragments, so the effects of similar PEG or dPEG additions are expected to be smaller for Fab′ than for scFv. Interesting and relevant to our current study, Lee et al.40 found that an increase in linear, randomly conjugated PEG mass (4–20 kDa) in scFv-PEG conjugates effectively increased blood AUC roughly linearly with mass, e.g., increasing AUC by 2–3-fold over unconjugated scFv with 4–7 kDa (15–27% of mass) additions, while a single 20 kDa PEG (83% of the total scFv-PEG mass) was more effective than multiple 5,000 PEGs of the same mass, concluding that PEG length was more important than PEG mass. Comparing the unPEGylated scFv (26 kDa) to the Fab′ (50 kDa), it appears that similarly rapid blood clearance occurs with Fab′-NEM with initial half times ~1–2 h compared to 0.7 h for Lee’s scFv.40 In our study of the ~50 kDa Fab′, an 8.3% mass increase with a single, site-specifically labeled branched dPEG-A increased the AUC by a factor of ~2 over unconjugated Fab′, which is consistent with Chapman’s and Lee’s findings. But interestingly, we found that only one of the three tested branched PEGylation agents achieved this. Hence dPEGs of a similar mass (Mal-dPEG-C), the same length without the −3 charge (Mal-dPEG-C), and the same charge with shorter length (Mal-dPEG-B) actually decreased Fab′ blood retention by factors of 0.47 and 0.56, respectively. Apparently, with specific design criteria, even an 8% mass increase can double AUC, but both length and charge of the branched dPEG are important parameters. It is furthermore worth reiterating that such studies are less reliably interpreted with polydispersed PEGs that are always mixtures of many different molecules yielding averaged data at best.
Binding Affinity
Studies have demonstrated that random lysine conjugation of PEGylation reagents on mAb and their fragments may decrease their antigen binding affinities.38 On the other hand, site specific PEGylation at cysteines is more likely to maintain affinity.38 Our results showed that although the hinge region cysteine position was used for conjugation, all three PEGylation reagents reduced the in vitro binding affinity of Fab′-NEM by 30–70%. The shielding effect from the structure of Mal-dPEG-A, -B, and -C probably blocks access to the Tag72 antigen, but charge or length, independently, did not correlate. It is interesting that in vivo Fab′-A had increased tumor retention by 2.1-fold at 24 h calculated by microPET/CT counts (Table S3), and 1.3-fold at 72 h based on biodistribution (Table 2) compared to Fab′-NEM. By comparing microPET/CT imaging from Fab′-A, -B, and -C (Figure 2b), we found that the ratios of the tumor intensities from Fab′-A/-B or Fab′-A/-C are close (2.3- and 2.8-fold at 24 h; 2.7- and 2.3-fold at 72 h). Fab′-NEM, Fab′-B, and Fab′-C are similar in blood retention and tumor uptake, while differing by 3-fold in antigen binding strength, suggesting that blood concentration and residence time are more important to tumor accumulation than the antigen binding strength.
Imaging and Biodistribution
The capacity and quality of tumor imaging is mainly dependent on radioactivity in tumor and tumor-to-background ratio. In this study, 124I-Fab′-A demonstrated the highest normalized absolute tumor radioactivity (MBq/mL) from 5 to 72 h on microPET/CT scanning and the highest tumor concentration (%ID/g) in biodistribution at 72 h. T/B ratio values from PET/CT data were not significantly different among the compounds, but 124I-Fab′-A had greater tumor concentration (ratio 1.4–2.8 against all other compounds) at all time points, comparing the normalized intensity of tumors (MBq/mL) and front arms (MBq/mL) (Table S5). Tumor-to-background ratio values by biodistribution at 72 h tended to be similar. In this study the higher uptake/retention of the Fab′-A led to better images and this most likely resulted from the slower clearance encouraged by the dPEG A. Normalized PET/CT counts are plotted against blood radioactivity in Figure 5. We conclude from this data that blood concentrations are reliable estimates of tumor concentrations at 5 and 24 h post administration for our conjugate series.
CONCLUSIONS
We conclude that at this low dPEG mass to Fab′ mass ratio, PEGylation induced AUC increases are so far restricted to about 2–3-fold, consistent with literature where larger dPEG mass to protein mass ratios were tested, and that the specific branched dPEG chemical structure is surprisingly important to achieving a meaningful lengthening of blood AUC. Furthermore, blood retention values are predictive of relative tumor accumulation and microPET/CT image quality in this small set of mCC49 Fab′ conjugates, opening the possibility that a relatively simple and rapid blood clearance screen will substitute in drug discovery studies for the more labor-intensive biodistribution and imaging studies.
Supplementary Material
Acknowledgments
This work was partially funded by a grant from Quanta Biodesign. We also thank The Ohio State University College of Medicine and the Stefanie Spielman Foundation for additional support.
ABBREVIATIONS
Footnotes
Notes
The authors declare the following competing financial interest(s): A.P., P.D., and R.B. are or were (R.B.) employees of Quanta Biodesign for this work.
Further details and discussion of the synthetic preparation, SDS-Page gels, % ID per organ and organ tumor/tissue ratio biodistribution data, blood clearance data calculation spreadsheet, and PET SUV and ratio data. This material is available free of charge via the Internet at http://pubs.acs.org.
References
- 1.Johnson VG, Schlom J, Paterson AJ, Bennett J, Magnani JL, Colcher D. Analysis of a human tumor-associated glycoprotein (TAG-72) identified by monoclonal antibody B72.3. Cancer Res. 1986;46:850–857. [PubMed] [Google Scholar]
- 2.Sheer DG, Schlom J, Cooper HL. Purification and composition of the human tumor-associated glycoprotein (TAG-72) defined by monoclonal antibodies CC49 and B72.3. Cancer Res. 1988;48:6811–6818. [PubMed] [Google Scholar]
- 3.Loy TS, Nashelsky MB. Reactivity of B72.3 with adenocarcinomas. An immunohistochemical study of 476 cases. Cancer. 1993;72:2495–2498. doi: 10.1002/1097-0142(19931015)72:8<2495::aid-cncr2820720830>3.0.co;2-e. [DOI] [PubMed] [Google Scholar]
- 4.Povoski SP, Neff RL, Mojzisik CM, O’Malley DM, Hinkle GH, Hall NC, AMurrey DA, Jr, Knopp MV, Martin EW., Jr A comprehensive overview of radioguided surgery using gamma detection probe technology. World J Surg Oncol. 2009;7:11. doi: 10.1186/1477-7819-7-11. [DOI] [PMC free article] [PubMed] [Google Scholar]
- 5.Povoski SP, Hatzaras IS, Mojzisik CM, Arnold MW, Hinkle GH, Hitchcock CL, Young DC, Martin EW., Jr Antigen-directed cancer surgery for primary colorectal cancer: 15-year survival analysis. Ann Surg Oncol. 2012;19:131–138. doi: 10.1245/s10434-011-1880-3. [DOI] [PubMed] [Google Scholar]
- 6.Povoski SP, Hatzaras IS, Mojzisik CM, Martin EW., Jr Oncologic theranostics: recognition of this concept in antigen-directed cancer therapy for colorectal cancer with anti-TAG-72 monoclonal antibodies. Expert Rev Mol Diagn. 2011;11:667–670. doi: 10.1586/erm.11.54. [DOI] [PubMed] [Google Scholar]
- 7.Thor A, Ohuchi N, Szpak CA, Johnston WW, Schlom J. Distribution of oncofetal antigen tumor-associated glycoprotein-72 defined by monoclonal antibody B72.3. Cancer Res. 1986;46:3118–3124. [PubMed] [Google Scholar]
- 8.Muraro R, Kuroki M, Wunderlich D, Poole DJ, Colcher D, Thor A, Greiner JW, Simpson JF, Molinolo A, Noguchi P, Schlom J. Generation and characterization of B72.3 second generation monoclonal antibodies reactive with the tumor-associated glycoprotein 72 antigen. Cancer Res. 1988;48:4588–4596. [PubMed] [Google Scholar]
- 9.Molinolo A, Simpson JF, Thor A, Schlom J. Enhanced tumor binding using immunohistochemical analyses by second generation anti-tumor-associated glycoprotein 72 monoclonal antibodies versus monoclonal antibody B72.3 in human tissue. Cancer Res. 1990;50:1291–1298. [PubMed] [Google Scholar]
- 10.Sun D, Bloomston M, Hinkle G, Al-Saif OH, Hall NC, Povoski SP, Arnold MW, Martin EW., Jr Radioimmunoguided surgery (RIGS), PET/CT image-guided surgery, and fluorescence image-guided surgery: past, present, and future. J Surg Oncol. 2007;96:297–308. doi: 10.1002/jso.20869. [DOI] [PubMed] [Google Scholar]
- 11.Schneebaum S, Troitsa A, Haddad R, Avital S, Kashtan H, Baratz M, Brazovsky E, Papo J, Skornick Y. Immunoguided lymph node dissection in colorectal cancer: a new challenge? World J Surg. 2001;25:1495–1498. doi: 10.1007/s00268-001-0158-5. [DOI] [PubMed] [Google Scholar]
- 12.Haddad R, Avital S, Troitsa A, Chen J, Baratz M, Brazovsky E, Gitstein G, Kashtan H, Skornick Y, Schneebaum S. Benefits of radioimmunoguided surgery for pelvic recurrence. Eur J Surg Oncol. 2001;27:298–301. doi: 10.1053/ejso.2000.1108. [DOI] [PubMed] [Google Scholar]
- 13.Avital S, Haddad R, Troitsa A, Kashtan H, Brazovsky E, Gitstein G, Skornick Y, Schneebaum S. Radio-immunoguided surgery for recurrent colorectal cancer manifested by isolated CEA elevation. Cancer. 2000;89:1692–1698. doi: 10.1002/1097-0142(20001015)89:8<1692::aid-cncr7>3.0.co;2-2. [DOI] [PubMed] [Google Scholar]
- 14.Arnold MW, Young DM, Hitchcock CL, Barbera-Guillem E, Nieroda C, Martin EW., Jr Staging of colorectal cancer: biology vs. morphology. Dis Colon Rectum. 1998;41:1482–1487. doi: 10.1007/BF02237292. [DOI] [PubMed] [Google Scholar]
- 15.Bertsch DJ, Burak WE, Jr, Young DC, Arnold MW, Martin EW., Jr Radioimmunoguided Surgery system improves survival for patients with recurrent colorectal cancer. Surgery. 1995;118:634–638. doi: 10.1016/s0039-6060(05)80029-7. [DOI] [PubMed] [Google Scholar]
- 16.Arnold MW, Young DC, Hitchcock CL, Schneebaum S, Martin EW., Jr Radioimmunoguided surgery in primary colorectal carcinoma: an intraoperative prognostic tool and adjuvant to traditional staging. Am J Surg. 1995;170:315–318. doi: 10.1016/s0002-9610(99)80295-5. [DOI] [PubMed] [Google Scholar]
- 17.Quinlan D, Davidson A, Gamponia E, Lindley J, Doshi H. Detection of tumor-associated glycoprotein-72 (TAG-72) in short-term and long-term surviving colon cancer patients using a first- and second-generation monoclonal antibody. Proc Am Assoc Cancer Res. 1991;32:271. [Google Scholar]
- 18.Arnold MW, Schneebaum S, Berens A, Petty L, Mojzisik C, Hinkle G, Martin EW., Jr Intraoperative detection of colorectal cancer with radioimmunoguided surgery and CC49, a second-generation monoclonal antibody. Ann Surg. 1992;216:627–632. doi: 10.1097/00000658-199212000-00003. [DOI] [PMC free article] [PubMed] [Google Scholar]
- 19.Arnold MW, Schneebaum S, Berens A, Mojzisik C, Hinkle G, Martin EW., Jr Radioimmunoguided surgery challenges traditional decision making in patients with primary colorectal cancer. Surgery. 1992;112:624–629. [PubMed] [Google Scholar]
- 20.Schlom J, Eggensperger D, Colcher D, Molinolo A, Houchens D, Miller LS, Hinkle G, Siler K. Therapeutic advantage of high-affinity anticarcinoma radioimmuno-conjugates. Cancer Res. 1992;52:1067–1072. [PubMed] [Google Scholar]
- 21.Schlom J, Colcher D, Roselli M, Carrasquillo JA, Reynolds JC, Larson SM, Sugarbaker P, Tuttle SE, Martin EW. Tumor targeting with monoclonal antibody B72.3. Int J Rad Appl Instrum B. 1989;16:137–142. doi: 10.1016/0883-2897(89)90184-0. [DOI] [PubMed] [Google Scholar]
- 22.Martin EW, Jr, Mojzisik CM, Hinkle GH, Jr, Sampsel J, Siddiqi MA, Tuttle SE, Sickle-Santanello B, Colcher D, Thurston MO, Bell JG. Radioimmunoguided surgery using monoclonal antibody. Am J Surg. 1988;156:386–392. doi: 10.1016/s0002-9610(88)80193-4. [DOI] [PubMed] [Google Scholar]
- 23.Schlom J. Basic principles and applications of monoclonal antibodies in the management of carcinomas: the Richard and Hinda Rosenthal Foundation award lecture. Cancer Res. 1986;46:3225–3238. [PubMed] [Google Scholar]
- 24.Pavlinkova G, Beresford GW, Booth BJ, Batra SK, Colcher D. Pharmacokinetics and biodistribution of engineered single-chain antibody constructs of MAb CC49 in colon carcinoma xenografts. J Nucl Med. 1999;40:1536–1546. [PubMed] [Google Scholar]
- 25.Schott ME, Frazier KA, Pollock DK, Verbanac KM. Preparation, characterization, and in vivo biodistribution properties of synthetically cross-linked multivalent antitumor antibody fragments. Bioconjugate Chem. 1993;4:153–165. doi: 10.1021/bc00020a008. [DOI] [PubMed] [Google Scholar]
- 26.Yokota T, Milenic DE, Whitlow M, Wood JF, Hubert SL, Schlom J. Microautoradiographic analysis of the normal organ distribution of radioiodinated single-chain Fv and other immunoglobulin forms. Cancer Res. 1993;53:3776–3783. [PubMed] [Google Scholar]
- 27.Abergel C, Padlan EA, Kashmiri SV, Milenic D, Calvo B, Schlom J. Crystallographic studies and primary structure of the antitumor monoclonal CC49 Fab′. Proteins. 1993;17:438–443. doi: 10.1002/prot.340170411. [DOI] [PubMed] [Google Scholar]
- 28.Yokota T, Milenic DE, Whitlow M, Schlom J. Rapid tumor penetration of a single-chain Fv and comparison with other immunoglobulin forms. Cancer Res. 1992;52:3402–3408. [PubMed] [Google Scholar]
- 29.Milenic DE, Yokota T, Filpula DR, Finkelman MA, Dodd SW, Wood JF, Whitlow M, Snoy P, Schlom J. Construction, binding properties, metabolism, and tumor targeting of a single-chain Fv derived from the pancarcinoma monoclonal antibody CC49. Cancer Res. 1991;51:6363–6371. [PubMed] [Google Scholar]
- 30.Presta LG. Molecular engineering and design of therapeutic antibodies. Curr Opin Immunol. 2008;20:460–470. doi: 10.1016/j.coi.2008.06.012. [DOI] [PubMed] [Google Scholar]
- 31.Huhalov A, Chester KA. Engineered single chain antibody fragments for radioimmunotherapy. Q J Nucl Med Mol Imaging. 2004;48:279–288. [PubMed] [Google Scholar]
- 32.Batra SK, Jain M, Wittel UA, Chauhan SC, Colcher D. Pharmacokinetics and biodistribution of genetically engineered antibodies. Curr Opin Biotechnol. 2002;13:603–608. doi: 10.1016/s0958-1669(02)00352-x. [DOI] [PubMed] [Google Scholar]
- 33.Wu AM, Yazaki PJ. Designer genes: recombinant antibody fragments for biological imaging. Q J Nucl Med. 2000;44:268–283. [PubMed] [Google Scholar]
- 34.Colcher D, Goel A, Pavlinkova G, Beresford G, Booth B, Batra SK. Effects of genetic engineering on the pharmacokinetics of antibodies. Q J Nucl Med. 1999;43:132–139. [PubMed] [Google Scholar]
- 35.Colcher D, Pavlinkova G, Beresford G, Booth BJ, Choudhury A, Batra SK. Pharmacokinetics and biodistribution of genetically-engineered antibodies. Q J Nucl Med. 1998;42:225–241. [PubMed] [Google Scholar]
- 36.Jevsevar S, Kusterle M, Kenig M. PEGylation of antibody fragments for half-life extension. Methods Mol Biol. 2012;901:233–246. doi: 10.1007/978-1-61779-931-0_15. [DOI] [PubMed] [Google Scholar]
- 37.Chen C, Constantinou A, Deonarain M. Modulating antibody pharmacokinetics using hydrophilic polymers. Expert Opin Drug Delivery. 2011;8:1221–1236. doi: 10.1517/17425247.2011.602399. [DOI] [PubMed] [Google Scholar]
- 38.Chapman AP. PEGylated antibodies and antibody fragments for improved therapy: a review. Adv Drug Delivery Rev. 2002;54:531–545. doi: 10.1016/s0169-409x(02)00026-1. [DOI] [PubMed] [Google Scholar]
- 39.Francis GE, Delgado C, Fisher D, Malik F, Agrawal AK. Polyethylene glycol modification: relevance of improved methodology to tumour targeting. J Drug Targeting. 1996;3:321–340. doi: 10.3109/10611869608996824. [DOI] [PubMed] [Google Scholar]
- 40.Lee LS, Conover C, Shi C, AWhitlow M, Filpula D. Prolonged circulating lives of single-chain Fv proteins conjugated with polyethylene glycol: a comparison of conjugation chemistries and compounds. Bioconjugate Chem. 1999;10:973–981. doi: 10.1021/bc990076o. [DOI] [PubMed] [Google Scholar]
- 41.Pedley RB, Boden JA, Boden R, Begent RH, Turner A, Haines AM, King DJ. The potential for enhanced tumour localisation by poly(ethylene glycol) modification of anti-CEA antibody. Br J Cancer. 1994;70:1126–1130. doi: 10.1038/bjc.1994.459. [DOI] [PMC free article] [PubMed] [Google Scholar]
- 42.Kitamura K, Takahashi T, Takashina K, Yamaguchi T, Noguchi A, Tsurumi H, Toyokuni T, Hakomori S. Polyethylene glycol modification of the monoclonal antibody A7 enhances its tumor localization. Biochem Biophys Res Commun. 1990;171:1387–1394. doi: 10.1016/0006-291x(90)90839-f. [DOI] [PubMed] [Google Scholar]
- 43.Fee CJ, Van Alstine JM. Purification of pegylated proteins. Methods Biochem Anal. 2011;54:339–362. doi: 10.1002/9780470939932.ch14. [DOI] [PubMed] [Google Scholar]
- 44.Knop K, Hoogenboom R, Fischer D, Schubert US. Poly(ethylene glycol) in drug delivery: pros and cons as well as potential alternatives. Angew Chem, Int Ed Engl. 2010;49:6288–6308. doi: 10.1002/anie.200902672. [DOI] [PubMed] [Google Scholar]
- 45.Jevsevar S, Kunstelj M, Porekar VG. PEGylation of therapeutic proteins. Biotechnol J. 2010;5:113–128. doi: 10.1002/biot.200900218. [DOI] [PubMed] [Google Scholar]
- 46.Ryan SM, Mantovani G, Wang X, Haddleton DM, Brayden DJ. Advances in PEGylation of important biotech molecules: delivery aspects. Expert Opin Drug Delivery. 2008;5:371–383. doi: 10.1517/17425247.5.4.371. [DOI] [PubMed] [Google Scholar]
- 47.Jain A, Jain SK. PEGylation: an approach for drug delivery. A review. Crit Rev Ther Drug Carrier Syst. 2008;25:403–447. doi: 10.1615/critrevtherdrugcarriersyst.v25.i5.10. [DOI] [PubMed] [Google Scholar]
- 48.Gaberc-Porekar V, Zore I, Podobnik B, Menart V. Obstacles and pitfalls in the PEGylation of therapeutic proteins. Curr Opin Drug Discovery Dev. 2008;11:242–250. [PubMed] [Google Scholar]
- 49.Veronese FM, Pasut G. PEGylation, successful approach to drug delivery. Drug Discovery Today. 2005;10:1451–1458. doi: 10.1016/S1359-6446(05)03575-0. [DOI] [PubMed] [Google Scholar]
- 50.Harris JM, Chess RB. Effect of pegylation on pharmaceuticals. Nat Rev Drug Discovery. 2003;2:214–221. doi: 10.1038/nrd1033. [DOI] [PubMed] [Google Scholar]
- 51.Roberts MJ, Bentley MD, Harris JM. Chemistry for peptide and protein PEGylation. Adv Drug Delivery Rev. 2002;54:459–476. doi: 10.1016/s0169-409x(02)00022-4. [DOI] [PubMed] [Google Scholar]
- 52.Povoski SP, Davis P, Colcher D, Martin EW. Single molecular weight discrete PEG compounds: emerging roles in molecular diagnostics, imaging, and therapeutics. Expert Rev Mol Diagn. 2013;13:315–319. doi: 10.1586/erm.13.19. [DOI] [PMC free article] [PubMed] [Google Scholar]
- 53.Webster R, Elliott V, Park BK, Walker D, Hankin M, Taupin P. PEG and PEG conjugates toxicity: towards an understanding of the toxicity of PEG and its relevance to PEGylated biologicals. Milestones Drug Ther. 2009:127–146. [Google Scholar]
- 54.Bendele A, Seely J, Richey C, Sennello G, Shopp G. Short communication: Renal tubular vacuolation in animals treated with polyethylene-glycol-conjugated proteins. Toxicol Sci. 1998;42:152–157. doi: 10.1006/toxs.1997.2396. [DOI] [PubMed] [Google Scholar]
- 55.Li L, Turatti F, Crow D, Bading JR, Anderson AL, Poku E, Yazaki PJ, Williams LE, Tamvakis D, Sanders P, Leong D, Raubitschek A, Hudson PJ, Colcher D, Shively JE. Monodispersed DOTA-PEG-conjugated anti-TAG-72 diabody has low kidney uptake and high tumor-to-blood ratios resulting in improved 64Cu PET. J Nucl Med. 2010;51:1139–1146. doi: 10.2967/jnumed.109.074153. [DOI] [PMC free article] [PubMed] [Google Scholar]
- 56.Bailey GS. The Iodogen Method for Radiolabeling Protein. Humana Press Inc; Totowa, NJ: 1996. [Google Scholar]
- 57.Paus E, Bormer O, Nustad K. Radioiodination of proteins with the Iodogen method. International Atomic Energy Agency; Vienna: 1982. [Google Scholar]
- 58.Slavine NV, Antich PP. Practical method for radioactivity distribution analysis in small-animal PET cancer studies. Appl Radiat Isot. 2008;66:1861–1869. doi: 10.1016/j.apradiso.2008.06.008. [DOI] [PMC free article] [PubMed] [Google Scholar]
- 59.Maddalena ME, Fox J, Chen J, Feng W, Cagnolini A, Linder KE, Tweedle MF, Nunn AD, Lantry LE. 177Lu-AMBA biodistribution, radiotherapeutic efficacy, imaging, and autoradiography in prostate cancer models with low GRP-R expression. J Nucl Med. 2009;50:2017–2024. doi: 10.2967/jnumed.109.064444. [DOI] [PubMed] [Google Scholar]
- 60.Wedeking P, Tweedle M. Comparison of the Biodistribution of Gd-153-Labeled Gd(Dtpa)2-, Gd(Dota)-, and Gd(Acetate)N in Mice. Nucl Med Biol. 1988;15:395–402. doi: 10.1016/0883-2897(88)90009-8. [DOI] [PubMed] [Google Scholar]
- 61.Li L, Crow D, Turatti F, Bading JR, Anderson AL, Poku E, Yazaki PJ, Carmichael J, Leong D, Wheatcroft D, Raubitschek AA, Hudson PJ, Colcher D, Shively JE. Site-specific conjugation of monodispersed DOTA-PEGn to a thiolated diabody reveals the effect of increasing peg size on kidney clearance and tumor uptake with improved 64-copper PET imaging. Bioconjugate Chem. 2011;22:709–716. doi: 10.1021/bc100464e. [DOI] [PMC free article] [PubMed] [Google Scholar]
Associated Data
This section collects any data citations, data availability statements, or supplementary materials included in this article.