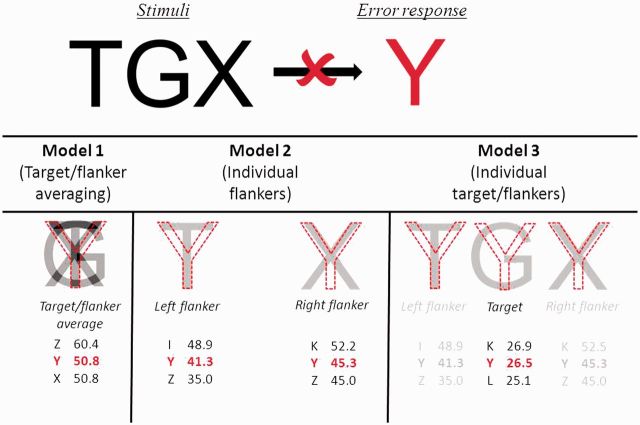
Figure 2.
Three models assessing whether the identity of error responses could be predicted on the basis of the similarity between that error response and the averaged (Model 1) or individual (Models 2 and 3) overlap with flanker and/or target stimuli. The current example involves the stimulus ‘TGX’ yielding an error response of ‘Y’. Values in red refer to the visual similarity of the error response (higher values represent greater similarity) generated from the overlap in pixels with each item (averaged target/flanker, or individual target/flankers). Values in black refer to responses which have similarity values closest to the error response.

