

Abstract
The effects of P deficiency on growth, N2‐fixation and photosynthesis in white clover (Trifolium repens L.) plants were investigated using three contrasting relative addition rates of P, or following abrupt withdrawal of the P supply. Responses to a constant below‐optimum P supply rate consisted of a decline in N2‐fixation per unit root weight and a small reduction in the efficiency with which electrons were allocated to the reduction of N2 in nodules. Abrupt removal of P arrested nodule growth and caused a substantial decline in nitrogenase activity per unit root weight, but not per unit nodule mass. Similarly, the rate of photosynthesis per unit leaf area was unaffected by abrupt P removal, whereas CO2 acquisition for the plant as a whole decreased due to a decline in total leaf area, leaf area per unit leaf weight and utilization of incoming radiation. These changes followed the decline in tissue P concentrations. The ratio between CO2‐fixation and N2‐fixation was maintained under short‐term P deprivation but increased under long‐term low P supply, indicating a regulatory inhibition of nodule activity following morphological and growth adjustments. It is concluded that N2‐fixation did not limit the growth of clover plants experiencing P deficiency. A low P status induced changes in the relative growth of roots, nodules and shoots rather than changes in N and/or C uptake rates per unit mass or area of these organs.
Key words: Fodder legumes, grassland, phosphorus, phosphorus deficiency, photosynthetic efficiency, N2‐fixation, nitrogenase activity, relative addition rate, specific shoot area, Trifolium repens L., white clover
INTRODUCTION
All cultivated legumes possess the ability to reduce atmospheric dinitrogen (N2) symbiotically and to make it available to plants. Generally, restrictions on plant growth are caused by scarcity of other resources, such as phosphorus (P), which is strongly bound in soil, resulting in a low rate of diffusion towards the root surface (Tinker and Nye, 2000). The phytoavailability of P in grassland is characterized by both spatial and temporal fluctuations, following variations in soil organic matter turnover and in the diffusion of low‐molecular weight inorganic and organic P compounds (Veresoglou and Fitter, 1984; Jackson and Caldwell, 1993). P deficiency occurs in semi‐natural and low‐input managed grasslands and may affect the ability of fodder legumes, particularly white clover, to obtain an input of N that is sufficient to ensure a productive system.
Under environmental stress, most N2‐fixing legumes are capable of maintaining a high metabolic activity in their root nodules (Walsh, 1995). However, nitrogenase activity is particularly sensitive to abiotic stresses such as salinity (Serraj et al., 1994) and drought (Durand et al., 1987).
The relationship between low P supply and N2‐fixation is not clear. A low and limiting P supply eventually reduces plant growth and thus reduces N demand and N2‐fixation, but evidence concerning the regulating mechanisms is conflicting. Some studies suggest that regulation takes place in the photosynthetic apparatus, thereby affecting the production and supply of non‐structural carbohydrates to the nodules (Robson et al., 1981; Jacobsen, 1985; Sa and Israel, 1991; Gordon et al., 1997); others indicate that the regulation of N2‐fixation has a direct effect on nitrogenase activity in the nodules (Ribet and Drevon, 1995; Drevon and Hartwig, 1997; Almeida et al., 2000).
Environmental stress causes species‐specific responses of N2‐fixation activity. The responses will reflect the duration and severity of the stress, the plant growth history, and effects on nodulation and nodule anatomy (Walsh, 1995). In the short term there may be considerable decoupling of plant nutrient uptake and plant growth as it may take some time before a specific nutrient becomes limiting. In such dynamic cases, theories such as the resource‐ratio hypothesis (Hunt and Nicholls, 1986) and the multiple‐limitation hypothesis (Chapin et al., 1987) do not necessarily provide adequate explanations as they have been developed to predict plant responses under steady‐state conditions. The theories may, however, be valuable tools for the prediction of longer‐term adaptations where plants are expected to allocate resources preferentially to those functions that most strongly limit growth (Bloom et al., 1985).
The aim of the present studies was to investigate the responses of N2‐fixation, growth and morphology of white clover plants to P deficiency. To obtain an integrated view of the effects of P deficiency, experiments that simulated long‐term steady‐state situations were conducted using different relative addition rates of P (Ingestad, 1982; Ingestad and Ågren, 1988). Allowing plants to adapt to specific P conditions, however, gives no indication of when and where primary metabolic regulation takes place. Therefore, in subsequent experiments, the P supply was withdrawn abruptly and plants were fully deprived of external P for 3 weeks to study the short‐term dynamic responses.
MATERIALS AND METHODS
Plant material and growth conditions
Seeds of white clover (Trifolium repens L. ‘Milkanova’) were germinated in vermiculite. After 1 week, plants were inoculated with a Rhizobium leguminosarum biovar trifolii strain (WPBS5 of IGER, Aberystwyth, Wales) that is known to lack uptake hydrogenase activity, thus enabling the measurement of H2 evolution for nitrogenase activity. Seed germination and plant growth were carried out in a controlled environment chamber at 75 % relative humidity, with a 16/8 h day/night length, a 20/15 °C day/night temperature and a light intensity (photosynthetically active radiation) of approx. 300 µmol photons m–2 s–1 at plant level (Powerstar HQI‐T 400 W/D, Osram, Germany).
While growing in the vermiculite medium, plants were watered twice a week with an N‐free nutrient solution containing (mmol m–3): 400 CaCl2; 200 MgSO4; 400 K2SO4; 100 NaH2PO4; 50 H3BO3; 50 FeC6H5O7; 20 MnSO4; 2 ZnSO4; 1 Na2MoO4; 0·5 CuSO4; 0·5 NiSO4; and 0·5 CoCl3. Four weeks after planting, samples of six trifoliate plants were transplanted to 4‐l containers that were purged by ambient air. The plant samples were fixed in the lid by an inert plastic material (Terostat®; Henkel Surface Technologies, Philadelphia, PA, USA), positioning most of the nodules above the nutrient solution. The solution was renewed twice a week until the experimental period started and was then changed three times per week to maintain the nutrient content. After renewal, the biological buffer MES [2‐(N‐Morpholino)‐ethanesulfonic acid; 10 ml of a 750 mmol m–3 solution at pH 6·0] was added to control the pH in the nutrient solution.
Experimental protocols
Steady‐state experiments were conducted after white clover plants had adapted to three different growth rates controlled by relative addition rates (RAR), four containers per RAR, following the equation (Ingestad, 1982; Ingestad and Ågren, 1988):
net daily P addition = P(t + 1) – P(t) = P(t) × (eRAR – 1) (1)
where P(t) is the P content per unit plant dry weight at time, t.
Treatments started when plants were 7 weeks old (after sowing) and continued for 3 weeks. The RAR treatments of 0·03, 0·06 and 0·10 g P g–1 P d–1 were obtained by supplying the required amounts of P each morning [eqn (1)]. Before adding P, the nutrient solution was sampled and kept frozen (–20 °C) until analysis. After the plants had adapted to these treatments for 21 d, they were subjected to gas exchange measurements (completed within 2 d).
After transfer from the 100 mmol m–3 P concentration in the pre‐experimental nutrient solution, plants adjusted to the new lower P supply of the RAR treatments by effluxing P during the first days after transfer. Assessed on the basis of the amount of P added and the amount remaining just before the next addition on the following day, it was evident that roots from plants in RAR 0·03, 0·06 and 0·10 treatments showed a net efflux of P during the first 12, 6 and 4 d, respectively. Thereafter, plants at RAR 0·03 and 0·06 had depleted the P content of the nutrient solution entirely by the end of the 24 h period between P additions, whereas plants subjected to the 0·10 RAR treatment were not able to absorb all of the P supplied on a daily basis.
The short‐term experiment, which aimed to investigate the effects of abrupt P deprivation, was conducted after growing plants with a non‐limiting P supply (100 mmol m–3) for 10 weeks after sowing, after which the P supply was withdrawn from half of the plants.
For both groups of plants, controls and P‐deprived, measurements started at the point of P withdrawal. Subsequently, measurements was carried out every 3–4 d until the final sampling after 17 d. Four replicate containers, each with six clover plants, were sampled at random on each measurement day.
Shoot measurements
Shoot CO2 and water vapour exchanges were measured using a differential CO2/H2O infrared gas analyser (Ciras‐1; PP Systems, Hitchin, UK), recording the difference between the inlet and outlet concentration of the two gases. Each single container was placed in a 25‐l perspex cuvette, subjected to a flow rate of 30 l air min–1.
Chlorophyll fluorescence (FMS‐1; Hansatech Instru ments Ltd, Pentney, UK) was determined on three repli cate leaves per pot over a period of 6 min following 30 min dark‐adaptation. The youngest fully expanded leaves were selected and a light intensity equivalent to the ambient light of 300 µmol photons (PAR) m–2 s–1 was used.
Phloem sap was sampled using the exudation in EDTA technique (Urquhart and Joy, 1981). Sampling starting at 0900 h by excising three leaves per container, immersing their petioles immediately into 5 ml 20 mol m–3 EDTA (pH 7·0), and placing them in a dark container in a water‐saturated atmosphere (Caputo and Barneix, 1997). After 6 h, leaves were blotted dry and weighed. The solution containing the phloem exudates was stored at –80 °C until analysed for amino acid composition using HPLC (Waters AccQ‐Tag 3·9 × 150 mm column; Waters 474, Milford, MA, USA).
Root measurements
The lids in which the plants were fixed were transferred to the containers for gas exchange measurements and left to adjust for 1 h. The tightly fitting lid and the plastic material around the stem bases enclosed the root compartment effectively. All root gas exchange measurements were conducted using an open‐flow system in conjunction with a flow‐through H2 analyser (Layzell et al., 1984) with a flow‐rate of 1000 ml min–1 and a root volume of 1200 ml of which 200 ml contained a P‐free nutrient solution. CO2 emission from nodulated roots was measured using a differential CO2/H2O infrared gas analyser (Ciras‐1). Nitrogenase (EC 1.7.99.2) activity was determined by measuring H2 evolution in 79 : 21 (v/v) mixtures of N2 : O2 and Ar : O2 obtained by mixing high purity (99·999 %) gases using mass‐flow controllers. To obtain the correct rate of N2‐fixation, the values for nitrogenase activity were adjusted using the electron allocation coefficient (EAC) defined as 1‐(ANA/TNA), where ANA and TNA denote the apparent and total nitrogenase activity, measured as H2 evolution in the N2 : O2 and Ar : O2 mixtures, respectively. ANA and the initial root respiration were measured for 5 min in the N2 : O2 gas mixture and then in the Ar : O2 mixture. TNA was deter mined as the peak H2 evolution. Following the peak, the argon‐induced decline was determined as the decline after 30 min. The EAC values obtained were between 0·55 and 0·69, which corresponds with the near‐optimum values reported by Hunt and Layzell (1993).
The H2 concentration in the dried gas stream was determined using a calibrated H2 sensor (Qubit Systems Inc., Kingston, Canada). The sensor was reconditioned each morning (Layzell et al., 1989) by injecting 2 ml pure H2 into the gas stream.
Tissue analysis
Following gas exchange measurements, roots were rinsed in de‐ionized water, excised and blotted dry. Fresh weight (f. wt) of roots and shoots was determined. Nodules were removed from the root material and weighed. The shoot leaf area was measured (one‐side) using an LI‐3100 Area Meter (LICOR Inc., Lincoln, NE, USA). The plant material was frozen (–20 °C), freeze‐dried to constant weight and weighed again before being ground (mesh size of 0·2 mm).
Nitrogen and phosphorus determination
Nitrogen in the ground plant material was analysed using an ANCA‐SL Elemental Analyser coupled to a 20‐20 Tracermass Mass Spectrometer (Europa Scientific Ltd, Crewe, UK) using the Dumas combustion method. The remaining plant material was dry‐ashed at 550 °C for 3 h, solubilized in 3 m HCl, dried and solubilized again in 1 m HNO3 before filtering. The P concentration in the plant digests and in samples taken from the nutrient solution in the long‐term steady‐state experiment was determined by UV‐VIS spectrophotometry using the molybdo‐phosphoric blue method of Murphy and Riley (1962).
Statistical analysis
Data were analysed by regression analysis using the SAS ANOVA procedure (SAS Institute Inc., 1993). Comparison of the means for the individual treatments was done using a Waller–Duncan t‐test.
RESULTS
Steady‐state responses to different P supply rates
Total dry matter production was reduced (P = 0·07) from 1·17 g per plant at RAR 0·10 to 1·10 and 1·05 g per plant at RAR 0·06 and 0·03, respectively. The shoot : root ratio decreased from 2·94 to 2·38 when RAR was reduced from 0·10 to 0·03 (data not shown). Plants that had adapted to the lowest P supply rate also contained the smallest amount of N and P in the shoots and roots (Table 1). As the dry matter yield was only slightly decreased as a result of reduced P supply, this difference was mainly due to a lower N (P < 0·05) and P (P < 0·005) concentration in the plant dry matter at the lowest RAR. There was a decline in N2‐fixation from 4·68 to 3·02 µmol N2 g–1 root f. wt h–1 when the P supply was reduced from 0·10 to 0·03 g P g–1 P d–1 (Table 2). This was associated with an electron allocation efficiency (EAC) of 55 % (s.e. = 0·3 %) at RAR 0·03 compared with 62 % (s.e. = 2·0 %) in the other two cases. The argon‐induced decline in nitrogenase activity was 3 % at RAR 0·03, and approx. 8 % in the other two treatments.
Table 1.
Nitrogen and phosphorus accumulation (mg per plant) and content (%) in dry matter of white clover plants adapted to grow under different long‐term steady‐state P treatments controlled by the relative daily addition rate of P
| Treatment | ||||
| (g P g–1 P d–1) | Root N (mg) | Shoot N (mg) | Root P (mg) | Shoot P (mg) |
| 0·03 | 9·99 (0·61)a | 18·98 (0·58)a | 0·75 (0·06)a | 0·85 (0·04)a |
| 0·06 | 12·90 (0·17)a | 25·54 (1·62)ab | 1·12 (0·08)b | 1·49 (0·10)b |
| 0·10 | 12·27 (1·44)a | 31·27 (4·12)b | 1·31 (0·10)b | 3·07 (0·29)c |
| (%) | (%) | (%) | (%) | |
| 0·03 | 3·24 (0·11)a | 2·59 (0·10)a | 0·24 (0·00)a | 0·12 (0·00)a |
| 0·06 | 3·96 (0·06)b | 3·30 (0·05)b | 0·34 (0·02)b | 0·19 (0·01)b |
| 0·10 | 4·25 (0·12)b | 3·60 (0·19)b | 0·46 (0·02)c | 0·36 (0·03)c |
Values shown in parentheses are means of four observations ± s.e. Different superscripts within a column indicate differences on a 5 % level.
Table 2.
N2‐fixation and net photosynthesis in white clover plants grown under different long‐term steady‐state P treatments controlled by the relative daily addition rate of P
| Ratio net | |||||
| Relative addition rate (g P g–1 P d–1) | N2‐fixation* (µmol N2 g–1 root f. wt h–1) | Net photosynthesis (µmol CO2 m–2 shoot surface area s–1) | Net photosynthesis (µmol CO2 s–1 on total shoot basis) | photosynthesis : N2‐fixation (mmol CO2 µmol–1 N2 ) | Specific leaf area (cm g–1 DM) |
| 0·03 | 3·02 (0·21)a | 10·6 (2·2)a | 0·47 (0·09)a | 302 (86)a | 103 (6 )a |
| 0·06 | 3·50 (0·08)a | 9·4 (0·7)a | 0·58 (0·05)a | 158 (14)ab | 134 (6)b |
| 0·10 | 4·68 (0·53)b | 8·1 (0·5)a | 0·59 (0·06)a | 94 (14)b | 142 (4)b |
Values are means of four observations (± s.e.). Different superscripts within a column indicate differences on a 5 % level.
* Nodules were mistakenly not separated from the roots, thus N2‐fixation could not be calculated on a nodule basis.
Net photosynthesis per unit shoot surface area declined with decreasing RAR on a total shoot basis (Table 2). Mean rates of root respiration were 628, 774 and 798 µmol CO2 g–1 root f. wt h–1 at RAR 0·03, 0·06 and 0·10. This decrease (P = 0·09) may indicate a lower growth rate following reduced P supply.
The ratio of total net CO2‐fixation to N2‐fixation was much higher at a lower P supply than at a higher P supply (Table 2), suggesting a regulatory inhibition of N2‐fixation following reduced N demand. Furthermore, shoot morphology changed with P supply in the sense that the specific leaf area (SLA) was reduced (P < 0·05) to 103 cm2 g–1 at RAR 0·03 compared with 142 cm2 g–1 at the highest RAR (Table 2).
Short‐term dynamic responses to P withdrawal
Growth.
Total withdrawal of the P supply for the last 3 weeks of the experiment did not (P > 0·05) affect the total dry matter yield of single white clover plants (Fig. 1A). The shoot : root ratio was not (P > 0·05) affected by P withdrawal within the experimental period, with mean values increasing from 2·76 at the onset of P deprivation to 4·52 on day 17. The relative growth rates of shoots and roots were similar for P‐starved and control plants at 0·163 d–1 for shoots and 0·185 d–1 for roots.
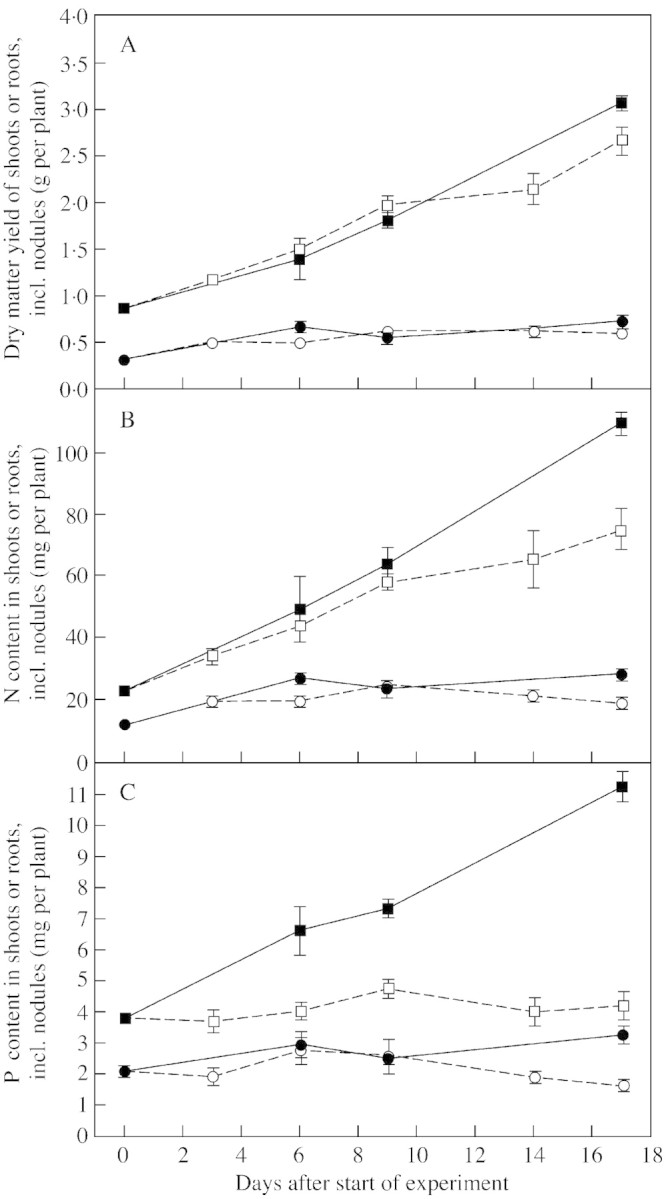
Fig. 1. Dry matter yield (A), and content of nitrogen (B) and phosphorus (C) in shoots (squares) and roots (circles) of white clover plants grown with a continuous supply of phosphorus (closed symbols) or abruptly deprived of phosphorus (open symbols) following withdrawal of the external P supply. Values are means of four observations. Bars represent ± s.e.
Withdrawal of P did, however, result in lower N (P < 0·008) and P (P < 0·05) concentrations in the dry matter compared with concentrations in plants with full access to P in the nutrient solution (Fig. 1B and C). Thus, while control plants continued to accumulate P throughout the experimental period, accumulation of P in the shoots of P‐deprived plants ceased and that in the roots even declined slightly. Nodule N constituted 33 and 6·3 % of total root‐N and total plant‐N, respectively; corresponding values for nodule P were 24 and 5·4 %.
Nutrient concentrations in the dry matter.
The N concentration in the dry matter of roots, including nodules, declined by approx. 20 % (Fig. 2A) following P withdrawal. The P concentration in the dry matter was initially high, at 0·46, 0·65 and 0·70 % in shoots, roots and nodules, respectively. Following P withdrawal, tissue P concentration decreased to a greater extent than tissue N concentration, and the decline was greater in roots (65 %) and shoots (53 %) than in nodules (40 %; Fig. 2B). The P concentration in the P‐sufficient control plants declined by 21 % with plant age. The concentration of P in nodules was consistently higher than that in roots and shoots, and roots had a higher P concentration in the dry matter than shoots.

Fig. 2. Concentration of nitrogen (A) and phosphorus (B) in shoots (squares), roots (circles) and nodules (diamonds) of white clover plants grown with a continuous supply of phosphorus (closed symbols) or abruptly deprived of phosphorus (open symbols) following withdrawal of the external P supply. Values are means of four observations. Bars represent ± s.e.
Nodule dry mass and specific leaf area.
Nodule dry mass continued to increase in control plants, whereas values for P‐deprived plants reached their highest levels around 9 d after P withdrawal (Fig. 3A). At 6 d after P deprivation, the SLA was lower (P = 0·06) in P‐deprived plants than in control plants, and this difference persisted (P < 0·05) (Fig. 3B).

Fig. 3. Nodule dry mass (A) and specific leaf area (B) of white clover plants grown with a continuous supply of phosphorus (closed symbols) or abruptly deprived of phosphorus (open symbols) following withdrawal of the external P supply. Values are means of four observations. Bars represent ± s.e.
N2‐fixation and photosynthesis.
Nitrogenase activity declined by approx. 17 % under continuous P supply and by approx. 40 % under P deprivation when expressed as N2‐fixation per unit root f. wt (Fig. 4A). However, when expressed on a per unit nodule mass basis, P‐deprived plants tended to maintain a higher specific nitrogenase activity than control plants (Fig. 4B). This difference was already significant (P < 0·05) 9 d after P withdrawal. The EAC and argon‐induced decline of H2 efflux from the nodules were not affected by P supply (data not shown), maintaining mean values of 69 and 12 %, respectively.

Fig. 4. Nitrogenase activity per unit root fresh weight (A) and nitrogenase activity per unit nodule dry weight (B) in white clover plants grown with a continuous supply of phosphorus (closed circles) or abruptly deprived of phosphorus (open circles) following withdrawal of the external P supply. Values are means of four observations. Bars represent ± s.e.
In the case of photosynthesis, the efficiency with which incoming radiation was utilized (ΦPSII) was lower in P‐deprived plants than in controls by the end of the experimental period (Fig. 5). Non‐photochemical quenching (i.e. radiating heat; qNP) was higher (P < 0·05) in P‐deprived plants (Fig. 5), whereas photochemical quenching remained unaffected (data not shown).

Fig. 5. PSII quantum yield efficiency (squares) and non‐photochemical quenching coefficient (circles) in leaves of white clover plants grown with a continuous supply of phosphorus (closed symbols) or abruptly deprived of phosphorus (open symbols) following withdrawal of the external P supply. Mean s.e. is indicated; n = 12.
Specific CO2 exchange tended to decrease with plant age in both treatments throughout the 18 d experimental period, but net CO2‐fixation per shoot of P‐starved plants was lower than that of controls (P < 0·01), whereas the specific CO2 exchange per unit shoot area was not affected by P supply (Fig. 6). Specific root respiration also decreased with time after withdrawal of P, from a mean of 670 µmol CO2 g–1 root f. wt s–1 at the start of the experiment to 582 µmol CO2 g–1 root f. wt s–1 in controls and 365 µmol CO2 g–1 root f. wt s–1 in P‐deprived plants, respectively, after 17 d (data not shown)

Fig. 6. Photosynthetic net CO2 fixation per unit leaf area (squares) and per total plant (circles) in white clover plants grown with a continuous supply of phosphorus (closed symbols) or abruptly deprived of phosphorus (open symbols) following withdrawal of the external P supply. Bars represent ± s.e.; n = 4.
The ratio of total net CO2‐fixation in shoots to total N2‐fixation in roots was independent of P supply, suggesting a finely tuned interregulation of N2‐fixation and photosynthetic CO2‐fixation (Fig. 7).

Fig. 7. Ratio of total net CO2 fixation and total N2‐fixation per white clover plant grown with a continuous supply of phosphorus (closed symbols) or abruptly deprived of phosphorus (open symbols) following withdrawal of the external P supply. Bars represent ± s.e.; n = 4.
Phloem exudate composition.
Under steady‐state conditions the concentration of asparagine in the EDTA‐solution was higher (approx. 22 pm) at RAR 0·03 and 0·06 than at RAR 0·10 (approx. 8 pm; P < 0·05). No differences in phloem amino acid concentration were observed under short‐term P‐deprivation.
DISCUSSION
Steady‐state P supply experiment
In plants with different growth rates, determined by the relative daily P additions, root growth was favoured compared with shoot growth at low P supply. In addition, N2‐fixation per plant and per unit root mass decreased with reduction in the rate of P supply, as did SLA (Table 2). However, net photosynthesis per unit leaf area (Table 2) was not significantly affected by P supply although plants experiencing a withdrawal of their P supply showed a slight reduction in the concentration of N in the shoots, from 3·63 to 2·83 % (Fig. 2A).
As both root respiration and N2‐fixation per unit root mass were lower at low P supply, the assimilates partitioned to the root system were used mainly to increase the size of the root system which, under field conditions, would be a key factor in the uptake of P from the soil solution. The higher ratio of net CO2 to N2‐fixation, following adjustment to lower P supply, together with the reduction in the N2‐fixation per unit root mass (Table 2), suggests that P deficiency induced a feedback reduction of symbiotic N2‐fixation (Oti‐Boateng and Silsbury, 1993; Parsons et al., 1993; Hartwig et al., 1994). As the concentration of asparagine in the phloem extracts was higher at the lower RARs (0·03 and 0·06) than at the highest RAR (P < 0·05), this inhibition may have been caused by a reduced demand for N by the clover plants under long‐term steady‐state conditions, as found by Neo and Layzell (1997). A similar conclusion was reached by Almeida et al. (2000), who measured the asparagine concentration in P‐deficient and control white clover plants grown with inorganic N supply.
The inhibition of N2‐fixation was associated with a small reduction in the efficiency with which electrons were allocated to the reduction of N2 in nodules. The argon‐induced decline, in particular under the lowest P supply, indicates that such a reduction in efficiency did take place; this is in agreement with results of previous studies (Drevon and Hartwig, 1997; Vadez et al., 1997; Tang et al., 2001). In contrast to the present study, low P supply to clover plants supplied with inorganic N caused an increase in the N concentration of shoot dry matter (Fig. 2A; Almeida et al., 2000).
Short‐term P deprivation experiment
As clover plants in this experiment were older and, therefore, larger when subjected to P deficiency than plants in the steady‐state experiments, responses to P starvation were expected to occur after some delay. However, despite having a relatively high P status (Fig. 2), plants responded rapidly to the withdrawal of P. Changes in photosynthetic activity were observed 6 d after P withdrawal and they coincided with adjustments of SLA and nodule mass (Figs 3 and 6). The increase in nodule mass stopped after approx. 9 d of P deprivation, whereas nodule growth was maintained in control plants, whose final nodule mass was approximately double that of P‐starved plants (Fig. 3A). This result is in agreement with findings of previous studies (e.g. Gordon et al., 1990; Almeida et al., 2000; Tang et al., 2001).
The amount of P in nodules at the onset of P‐deprivation constituted a significant proportion of whole plant (5·4 %) and root (33 %) P content. Owing to the decline in nodule mass of P‐deprived plants, by day 17 nodules contributed less (22 %; P = 0·003) to total root‐P in the deprived plants than in control plants (38 %). Nevertheless, the proportional decline in P concentration was greater in the dry matter of shoots and roots (Fig. 2B) than in nodules, confirming results of studies on other species (Jacobsen, 1985; Sa and Israel, 1991; Drevon and Hartwig, 1997; Tang et al., 2001). The measured trends in P concentration thus indicate that nodules do constitute a preferential sink for P in white clover (Fig. 2B) or that nodules can absorb P directly from the nutrient solution (Al‐Niemi et al., 1998).
Phosphorus concentrations in the dry matter of white clover plants used in the present experiments (Fig. 2B) were within the range shown by Sa and Israel (1991) to cause decreases in specific nitrogenase activity in soybean. However, in the present work P‐deprived white clover plants increased the level of N2‐fixation per unit nodule mass compared with that of controls (Fig. 4B). This result corresponds to conclusions by Almeida et al. (2000) concerning the exposure to a low P content of clover plants grown in the presence of inorganic N.
The hypothesis that nodule growth undergoes regulatory inhibition by an N feedback mechanism is not directly supported by results obtained from the analysis of amino acid contents of the phloem (Caputo and Barneix, 1997). Total amino acid and asparagine contents in the EDTA‐promoted phloem exudates in P‐deprived plants did not differ from those of the controls; this finding is in contrast to that of Neo and Layzell (1997). However, the EDTA‐promoted exudation technique may not be sufficiently sensitive to reveal changes in the phloem composition that could include a regulatory response in relation to nodule activity under adaptation to P deficiency (Parsons et al., 1993; Bacanamwo and Harper, 1996).
The continued N2‐fixation in white clover under P starvation was also reflected by an unchanged EAC and argon‐induced decline in nitrogenase activity. This indicates that there is no direct effect of P on the diffusion barrier of the nodule (Sheehy et al., 1983) within the duration of the experiment, since an increase in the resistance to gas diffusion in this barrier would have increased the internal concentration of H2 and, subsequently, reduced the EAC below the theoretical optimum of 75 %. The mean values of EAC obtained in the present work (69 %) correspond to near‐optimal values (Hunt and Layzell, 1993). A fast reduction following a significant change in plant N status (e.g. Neo and Layzell, 1997) could not be expected. The present experiments demonstrate that clover plants can reduce the capacity of their N2‐fixation apparatus, i.e. nodules, within a few days (Fig. 3B) whilst maintaining the specific N2‐fixation activity (Fig. 4B).
Leaf photosynthesis per unit leaf area (Fig. 6) and nitrogenase activity per unit root mass (Fig. 4) displayed parallel declines with time in both control and P‐deprived plants. This was presumably a consequence of an increasing degree of self‐shading, leading to a growth curve that was less than exponential. It is likely that this self‐shading effect restricted both specific nitrogenase activity and the magnitude of the argon‐induced decline in control and P‐deprived plants (Faurie and Soussana, 1993).
Contrary to the findings of Almeida et al. (2000), a reduction in the rate of photosynthesis per unit leaf area with decreasing P supply was not observed. The lack of an effect of P on the specific shoot CO2 exchange is in accordance with the observation that photochemical quenching remained unaffected. An increase in non‐photochemical quenching following P deficiency (Fig. 5) has also been found in sunflower and maize (Jacob, 1995). The efficiency with which incoming radiation was utilized decreased with increasing P starvation (Fig. 5; Lauer et al., 1989). This suggests a slower adjustment of PSI and PSII to the relatively low light intensity, which follows a slower oxidation of the traps upon reduction from a strong light pulse (Schreiber et al., 1995).
Comparison of the short‐term and long‐term responses of white clover to P supply
Comparisons of the results obtained from two complementary experimental approaches in the present study show that the response of white clover to a lack of P supply depends on the duration of the stress. The effects displayed by clover plants subjected to short‐term P deprivation were similar to, but less marked than, those observed in clover plants adjusting to steady‐state low P supplies.
As total dry matter yield was not reduced significantly within the duration of the experiments, the white clover plants were able to cope with P deprivation. The adaptive response of white clover plants to continuously low P‐supply consisted, first, of changes in plant morphology (phenotypic plasticity) resulting in a proportional reduction in shoot mass, which is in accordance with the resource‐ratio hypothesis (Bloom et al., 1985; Hunt and Nicholls, 1986). In addition, the morphological adjustments included a reduction in SLA. These changes in morphology imply that the leaf area per plant was smaller under P deprivation leading to a decline in whole plant photosynthesis since the photosynthetic rate per unit leaf area was not affected significantly. Similar morphological changes in the root system caused major reductions in nodule mass, leading to a decline in the nitrogenase activity per unit root mass, but, as indicated by the response to short‐term P‐deprivation, not per unit nodule mass. Therefore, the clover plants responded to P deprivation by increasing partitioning to the roots (for P acquisition), and by reducing leaf area (C acquisition) and nodule mass (N acquisition). Such regulatory behaviour is in accordance with the phenotypic plasticity (Grime, 1979) that is typical of many grassland genotypes (Fransen et al., 1999). In both experiments, phenotypic adaptation appeared to be triggered at a threshold of approximately 0·27 % P in shoots (Table 1; Figs 2B and 3).
As a consequence of tight regulation (Bloom et al., 1985), the ratio of total CO2‐fixation to total N2‐fixation was maintained in the short‐term deprivation experiment (Fig. 7). However, under a severe steady‐state P deficiency, this ratio increased (Table 2), suggesting an inhibition of N2‐fixation caused by an N supply feedback mechanism, as indicated by an increased asparagine concentration in the phloem. Almeida et al. (2000) reached the same conclusion, and in both investigations nodule growth was hindered, whereas nitrogenase activity per unit nodule mass remained unaffected. It is concluded that the rate of N2‐fixation does not limit white clover growth under P‐deficient conditions.
The observed responses to P deprivation are in contrast to well known reversible short‐term inhibition effects on N2‐fixation caused by external nitrate supply (Minchin et al., 1986). In the present experiments, the short‐term changes in P supply affected nodule growth only 6 d after P withdrawal, whereas nitrate is known to act on the gas diffusion barrier of nodules within hours. This implies that restoring N2‐fixation would take longer under P deprivation than under excess nitrate. Clearly, legumes need to resume N2‐fixation quickly whenever N availability is reduced, as this is the basis of their competitive advantage in environments where N supply is low or fluctuating. A rapid re‐establishment of N2‐fixation after a period of P starvation might be less critical for white clover, especially under low‐input conditions where co‐existing grasses grow slowly.
In summary, this work has shown that a low P status initiates whole plant adaptive responses in white clover. Changes in the relative growth of shoots, roots and nodules, rather than changes in the resource uptake rates per unit mass or per unit area of these plant parts, appear to be involved. Thus, the duration of P‐deprivation and plant age can influence experimental results significantly. Although the exact mechanism is not yet fully understood, an N‐feedback mechanism is apparently involved in the regulation of nodule growth in P‐deficient white clover plants. Since the P‐deprived plants were apparently not N‐deficient, except possibly at the lowest steady‐state P supply rate, the observed reductions in shoot : root ratio and in SLA were directly induced by a low P content in the plant tissue, rather than by a low N status. Finally, the observed phenotypic changes arose below a threshold of approximately 0·27 % P content in the dry matter of white clover shoots.
ACKNOWLEDGEMENT
Financial support from the Danish Agricultural Research Centre for Organic Farming is gratefully acknowledged.
Supplementary Material
Received: 4 July 2002; Returned for revision: 26 July 2002; Accepted: 18 September 2002 Published electronically: 24 October 2002
References
- AlmeidaJPF, Hartwig UA, Frehner M, Nösberger J, Lüscher A.2000. Evidence that P deficiency induces N feedback regulation of symbiotic N2 fixation in white clover (Trifolium repens L.). Journal of Experimental Botany 51: 1289–1297. [PubMed] [Google Scholar]
- Al‐NiemiTS, Kahn ML, McDermott TR.1998. Phosphorus uptake by bean nodules. Plant and Soil 198: 71–78. [Google Scholar]
- BacanamwoM, Harper JE.1996. Regulation of nitrogenase activity in Bradyhizobium japonicum/soybean symbiosis by plant N status as determined by shoot C:N ratio. Physiologia Plantarum 98: 529–538. [Google Scholar]
- BloomAJ, Chapin FS III, Mooney HA.1985. Resource limitation in plants – an economic analogy. Annual Review of Ecological Systems 16: 363–392. [Google Scholar]
- CaputoC, Barneix AJ.1997. Export of amino acids to the phloem in relation to N supply in wheat. Physiologia Plantarum 101: 853–860. [Google Scholar]
- ChapinFS III, Bloom AJ, Field CB, Waring RH.1987. Plant responses to multiple environmental factors. Bioscience 37: 49–57. [Google Scholar]
- DrevonJ‐J, Hartwig UA.1997. Phosphorus deficiency increases the argon‐induced decline of nodule nitrogenase activity in soybean and alfalfa. Planta 201: 463–469. [Google Scholar]
- DurandJ‐L, Sheehy JE, Minchin FR.1987. Nitrogenase activity, photosynthesis and nodule water potential in soyabean plants experiencing water deprivation. Journal of Experimental Botany 38: 311–321. [Google Scholar]
- FaurieO, Soussana J‐F.1993. Oxygen‐induced recovery from short‐term nitrate inhibition of N2 fixation in white clover plants from spaced and dense stands. Physiologia Plantarum 89: 467–475. [Google Scholar]
- FransenB, Blijjenberg J, de Kroon H.1999. Root morphological and physiological plasticity of perennial grass species and the exploitation of spatial and temporal heterogeneous nutrient. Plant and Soil 211: 179–189. [Google Scholar]
- GordonAJ, Kessler W, Minchin FR.1990. Defoliation‐induced stress in nodules of white clover. I. Changes in physiological parameters and protein synthesis. Journal of Experimental Botany 41: 1245–1253. [Google Scholar]
- GordonAJ, Minchin FR, Skot L, James CL.1997. Stress‐induced decline in soybean N2 fixation are related to nodule sucrose synthase activity. Plant Physiology 114: 937–946. [DOI] [PMC free article] [PubMed] [Google Scholar]
- GrimeJP.1979. Plant strategies and vegetation processes. Chichester: Wiley. [Google Scholar]
- HartwigUA, Heim I, Lüscher A, Nösberger J.1994. The nitrogen‐sink is involved in the regulation of nitrogenase activity in white clover after defoliation. Physiologia Plantarum 92: 375–382. [Google Scholar]
- HuntR, Nicholls AO.1986. Stress and the course control of growth and root‐shoot partitioning in herbaceous plants. Oikos 47: 149–158. [Google Scholar]
- HuntS, Layzell DB.1993. Gas exchange of legume nodules and the regulation of nitrogenase activity. Annual Review of Plant Physiology and Plant Molecular Biology 44: 483–511. [Google Scholar]
- IngestadT.1982. Relative addition rate and external concentration; driving variables used in plant nutrition research. Plant, Cell and Environment 5: 443–453. [Google Scholar]
- IngestadT, Ågren GI.1988. Nutrient uptake and allocation at steady‐state nutrition. Physiologia Plantarum 72: 450–459. [Google Scholar]
- JacksonRB, Caldwell MM.1993. The scale of nutrient heterogeneity around individual plants and its quantification with geostatistics. Ecology 74: 612–614. [Google Scholar]
- JacobJ.1995. Phosphate deficiency increases the rate constant of thermal dissipation of excitation energy by photosystem II in intact leaves of sunflower and maize. Australian Journal of Plant Physiology 22: 417–424. [Google Scholar]
- JacobsenI.1985. The role of phosphorus in nitrogen fixation by young pea plants (Pisum sativum). Physiologia Plantarum 64: 190–196. [Google Scholar]
- LayzellDB, Weagle GE, Canvin DT.1984. A highly sensitive flow through H2 gas analyzer for use in nitrogen fixation studies. Plant Physiology 75: 582–585. [DOI] [PMC free article] [PubMed] [Google Scholar]
- LayzellDB, Hunt S, King BJ, Walsh KB, Weagle GE.1989. A multichannel system for steady‐state and continuous measurements of gas exchange from legume roots and nodules. In: Torrey JG, Winship LJ, eds. Applications of continuous and steady‐state methods to root biology Dordrecht: Kluwer Academic Publishers, 1–28. [Google Scholar]
- LauerMJ, Blevins DG, Sierzputowska‐Gracz H.1989. 31P‐nuclear magnetic resonance determination of phosphate compartmentation in leaves of reproductive soybeans (Glycine max L.) as affected by phosphate nutrition. Plant Physiology 89: 1331–1336. [DOI] [PMC free article] [PubMed] [Google Scholar]
- MinchinFR, Minguez MI, Sheehy JE, Witty JF, Skøt L.1986. Relationships between nitrate and oxygen supply in symbiotic nitrogen fixation by white clover. Journal of Experimental Botany 37: 1103–1113. [Google Scholar]
- MurphyJ, Riley JP.1962. A modified single solution method for the determination of phosphate in natural waters. Analytical Chemistry Acta 27: 31–36. [Google Scholar]
- NeoHH, Layzel DB.1997. Phloem glutamine and the regulation of O2 diffusion in legume nodules. Plant Physiology 113: 259–267. [DOI] [PMC free article] [PubMed] [Google Scholar]
- Oti‐BoatengC, Silsbury JH.1993. The effects of exogenous amino acid on acetylene reduction activity of Vicia Faba L. cv. Fiord. Annals of Botany 71: 71–74. [Google Scholar]
- ParsonsR, Standforth A, Raven JA, Sprent JI.1993. Nodule growth and activity may be regulated by a feedback mechanism involving phloem nitrogen. Plant, Cell and Environment 16: 125–136. [Google Scholar]
- RibetJ, Drevon J‐J.1995. Phosphorus deficiency increases the acetylene‐induced decline in nitrogenase activity in soybean (Glycine max (L.) Merr.). Journal of Experimental Botany 46: 1479–1486. [Google Scholar]
- RobsonAD, O’Hare GW, Abbott LK.1981. Involvement of phosphorus in nitrogen fixation by subterranean clover (Trifolium subterraneum L.). Australian Journal of Plant Physiology 8: 427–436. [Google Scholar]
- SaT‐M, Israel DW.1991. Energy status and functioning of phosphorus‐deficient soybean nodules. Plant Physiology 97: 928–935. [DOI] [PMC free article] [PubMed] [Google Scholar]
- SAS Institute Inc.1993. SAS/STAT® software: syntax, version 6, first edition. Cary, NC: SAS Institute Inc. [Google Scholar]
- SchreiberU, Bilger W, Neubauer C.1995. Chlorophyll fluorescence as a nonintrusive indicator for rapid assessment of in vivo photosynthesis. In: Schulze E‐D, Caldwell MM, eds. Ecophysiology of photo synthesis Berlin: Springer‐Verlag, 40–70. [Google Scholar]
- SerrajR, Roy GR, Drevon J‐J.1994. Salt stress induces a decrease in the oxygen uptake of soybean nodules and in their permeability to oxygen diffusion. Physiologia Plantarum 91: 161–168. [Google Scholar]
- SheehyJE, Minchin FR, Witty JF.1983. Biological control of the resistance to oxygen flux in nodules. Annals of Botany 52: 565–571. [Google Scholar]
- TangC, Hinsinger P, Drevon J‐J and Jaillard B.2001. Phosphorus deficiency impairs early nodule functioning and enhances proton release in roots of Medicago truncatula L. Annals of Botany 88: 131–138. [Google Scholar]
- TinkerPBH, Nye PH.2000. Solute movement in the rhizosphere. Oxford: Oxford University Press. [Google Scholar]
- UrquhartAA, Joy KW.1981. Use of phloem exudate technique in the study of amino acid transport in pea plants. Plant Physiology 68: 750–754. [DOI] [PMC free article] [PubMed] [Google Scholar]
- VadezV, Beck DP, Lasso JH, Drevon J‐J.1997. Utilization of the acetylene reduction assay to screen for tolerance of symbiotic N2‐fixation to limiting P nutrition in common bean. Physiologia Plantarum 99: 227–232. [Google Scholar]
- VeresoglouDS, Fitter AH.1984. Spatial and temporal patterns of growth and nutrient uptake of five co‐existing grasses. Journal of Ecology 72: 259–272. [Google Scholar]
- WalshKB.1995. Physiology of the legume nodule and its response to stress. Soil Biology and Biochemistry 27: 637–655. [Google Scholar]
Associated Data
This section collects any data citations, data availability statements, or supplementary materials included in this article.