

Abstract
Vertebrate sensory organs originate from both cranial neural crest cells (CNCCs) and placodes. Previously we have shown that the olfactory placode (OP) forms from a large field of cells extending caudally to the pre-migratory neural crest domain, and that OPs form through cell movements and not cell division. Concurrent with OP formation CNCCs migrate rostrally to populate the frontal mass. However, little is known about the interactions between CNCCs and the placodes that form the olfactory sensory system. Previous reports suggest that the OP can generate cell types more typical of neural crest lineages such as neuroendocrine cells and glia, thus marking the OP as an unusual sensory placode. One possible explanation for this exception is that the neural crest origin of glia and neurons has been overlooked due to the intimate associated of these two fields during migration. Using molecular markers and live imaging, we followed the development of OP precursors and of dorsally migrating CNCCs in zebrafish embryos. We generated a six4b:mCherry line (OP precursors) that, with a sox10:EGFP line (CNCCs), was used to follow cell migration. Our analyses showed that CNCCs associate with and eventually surround the forming OP with limited cell mixing occurring during this process.
Keywords: sox10, dlx3b, six4b
INTRODUCTION
The highly specialized structures of the vertebrate head, including the sensory organs, appeared concurrently with the neural crest and neurogenic placodes during the evolution of craniates (Northcutt and Gans, 1983; Northcutt, 1996). Neural crest cells are multipotent cells that contribute to a wide variety of cell types including neurons, glia, endocrine cells, and melanocytes, with the cranial neural crest cells (CNCCs) giving rise to cartilage, bone, cranial neurons, glia, and connective tissues of the face (Le Douarin and Kalcheim, 1999). To contribute to a variety of cell types in the frontal mass, CNCCs follow defined migratory routes at precise developmental times from their origins in the mesencephalic regions of the premigratory neural crest (Osumi-Yamashita et al., 1994). CNCCs migrate into the developing head via two distinct routes: ventrally and caudal to the eye, where they contribute to the jaw and craniofacial muscles, and rostrally, dorsal to the prosencephalon, where they populate the frontal mass (Le Douarin and Kalcheim, 1999). Great strides have been made in the understanding of the patterning, differentiation, and molecular signaling during CNCC specification and migration (Brugmann and Moody, 2005; Creuzet et al., 2005; Brugmann et al., 2006; Noden and Francis-West, 2006). Pre-migratory and migratory CNCCs are specified by transcription factors including members of the Fox, Pax, Sox families (see for review: (Nelms and Labosky, 2010). Analysis of migration in vivo has led to detailed descriptions of the post-otic migratory route, but the route passing dorsal to the eye remains less well understood.
Neurogenic placodes are neuroectodermal thickenings in the developing head that contribute to the paired sense organs (i.e. nose, lens, ear and lateral line) and the cranial sensory ganglia (Graham and Begbie, 2000; Baker and Bronner-Fraser, 2001; Schlosser, 2006). Placodes arise from a unique territory in the head ectoderm termed the pre-placodal region, which is induced by activators of FGF (presumptive adenohypophyseal, olfactory, otic lateral line, and epibranchial placodes) and antagonists of the BMP and Wnt signaling cascades (Litsiou et al., 2005; Schlosser, 2010). The anterior pre-placodal region is characterized by the expression of the Six, Eya, and Dlx gene families, which are expressed in an inverted horseshoe shaped pattern along the edge of the rostral neural plate (Torres and Giraldez, 1998) (Schlosser, 2006) In zebrafish, six4b (previous called six4.1; (Kawakami et al., 2000; Kobayashi et al., 2000), eya1 (Sahly et al., 1999), and dlx3b (Akimenko et al., 1994) are expressed in the pre-placodal region and their expression persists during formation of multiple placodes including the olfactory placodes (OPs). Previously, we fate mapped the rostral neural plate of the zebrafish starting at 12hpf (hours post fertilization) and demonstrated that the OPs arise from fields of cells on either side of the developing telencephalon (Whitlock and Westerfield, 2000). These fields of cells converge rostrally, in the absence of cell division, to form the OPs (Whitlock and Westerfield, 2000). Once formed, the OPs give rise to non-neural support cells as well as to the olfactory sensory neurons of the peripheral nervous system (Farbman, 1992; Baker and Bronner-Fraser, 2001; Whitlock, 2004b).
Both placodes and CNCCs are known to contribute to mature sensory structures such as neurons of the cranial sensory ganglia (Northcutt, 1993). The neurons of cranial nerves V, VII, IX, and X that are derived from placodes are larger and located distally to the smaller, proximal neurons, which are of crest origin (D’Amico-Martel and Noden, 1983; Le Douarin and Kalcheim, 1999). The neuroglia of all of the cranial ganglia are exclusively derived from neural crest (Le Douarin and Kalcheim, 1999), although the glia of the olfactory sensory system are thought to derive from the placode. In addition to glia cells, the OP has been proposed as an origin for cells containing gonadotropin-releasing hormone (GnRH). The GnRH cells of the terminal nerve (cranial nerve 0) are closely associated with the OP (Whitlock, 2004c), but have been shown to originate from neural crest in zebrafish (Whitlock et al., 2003; Whitlock et al., 2005) and in mouse (Forni et al., 2011). The neural crest origin of the terminal nerve GnRH cells and their close association with the OP raises the question of whether the CNCCs mix with OP precursors during early development of the olfactory sensory placode.
To understand how the CNCCs and OP fields interact during craniofacial development, we used markers and imaging techniques to follow their cellular movements as they migrated rostrally. In particular we examined potential interactions between OP precursors and CNCCs during the migration that leads to OP formation. sox10 is a transcription factor expressed in premigratory neural crest (Dutton et al., 2001a; Dutton et al., 2001b) and is thought to play a role in the specification of glia, neuronal, and pigment cells. Using a sox10:EGFP transgenic line (Wada et al., 2005; Carney et al., 2006), we examined EGFP expression in fixed preparations as well as CNCC migration in live embryos. By analysis of the OP field markers dlx3b and six4b, we confirmed that dlx3b expression at the 4–6 somites stage extends to the premigratory CNCC domain. We generated a six4b:mCherry transgenic line that expresses mCherry in the developing olfactory placodes as well as a sox10:EGFP;six4b:mCherry double transgenic line. Our observations suggest that despite their very close association, there is limited cell mixing between the CNCCs and OP fields as the OPs are formed, and that the six4b:mCherry expressing precursors move caudally away from the rostral midline as they contribute to the OP.
RESULTS
Cranial neural crest and olfactory placode precursor cells are closely associated during early migration
To understand the dynamics of the sox10:EGFP expression we processed embryos for sox10 gene expression as well as reporter gene GFP protein expression (Fig. 1A–D). At 4–5s (somite stage) the sox10:EGFP fish express GFP in a similar pattern to that observed for sox10 mRNA (Fig. 1A, B). By 14–15s sox10 mRNA is being down regulated (Fig. 1C) but GFP expression persists in the sox10:EGFP fish due to the perdurance of the GFP protein (Fig. 1D) in cells that expressed sox10 mRNA.
Figure 1.
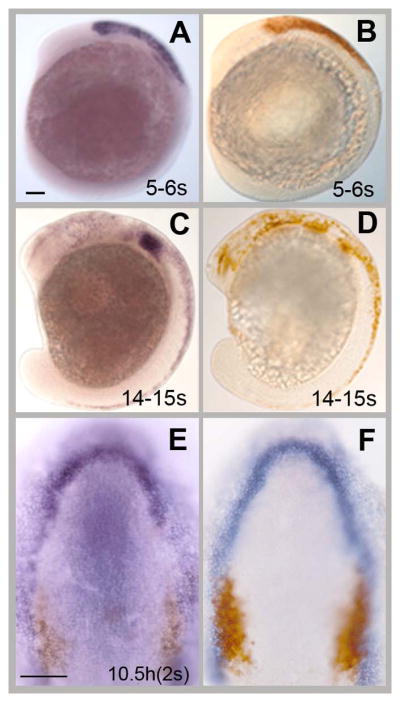
Neural crest (sox10) and olfactory placode (six4b, dlx3b) markers have distinct but partially overlapping expression patterns. (A, C) sox10 in situ hybridization and anti-GFP immunocytochemistry (B,D) in sox10:EGFP embryos. At 5s (A,B) sox10 mRNA expression (A) is similar to GFP expression (B) but at 14–15s (C,D) GFP (D) is expressed in more cells than is sox10 mRNA (C). (E, F) Double labeling of the OP field and CNCCs in sox10:EGFP embryos at 2s. six4b (E, purple) and dlx3b (F, blue) are expressed in the OP field at 2s. Both genes are expressed in a horseshoe shape around rostral neural plate. six4b is more restricted than dlx3b. At this stage the pre-migratory CNCCs (E, F, brown) flank the posterior domains of the six4b (E, purple) and dlx3b (F, blue) fields. A–D, Lateral view, rostral to the right, dorsal to the top of the page. E, F: Dorsal views, rostral to the top of the page. hpf=hours post fertilization, s=somite stage. These abbreviations are same for all figures. Scale bars: A–D= 100um, E, F =100um.
Previously we showed that at 4–6s the pre-migratory CNCCs flank the posterior border of the olfactory field (Whitlock and Westerfield, 2000; Whitlock, 2004b). To better understand the spatial relationship between OP precursors and CNCCs as well as the extent of potential cell mixing between the OP and CNCCs we visualized both fields using markers for the CNCCs and OP cells in fixed, staged embryos. We used an anti-GFP antibody to visualize the CNCCs in the sox10:EGFP zebrafish line (Fig. 1E, F). The OP field was visualized using in situ hybridization with digoxigenin-labeled mRNA probes for two different genes that were previously described as being expressed in the OP field: six4b (Fig. 1E, purple, (Kobayashi et al., 2000), and dlx3b (Fig. 1F, blue, (Akimenko et al., 1994), which is also expressed in the telencephalon (Whitlock and Westerfield, 2000). dlx3b and six4b are expressed at 2s in a horseshoe shaped domain around the rostral neural plate, which includes the OP fields (Fig. 1E, F). dlx3b (Fig. 1F) is more broadly expressed than six4b (Fig. 1E) in the posterior region of the horseshoe where OP precursors meet the sox10:EGFP positive cells of pre-migratory CNCC (Fig. 1E, F, brown).
In order to visualize the OP precursors and CNCC fields simultaneously we double labeled embryos visualizing genes expressed in the developing OP and sox10:EGFP in staged fixed embryos from 4 to 20s. Because we had previously defined the dlx3b domain as a field of cells giving rise to the olfactory placode (Whitlock and Westerfield, 2000; Whitlock, 2004b), we followed changes in the expression pattern of this gene, as well as the previously described six4b, in the sox10:EGFP fish. At 4s the expression domain of dlx3b (Fig. 2A, blue) extends posteriorly abutting the CNCC domain and remains in contact with this domain during early development (Fig 2). In contrast, the six4b expression pattern initially has a large gap separating the OP and CNCC fields (Fig. 3A–C, brackets). This difference in expression between the two genes is maintained as the CNCCs move rostrally at 6s and 8s (Fig. 2B,C and Fig. 3B,C). During development, the gap narrows so that at 10s the six4b and sox10:EGFP expressing fields lie adjacent to one another (Fig. 3D). This coincided with the time just before the CNCCs move ventrally around the OP field. At 12s (Figs. 2E, E′) and 3E, E′) and 14s (Figs. 2F, F′ and 3F, F′) the OP cells began to coalesce in the front of the head and the CNCCs began to engulf the OP cells.
Figure 2.

dlx3b expressing OP precursors share a common border with CNCCs. Visualization of OP convergence (using dlx3b in situ hybridization, in blue) and the CNC field (using anti-GFP immunocytochemistry, in brown), in sox10:EGFP embryos. (A–I) Dorsal views, rostral to the top of the page, of fixed, staged, double-labeled embryos. Embryos were examined every 2 somites. (E, E′) Two different focal planes of the same embryo at 12s: E dorsal olfactory placode, E′ ventral edge of the olfactory placode. (F, F′) Two different focal planes at 14s: F dorsal olfactory placode, F′ ventral edge of the olfactory placode. The CNCCs are both dorsal and ventral to the olfactory fields at these stages. (J, K) Ventral views (rostral to the top) of the formed olfactory placode surrounded by CNCCs at 18s (J) and 20s (K). Scale bars A (for A–K); K (for J, K)= 30um. 20 embryos were examined per time point.
Figure 3.

six4b expressing OP precursors do not share a common border with CNCCs. Visualization of OP field using six4b (in blue) and CNCCs using anti-GFP immunocytochemistry (in brown) in sox10:EGFP embryos. (A–I) Dorsal views, rostral to the top of the page. (E, E′) Two different focal planes of same embryo at 12s: E dorsal OP, E′ ventral edge of the OP. (F, F′) Two different focal planes at 14s: F dorsal OP, F′ ventral edge of the OP. The neural crest cells are both dorsal and ventral to the olfactory fields at these stages. (G–I) CNCCs move dorsally over the forming OP. (J, K) Ventral views of the formed OP surrounded by CNCCS at 18s (J) and 20s (K), rostral to top. Scale bars A (for A–K); K (for J, K)= 30um. 20 embryos were examined per time point.
From stages 12s to 14s (Figs. 2E–F′, 3E–F′) the CNCCs began to encircle the OP placode passing both dorsal and ventral to the dlx3b (Fig 2) and six4b (Fig. 3) positive OP cells. This can only be seen by examining more than one focal plane at 12s (Figs. 2, 3 E, E′) and 14s (Figs. 2, 3F, F′) because the curve of the embryos at these stages made it difficult to visualize all labeled cells in one plane of focus.) The OP becomes evident at 16–18s and the CNCCs surround it as the OP border becomes defined from stages 18 to 20s (Fig. 5H–K) when a clear border between the OP and CNCCs was observed (Figs. 2, J, K; Fig. 3, J,K). Thus as the OP precursors move forward the CNCCs engulf the forming OP as they populate the frontal mass.
Figure 5.

Identification of conserved regulatory elements of the six4b gene. Sequence alignment of six4b in different fish species using zebrafish sequence as reference. Each line represents 10kb of alignment. Six conserved non-coding sequences (highlighted by pink circles) are shown. (A) Three of these are downstream of the six4b gene (A; 1-2-3) and three lie upstream (B; 4-5-6). The blue arrows indicate the direction of the gene. Fragments (1-2-3) and (1–2) were cloned and a construct containing 1–2 was generated. (C) Schematic of cloned promoter regions. red boxes: six4b exons, blue boxes: evolutionary conserved non-coding sequences, arrow: transcriptional direction, asterisks: cloned elements. (see S1 for specific sequence information).
CNCCs and OP cells mix during placode formation
Up until 12s the CNCCs remain posterior to the OP field (see Fig. 2 and 3). At 12s the CNCCs moved around the OP cells. We examined closely the later stages of OP formation in whole mount (Fig. 4A, C, E and G) and sectioned (Fig. 4B, D, F and H) six4b/anti-GFP preparations to determine the extent of mixing between the two groups of cells as the CNCCs surround the OP. At 12–14s, six4b expressing cells are evident within the forming OP, thus defining the border of the OP precursor domain (Fig. 4, A–D, black arrows). As CNCCs (Fig. 4, brown) moved rostrally along the forming neural tube (Fig. 4, nt) individual cells expressing GFP were observed outside the border of the OP (Fig. 4, open arrows). At 12s we observed preparations where CNCCs were mixed with OP cells (Fig. 4B, bracket). Starting at 18s, GFP expressing cells (Fig. 4 E–H, brown) were observed surrounding the OP in whole mount (Fig. 4, A, C, E and G) and sectioned (Fig. 4B, D, F, H) preparations. In whole mount preparations the CNCCs appeared as a cohesive group lying outside the forming OP. Yet, there were instances where we observed mixing of cells (Fig. 4 B, C, E). In specific sections, (Fig 4 F, H, asterisk) there are cells that appear to express both the six4b (blue) and the CNCC marker (brown) although the blue and brown reaction products are not always easily distinguishable. In our in vivo analysis (below) we have not seen co-expression of the EGFP and mCherry in any of the cells we examined carefully. Overall the OP and CNCC precursors move as coherent groups of cells although there is limited mixing of these two groups as they populate the frontal mass. Therefore, our findings suggest that CNC and OP cells largely remain as two distinct groups of cells as they move rostrally.
Figure 4.
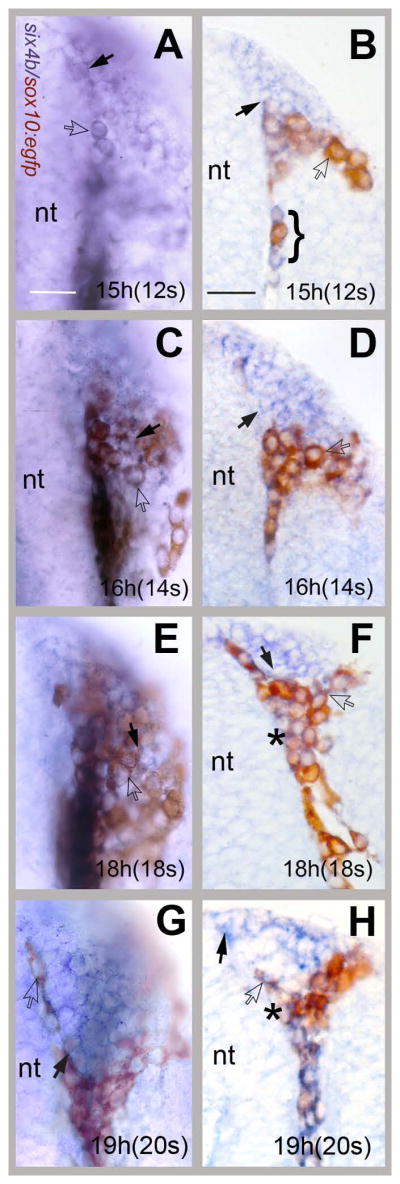
CNC cells move rostrally surrounding the forming OP. Whole mount preparations (A, C, E, G) and cryostat sections (B, D, F, H) of six4b (in situ, blue)/anti-GFP (immunocytochemistry, brown) double-labeled embryos. All images are dorsal views, rostral to top of the page. (A, B) At 12s the neural crest cells were first seen meeting the posterior edge of the OP with some mixing of CNCCs and OP cells (B, bracket). At 14s (C,D) the CNCCs cells began to aggregate at the posterior border of the OP. At 18s (E, F) the neural crest cells surrounded the OP. The border of the OP was refined at 20s (G,H). six4b expressing cells (black arrows) were observed at the edge of the forming OP. Some cells (F, H, asterisks) appeared to be double labeled. nt= neural tube, Scale bars A (for A–G) and B (for B–H)= 30um. 5 whole mount and sectioned embryos were examined at high magnification per time point.
Imaging the formation of the olfactory placode
Previously, using single cell lineage tracing to define the fields of cells that form the OP, we proposed that the OP is formed by a convergence of two large fields of cells on either side of the rostral neural plate (Whitlock and Westerfield, 2000; Whitlock, 2004b; Whitlock et al., 2005). To better understand the cellular movements involved in the formation of the OP we generated a six4b reporter line that we could use to follow cell OP precursor migration in vivo. Using phylogenetic footprinting we identified evolutionarily conserved DNA elements in the genomic region surrounding the six4b gene in different fish species (Fig. 5, Supplemental Data S1). These elements were tested in vivo for their ability to direct reporter expression in stable transgenic zebrafish lines in a pattern that recapitulates expression of six4b. One of the tested elements, derived from the downstream region of the six4b gene, containing fragments 1–2 (Fig. 5A, C, asterisk), reproduced the six4b expression pattern in vivo (Fig. 6A). We generated a stable transgenic zebrafish line, six4b:mCherry, that expresses the red fluorescent protein mCherry under control of a cfos minimal promoter and the conserved downstream fragments 1–2, (Fig. 5A, C).
Figure 6.

six4b:mCherry expression starts during somitogenesis. (A) Expression in OPs in founder at 48hpf. (B–F) Stills from six hour time lapse generated starting at 10s (see S2). (B–F) The OP precursors are concentrated in the most rostral region of the head (asterisk). The six4b:mCherry expressing cell located at the posterior edge of the OP field (C, arrows) coalesce, forming the posterior border (D–F). During this time the anterior six4b:mCherry expressing cells move caudally away from the tip of the neural tube (B–D, asterisk) aggregating to form the olfactory placodes (E, F). All images are dorsal views with rostral to the right. nt =neural tube. Scale bar = 30. (See S2 for movie).
Migration of OP precursor cells
We first analyzed the expression of the six4b:mCherry in a double transgenic sox10:EGFP;six4b:mCherry line (see below) at different stages of development and found that the previously reported placode specific gene expression, (Kobayashi et al., 2000; Whitlock et al., 2005), was recapitulated in our transgenic reporter line. Although the inverted horseshoe pattern was evident by gene expression at 2s (see Fig 1E) expression from six4b:mCherry was not clear until ~10s; at 2s it was diffuse with a low signal to noise ratio. Because the initial six4b:mCherry cells were dispersed and difficult to analyze, we made our time-lapse movies starting at 10s (Fig. 6B, 10s, Supplemental data S2). Using a spinning disc microscope and time-lapse microscopy, we followed the six4b:mCherry cells for 6 hours, tracking movements and behavior of these cells. Initially the OP precursors are located as a loose group of cells in the rostral region of the head (Fig 6B), and by 12s the posterior edge of the six4b:mCherry expression domain becomes more defined (Fig. 6C, arrows). Additionally from 10–12s, the cells move caudally away from the midline (Fig. 6B, C, D, asterisk). As development proceeds the six4b:mCherry cells move caudally, coalescing to form the rostral limit of the OPs (Fig. 6E, F). Thus, our analysis of six4b:mCherry expressing OP precursors shows a net movement away from the rostral midline resulting in the formation of the rostral limits of the OPs.
CNCCs and OP precursor cells follow distinct migratory routes
In order to understand the interactions of the OPs and CNCC precursors during migration we generated a six4b reporter line in a sox10:EGFP background, (Dutton et al., 2001b; Wada et al., 2005) that expressed both six4b:mCherry;sox10:EGFP simultaneously to follow cell migration in vivo. To study the relationship between the CNCCs and OP precursor fields we analyzed double transgenic embryos, sox10:EGFP;six4b:mCherry (Fig. 7, Supplemental Data S3, S4). We found, in agreement with our gene expression analysis in fixed tissues, that CNCCs move rostrally to encircle the OPs. As the sox10:EGFP CNCCs move rostrally, dorsal to the eye, the six4b:mCherry expressing cells (Fig. 7 red, asterisk) separate away from the midline and move posteriorly. Thus, these 2 fields move in opposite directions. During this process, it is possible to observe that the CNCCs migrate over the forming OP (see Fig 3G, H) and, by the end of this time lapse series, the neural crest cells surround the olfactory placode, yet there is a region of the posterior OP that has little to no six4b expression (Fig. 7E, white outlines). This is most likely the same region initially identified through double in situ hybridization as a “gap” region between the six4b and sox10:EGFP expression domains (see Fig. 3A–C, brackets).
Figure 7.
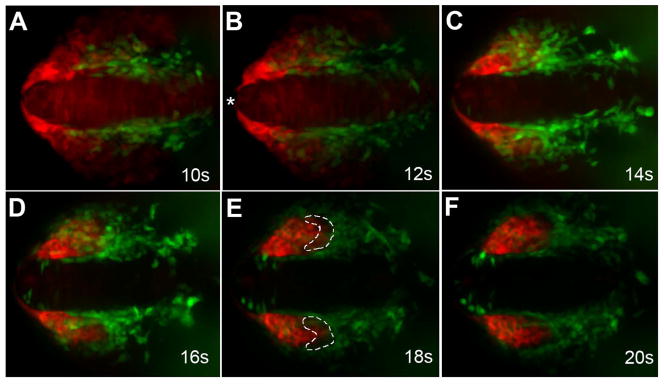
Neural crest cells migrate with olfactory placode precursors. Images from time lapse movie showing migration of CNCCs (green) and OP precursors (red). (A) At 10s OP precursors (red) are wrapped around the rostral end of the neural tube (asterisk). (B) At 12s the OP precursors move away from the rostral midline (asterisk) as CNCCs (green) advance rostrally. (C) By 14s the CNCCs start to surround the posterior edge of the OP precursors. (D) The OP precursors (red) are no longer evident at the tip of the neural tube at 16s. CNCCs (green) arrive at the anterior limit of the OPs. (E) At 18s the CNCCs (green) have migrated to the rostral limit of the olfactory placodes. The posterior region of the OP contains neither green nor red cells (white outline), which is the resumed region of dlx3b expression. (F) At the end of the movie (20s) the olfactory placodes are fully formed. All images are dorsal views with rostral to the right. Scale bar = 30 um (see S3, S4 for movies)
six4b is not expressed in differentiated olfactory sensory neurons
To determine whether six4b is expressed in differentiated olfactory sensory neurons, we crossed the six4b:mCherry line to TRPC2:Venus and OMP:YFP to determine whether six4b:mCherry was expressed in differentiated microvillar (Fig. 8A, B, green) and ciliated olfactory sensory neurons (Fig. 8D, E, green). In both cases the six4b:mCherry expression did not colocalize with either TRPC2:Venus (Fig. 8 A, arrow) or OMP:YFP (Fig. 8D, bracket) in the olfactory epithelia. Upon closer inspection, the six4b:mCherry cells appear to surround (Fig. 8C–E, brackets) the differentiated sensory neurons (Fig. 8A, B, D, E green). Thus it is clear that Six4b is not expressed in differentiated olfactory sensory and the pattern is suggestive of expression in support cells and/or precursor cells.
Figure 8.

six4b:mCherry is not expressed in differentiated sensory neuron subtypes in the olfactory epithelia. (A–C) TRPC2:Venus expressing microvillar sensory neurons in the olfactory organ at 5 dpf. (A) The TRPC2:Venus and six4b:mCherry signals do not co-localize (arrow); the TRPC2:Venus expressing neurons lie apical to the six4b:mCherry expressing cells (A, C, red). (D–F) OMP:YFP expressing ciliated sensory neurons (green) of the olfactory organ are widely distributed throughout the olfactory epithelia (D) but do not express six4b:mCherry (bracket). six4b:mCherry expressing cells appear to surround the sensory neurons with the signal of the sensory neurons (E, bracket) localized to the non-expressing region of the mCherry (F, bracket). All pictures are antero-dorsal views. Scale bar =25um.
DISCUSSION
Olfactory placode formation by convergence of cellular fields
Based on our previous studies, we proposed a model for the formation of the OP in vertebrates in which the OPs are formed through the convergence of cellular fields found on either side of the developing telencephalon (Whitlock, 2004b). Our model for placode formation is supported by fate mapping studies in the chick that demonstrated that the otic, olfactory, and lens placodes also form through the rearrangement of cellular fields via directed cell movements (Graham and Begbie, 2000). Thus, cellular convergence, not localized division, may be a common mechanism for placode formation. Upon examining placode formation using time-lapse microscopy and molecular markers in fixed, staged embryos, we find that the cells giving rise to the OP move rostrally along the forming neural tube starting at approximately 6–8s. The placode cells move over the developing eye and migrate into the rostral part of the developing head by 14s. The placode is initially observed at 16s and is then refined and organized through 20s. As the cells move rostrally, they extend and retract filopodia as they interact with one another. This is consistent with previous electron microscopy studies that describe the cells forming the zebrafish OP as having small “pseudopodia-like” extensions that make connections with other cells (Hansen and Zeiske, 1993).
CNC and OP cells pass one another during OP formation but do not mix
In this study we have visualized the rostral convergence of the OP field and determined the extent of cell mixing between the OP field and CNCCs. Formation of the OP is accompanied by the rostral migration of the CNCCs. We observed limited cell mixing between the CNCCs and OP fields as they moved rostrally. Furthermore, we observed little co-expression of sox10:EGFP with either six4b or dlx3b in these cells. This is consistent with fate mapping experiments that demonstrated that the OP field lies adjacent to the premigratory CNC field and that cells within the CNC domain do not contribute to the OP (Whitlock and Westerfield, 2000; Whitlock et al., 2003). Our findings agree with a model proposed for the chick embryo where there is an orderly positioning of the pre-placodal and CNC fields at the neural plate stage before craniofacial morphogenesis begins (for review see: (Schlosser, 2010). The positioning of the pre-placodal and CNC fields is governed by a complex network of BMP, FGF, and Wnt signaling that results in expression of placodal and CNC specifying transcription factors (e.g. Six and Sox genes respectively) that lead to activation of different signaling cascades (Brugmann and Moody, 2005; Litsiou et al., 2005; Bailey and Streit, 2006; Schlosser, 2006). The early activation of these signaling cascades results in specification of placodal and crest domains before these precursors migrate into the frontal mass. Our data are in agreement with a separation between placode and CNCCs, yet there is not always a clear separation between these fields in the early embryo. In some cases the OP and CNCCs mix at the border between the fields, but we did not observe extensive mixing between the CNCCs and OP fields. Our results in the zebrafish suggest that, in general, the OP and CNCCs remain separate as they migrate rostrally to populate the frontal mass.
The CNCCs are closely associated with the OP cells during migration as they move rostrally and surround the forming OP. Previously, we, and others, have shown that some of the CNCCs differentiate into the neuroendocrine gonadotropin releasing hormone (GnRH) cells of the terminal nerve (Whitlock et al., 2003; Whitlock et al., 2005) (Forni et al., 2011). Our data suggest that these neuroendocrine precursors migrate rostrally with the OP precursors, and remain associated with, but separate from, the OP. In addition to forming the structural elements of the nose (Langille and Hall, 1988; Le Douarin and Smith, 1988; Le Douarin and Kalcheim, 1999), CNCCs also contribute to neurons and glia within the cranial sensory systems. sox10:EGFP is expressed in both neural crest precursors and glia cells (Wada et al., 2005; Carney et al., 2006); thus the cells we visualized surrounding the OP at 18–20s will most likely contribute to structural elements of the face as well as neurons and glia (Dutton et al., 2001a; Dutton et al., 2001b; Kelsh, 2006). The origin of the glia associated with the olfactory sensory system is not well understood. Recently it has been reported that the olfactory ensheathing cells (OECs) of the olfactory sensory system arise from neural crest (Forni et al., 2011). Thus, the CNCCs we observed surrounding the OPs may also differentiate into glia of the olfactory nerve, which would be consistent with what has been shown for other placodes (Schlosser, 2010). Furthermore, in mouse it has been shown that OECs enter the CNS (Forni et al., 2011) consistent with our observations of sox10:EGFP expressing cells in the region of the differentiating olfactory bulb (Pereiro and Whitlock, unpublished).
dlx3b and six4b may establish borders in OP field
We found that dlx3b is expressed more broadly in the OP field compared to six4b at 4–8s. The dlx3b expression domain lies adjacent to the CNC domain, and there is a gap between the CNCCs and the six4b domain. This gap appears to be maintained as the CNCCs migrate rostrally around the forming OP. dlx3b and six4b are both likely to play a role in specifying the OP field, but the dlx3b expression adjacent to premigratory CNC field suggests that it may also be involved in specifying the posterior border between the OP and CNCCs. A role for dlx3b at the border between the OP precursors and premigratory CNC is consistent with a proposed role for the Dlx genes as being “border specifying” genes in the neural plate (Meulemans and Bronner-Fraser, 2002; McLarren et al., 2003; Litsiou et al., 2005; Bailey and Streit, 2006; Schlosser, 2010). In the chick embryo, misexpression of Dlx5 leads to the upregulation of neural plate border genes (including the pre-placodal specifying gene Six4) but not of neural crest specifying genes (McLarren et al., 2003).
A role for dlx3b in the establishment of the posterior border of the OP could be mediated by the opposing activities of dlx and msx genes. The msx genes are a family of vertebrate genes homologous to the Drosophila muscle segment homeobox (msh) gene (Ekker et al., 1997). The Msx and Dlx proteins are thought to antagonize each other by competing for regulatory elements in vivo (Bendall and Abate-Shen, 2000). In zebrafish, msxb and msxc are expressed by CNCCs, and their expression domains abut the dlx3b expression domain at 4–6s (Ekker et al., 1997; Phillips et al., 2006). Zebrafish that contain a deficiency covering the dlx3b gene have a wider neural plate than do wild type animals (Fritz et al., 1996; Solomon and Fritz, 2002; Phillips et al., 2006) and specific knock-down of the Dlx3b protein using morpholinos results in a reduction of the OP at 18s and 24h (Solomon and Fritz, 2002). Phillips et al. (2006) showed that knock-down of multiple Msx proteins using morpholinos rescues the neural plate widening defect observed in the deficiency line. These data suggest that the antagonizing activities of Msx and Dlx proteins refine the neural plate border. It has yet to be determined whether the Dlx and Msx proteins play a similar role in establishing the border between the posterior OP field and premigratory CNCCs.
Conclusions
We have shown that the OP and CNCC precursors move as separate fields of cells during OP morphogenesis with little cell mixing. The CNCCs move rostrally as the six4b-expressing OP precursors separate from the rostral midline. During migration a “gap” between the six4b and sox10 expression domains is maintained until at least 10s. The CNCCs that surround the developing OP most likely contribute to structural elements of the face and possibly to the glia of the olfactory sensory system. Further studies are necessary to define the cellular fates within the OP and the dorsal-migrating CNC precursors.
EXPERIMENTAL PROCEDURES
Animals
Zebrafish were crossed as described previously (Westerfield, 2007) and embryos were collected the morning of fertilization. Wild type embryos were the New Wild Type (NWT) strain, which originated in the Whitlock laboratory by crossing pet store females, selected for producing good haploid embryos, with AB males. The sox10:EGFP transgenic zebrafish line (Wada et al., 2005) was provided by the Kelsh laboratory and maintained in our fish facility. The TRPC2:Venus (GFP) line (microvillar olfactory sensory neurons, (Sato et al., 2005) and the OMP:YFP line (ciliated olfactory sensory neurons, (Sato et al., 2005) were provided by the group of Yoshihiro Yoshihara. The Institutional Animal Use and Care Committees of Cornell University and the University of Valparaiso approved all animal procedures.
Time lapse Imaging
Embryos were mounted in 1.5% low-melting agarose (Sigma, Stock # 077K0084) in an Attofluor cell chamber (Invitrogen) and covered with embryo medium (Westerfield, 2007). A window of agar was removed to allow for visualization of the dorsal side of the developing head. The Attofluor chamber allowed imaging for about six hours at approximately 26°C without replenishing embryo medium. Analysis of the six4b:Cherry positive placodal precursor migration in living embryos was done at the University of Valparaiso using a Spinning Disc confocal microscope (Olympus). Images were acquired using an ORCA IR2 Hamamatsu camera (Japan) and CellR program (Olympus). Starting at the 10s stage cells were followed for 6 hours until the stage of 20 somites; Z-stacks were acquired every 15 minutes. The movies were analyzed using Image J (ImageJ 1.40g, National Institute of Health, USA).
In situ hybridization
After collection, embryos were staged as described by (Kimmel et al., 1995). Embryos were collected and placed at 31°C to accelerate development. The somites (s) were counted to ensure accurate staging. Embryos were fixed in phosphate buffered-4% paraformaldehyde. Digoxigenin and fluorescein labeled mRNA probes were made using the SP6/T7 DIG RNA labeling kit (Invitrogen) following the manufacturers’ instructions. Probes were made to dlx3b (Ekker et al., 1992), six4b (Kobayashi et al., 2000), lhx3 (Glasgow et al., 1997) and sox10 (Dutton et al., 2001b). Embryos 20s and younger were dechorionated after fixation. In situ hybridization was performed as described by (Thisse et al., 1993). The duration of the proteinase-K (Sigma) permeabilization step was as follows: stages 24hpf and earlier: no permeabilization was performed, 36hpf: 1 minute; 48hpf: 3 minutes. Double in situ hybridizations were performed as described in (Schulte-Merker, 2002) with the exception that the anti-fluorescein antibody (Invitrogen) was used at 1:10,000. Blue coloration reaction was done using NBT/BCIP (Invitrogen) and red coloration reaction using INT/BCIP (Invitrogen) following the manufacturer’s instructions.
Immunocytochemistry
Staged embryos (described above) were fixed overnight at 4°C in 4% paraformaldehyde in Fix Buffer (Westerfield, 2007) and processed for immunocytochemistry. Embryos were rinsed in phosphate buffered saline (PBS) and blocked in PBST (PBS and 0.1% Tween 20) with 6% normal donkey serum (Jackson Immuno Research). Embryos 24h and younger did not undergo any permeabilization treatment. Embryos were incubated overnight at 4°C in anti-GFP antibody (rabbit, Invitrogen, 1:500) to detect cells expressing GFP in sox10:EGFP embryos. Embryos were rinsed several times with PBST and incubated with goat anti-rabbit secondary antibody (Covance, 1:200) for 5 hours at room temperature, rinsed several times with PBST and incubated with peroxidase-rabbit anti-peroxidase complex (Covance, 1:500). Coloration reaction was performed using DAB (diaminobenzidine, Sigma) as described in (Whitlock and Westerfield, 2000). Anti-calretinin antibody labeling was performed as described in (Vitebsky et al., 2005).
Double Immunocytochemistry and In situ hybridization
sox10:EGFP embryos were double labeled using anti-GFP antibodies and in situ hybridization by performing sequentially the procedures described above. Immunocytochemistry was performed first with care to use RNase free solutions. Embryos were not placed in methanol because this resulted in a lack of anti-GFP staining. During all blocking/antibody binding steps 0.5ml/ml of RNase Out (Invitrogen) was added. After the DAB reaction, embryos were rinsed several times in PBST and the in situ hybridization was then performed as described above.
Cryostat sections of zebrafish embryos
Embryos already processed for immunocytochemistry and in situ hybridization were used for cryostat sections. Embryos were embedded in agar as described previously (Westerfield, 2007) except that agar embedded embryos were placed in Shandon M-1 Embedding Matrix for frozen sections (Thermo Electron Corporation). Sections were 10–12mm thick.
Generating a six4b transgenic line
Promoter Identification
In order to identify putative regulatory sequences for six4b, we used the Mulan multiple local-alignment program (Ovcharenko et al., 2005), to search for conserved non-coding sequences in the intergenic region surrounding zebrafish six4b. Vertebrate genomic sequences were downloaded from EnsEMBL (version 53) (Hubbard et al., 2009). Using zebrafish as a reference, six non-coding sequences conserved within teleosts were identified between zebrafish (ENSDARG00000031983), stickleback (ENSGACG00000008440), Fugu (ENSTRUG00000010704), Tetraodon (ENSTNIG00000017344), and medaka (ENSORLG00000015756) (Fig. 5). Three were located downstream of six4b (1-2-3, Fig. 5) and three upstream of six4b (4-5-6, Fig. 5). Information about the identity of the sequences used for each species and the sequence alignment of these blocks is shown in Supplemental Figure S1. Using these sequences, primers amplifying two blocks of three fragments each and primers to amplify different combinations were designed. We were able to PCR amplify one block containing fragments 1–2 of 2776bp (forward: GCAACGGTGGTTTCCTAATTCT; reverse: ACATGAAGCGACATGAACGAG). The identity of the fragments was confirmed by sequencing. Fragments (1–2) were cloned using the pCR8/GW/TOPO TA cloning kit (Invitrogen), generating a Gateway Entry vector (Invitrogen), which was then recombined by a LR Clonase reaction into destination vectors with GFP or mCherry as reporters and a c-fos gene minimal promoter. The mCherry construct, pREA, was generated by modifying the existing pGW-cfosEGFP vector (Fisher et al., 2006a; Fisher et al., 2006b). Briefly, the EGFP reporter gene was removed by means of an Age1/Cla1 digest and the mCherry reporter gene was inserted in its place via a compatible ligation. The construct containing downstream fragments 1–2 (Fig. 5c), pTol2six4bA:mCherry, resulted in successful expression of the six4b as reflected by mCherry expression. This line is designated Tg(pTol2six4.1A:mCherry)uv87 and is abbreviated here to six4b:mCherry.
Generation of transgenic lines
The pTol2six4bA:mCherry construct was injected into one cell wild type (NWT line) and sox10:EGFP embryos. Each embryo was injected with 2–4nl of pTol2six4bA:mCherry DNA plus transposase mRNA (~100ng/μl final concentration of each). Embryos were selected at 24 hpf on the basis of transient expression of mCherry as identified under a fluorescent dissecting microscope. Descendants of 256 crossings were analyzed; of these 6 were carrier fish (F0 founders), 5 of them expressing mCherry (red fluorescent) protein in the OP precursors (six4b:mCherry) and a single fish expressing both sox10:EGFP and six4b:mCherry transgenes. These 6 founders were out-crossed to NWT line and stable lines were established. As far as we could discern, all lines presented identical patterns of six4b:mCherry expression.
Supplementary Material
S1. Alignment of 10kb blocks of sequence for the six4b gene in fishes. Information about the identity of the sequences used for each species and the sequence alignment of the aligned blocks that resulted in the identification of conserved elements are shown in (Figure 5).
S2. six4b:mCherry is expressed in the developing OP precursors during somitogenesis. Time lapse movie corresponding to images presented in Figure 6. Dorsal view, anterior is to the right,.
S3. sox10:EGFP expressing neural crest cells (green) migrate with six4b:mCherry olfactory placode precursors (red). Time lapse movie corresponding to images presented in Figure 7. Dorsal view, anterior is to the right,.
S4. Time lapse movie corresponding to images presented in Figure 7 showing only the sox10:EGFP expressing neural crest cells (green).
Acknowledgments
This work was supported by Cornell Center for Vertebrate Genomics Graduate research fellowship (MVH); FONDECYT 3095008 (LP); NIHR01DC0421802/R01HD50820, ICM P06-039F, FONDECYT 107107; 1111046 (KEW). ASM and DM were supported by funds from the NIH (NIGMS: R01GM071648) to A.S.M. M.K.P. was also supported by NIH predoctoral training grant 5T32GM07814.
The authors thank the Kobayashi laboratory for the six4b cDNA, the Kelsh laboratory for the sox10 cDNA and the Westerfield laboratory for dlx3b. We thank Dr. Robert Kelsh for providing the sox10:EGFP. We also thank L. Sanders for imaging assistance and S. Twomey for cryostat sectioning. We thank M. Westerfield and J. Ewer for critical reading of the manuscript.
References
- Akimenko MA, Ekker M, Wegner J, Lin W, Westerfield M. Combinatorial expression of three zebrafish genes related to distal-less: Part of a homeobox gene code for the head. The Journal of Neuroscience. 1994;14:3475–3486. doi: 10.1523/JNEUROSCI.14-06-03475.1994. [DOI] [PMC free article] [PubMed] [Google Scholar]
- Bailey AP, Streit A. Sensory organs: making and breaking the pre-placodal region. Current Topics in Developmental Biology. 2006;72:167–204. doi: 10.1016/S0070-2153(05)72003-2. [DOI] [PubMed] [Google Scholar]
- Baker CV, Bronner-Fraser M. Vertebrate cranial placodes I. Embryonic induction. Developmental Biology. 2001;232:1–61. doi: 10.1006/dbio.2001.0156. [DOI] [PubMed] [Google Scholar]
- Bendall AJ, Abate-Shen C. Roles for Msx and Dlx homeoproteins in vertebrate development. Gene. 2000;247:17–31. doi: 10.1016/s0378-1119(00)00081-0. [DOI] [PubMed] [Google Scholar]
- Brugmann SA, Moody SA. Induction and specification of the vertebrate ectodermal placodes: precursors of the cranial sensory organs. Biological Cell. 2005;97:303–319. doi: 10.1042/BC20040515. [DOI] [PubMed] [Google Scholar]
- Brugmann SA, Tapadia MD, Helms JA. The molecular origins of species-specific facial pattern. Current Topics in Developmental Biology. 2006;73:1–42. doi: 10.1016/S0070-2153(05)73001-5. [DOI] [PubMed] [Google Scholar]
- Carney TJ, Dutton KA, Greenhill E, Delfino-Machín M, Dufourcq P, Blader P, Kelsh RN. A direct role for Sox10 in specification of neural crest-derived sensory neurons. Development. 2006;133:4619–4630. doi: 10.1242/dev.02668. [DOI] [PubMed] [Google Scholar]
- Creuzet S, Couly G, Le Douarin NM. Patterning the neural crest derivatives during development of the vertebrate head: insights from avian studies. Journal of Anatomy. 2005;207:447–459. doi: 10.1111/j.1469-7580.2005.00485.x. [DOI] [PMC free article] [PubMed] [Google Scholar]
- D’Amico-Martel A, Noden DM. Contributions of placodal and neural crest cells to avian cranial peripheral ganglia. American Journal of Anatomy. 1983;166:445–468. doi: 10.1002/aja.1001660406. [DOI] [PubMed] [Google Scholar]
- Dutton K, Dutton JR, Pauliny A, Kelsh RN. A morpholino phenocopy of the colourless mutant. Genesis. 2001a;30:188–189. doi: 10.1002/gene.1062. [DOI] [PubMed] [Google Scholar]
- Dutton KA, Pauliny A, Lopes SS, Elworthy S, Carney TJ, Rauch J, Geisler R, Haffter P, Kelsh RN. Zebrafish colourless encodes sox10 and specifies non-ectomesenchymal neural crest fates. Development. 2001b;128:4113–4125. doi: 10.1242/dev.128.21.4113. [DOI] [PubMed] [Google Scholar]
- Ekker M, Akimenko MA, Allende ML, Smith R, Drouin G, Langille RM, Weinberg ES, Westerfield M. Relationships among msx gene structure and function in zebrafish and other vertebrates. Molecular Biology and Evolution. 1997;14:1008–1022. doi: 10.1093/oxfordjournals.molbev.a025707. [DOI] [PubMed] [Google Scholar]
- Ekker M, Akimenko MA, Bremiller R, Westerfield M. Regional Expression of Three Homeobox Transcripts in the Inner Ear of Zebrafish Embryos. Journal of Neuron. 1992;9:27–35. doi: 10.1016/0896-6273(92)90217-2. [DOI] [PubMed] [Google Scholar]
- Farbman AI. Cell Biology of Olfaction. Cambridge: Cambridge University Press; 1992. [Google Scholar]
- Fisher S, Grice EA, Vinton RM, Bessling SL, McCallion AS. Conservation of RET regulatory function from human to zebrafish without sequence similarity. Science. 2006a;312:276–279. doi: 10.1126/science.1124070. [DOI] [PubMed] [Google Scholar]
- Fisher S, Grice EA, Vinton RM, Bessling SL, Urasaki A, Kawakami K, McCallion AS. Evaluating the biological relevance of putative enhancers using Tol2 transposon-mediated transgenesis in zebrafish. Nature Protocols. 2006b;1:1297–1305. doi: 10.1038/nprot.2006.230. [DOI] [PubMed] [Google Scholar]
- Forni PE, Taylor-Burds C, Melvin VS, Williams T, Wray S. Neural crest and ectodermal cells intermix in the nasal placode to give rise to GnRH-1 neurons, sensory neurons, and olfactory ensheathing cells. Journal of Neuroscience. 2011;31:6915–6927. doi: 10.1523/JNEUROSCI.6087-10.2011. [DOI] [PMC free article] [PubMed] [Google Scholar]
- Fritz A, Rozowski M, Walker C, Westerfield M. Identification of selected gamma-ray induced deficiencies in zebrafish using multiplex polymerase chain reaction. Genetics. 1996;144:1735–1745. doi: 10.1093/genetics/144.4.1735. [DOI] [PMC free article] [PubMed] [Google Scholar]
- Glasgow E, Karavanov AA, Dawid IB. Neuronal and neuroendocrine expression of lim3, a LIM class homeobox gene, is altered in mutant zebrafish with axial signaling defects. Developmental Biology. 1997;192:405–419. doi: 10.1006/dbio.1997.8761. [DOI] [PubMed] [Google Scholar]
- Graham A, Begbie J. Neurogenic placodes: a common front. Trends in Neuroscience. 2000;23:313–316. doi: 10.1016/s0166-2236(00)01606-4. [DOI] [PubMed] [Google Scholar]
- Hansen A, Zeiske E. Development of the olfactory organ in the zebrafish, Brachydanio rerio. Journal of Comparative Neurology. 1993;333:289–300. doi: 10.1002/cne.903330213. [DOI] [PubMed] [Google Scholar]
- Hubbard TJ, Aken BL, Ayling S, Ballester B, Beal K, Bragin E, Brent S, Chen Y, Clapham P, Clarke L, Coates G, Fairley S, Fitzgerald S, Fernandez-Banet J, Gordon L, Graf S, Haider S, Hammond M, Holland R, Howe K, Jenkinson A, Johnson N, Kahari A, Keefe D, Keenan S, Kinsella R, Kokocinski F, Kulesha E, Lawson D, Longden I, Megy K, Meidl P, Overduin B, Parker A, Pritchard B, Rios D, Schuster M, Slater G, Smedley D, Spooner W, Spudich G, Trevanion S, Vilella A, Vogel J, White S, Wilder S, Zadissa A, Birney E, Cunningham F, Curwen V, Durbin R, Fernandez-Suarez XM, Herrero J, Kasprzyk A, Proctor G, Smith J, Searle S, Flicek P. Ensembl 2009. Nucleic Acids Research. 2009:D690–697. doi: 10.1093/nar/gkn828. [DOI] [PMC free article] [PubMed] [Google Scholar]
- Kawakami K, Sato S, Ozaki H, Ikeda K. Six family genes--structure and function as transcription factors and their roles in development. Bioessays. 2000;22:616–626. doi: 10.1002/1521-1878(200007)22:7<616::AID-BIES4>3.0.CO;2-R. [DOI] [PubMed] [Google Scholar]
- Kelsh RN. Sorting out Sox10 functions in neural crest development. Bioessays. 2006;28:788–798. doi: 10.1002/bies.20445. [DOI] [PubMed] [Google Scholar]
- Kimmel CB, Ballard WW, Kimmel SR, Ullmann B, Schilling TF. Stages of Embryonic Development of the Zebrafish. Developmental Dynamics. 1995;203:253–310. doi: 10.1002/aja.1002030302. [DOI] [PubMed] [Google Scholar]
- Kobayashi M, Osanai H, Kawakami K, Yamamoto M. Expression of three zebrafish Six4 genes in the cranial sensory placodes and the developing somites. Mechanisms of Development. 2000;98:151–155. doi: 10.1016/s0925-4773(00)00451-2. [DOI] [PubMed] [Google Scholar]
- Langille RM, Hall BK. Role of the neural crest in development of the cartilaginous cranial and visceral skeleton of the medaka, Oryzias latipes (Teleostei) Journal of Anatomy and Embryology. 1988;177:297–305. doi: 10.1007/BF00315836. [DOI] [PubMed] [Google Scholar]
- Le Douarin NM, Kalcheim C. The Neural Crest. Cambridge: Cambridge University Press; 1999. [Google Scholar]
- Le Douarin NM, Smith J. Development of the peripheral nervous system from the neural crest. Annual Reviews in Cell Biology. 1988;4:375–404. doi: 10.1146/annurev.cb.04.110188.002111. [DOI] [PubMed] [Google Scholar]
- Litsiou A, Hanson S, Streit A. A balance of FGF, BMP and WNT signalling positions the future placode territory in the head. Development. 2005;132:4051–4062. doi: 10.1242/dev.01964. [DOI] [PubMed] [Google Scholar]
- McLarren KW, Litsiou A, Streit A. DLX5 positions the neural crest and preplacode region at the border of the neural plate. Developmental Biology. 2003;259:34–47. doi: 10.1016/s0012-1606(03)00177-5. [DOI] [PubMed] [Google Scholar]
- Meulemans D, Bronner-Fraser M. Amphioxus and lamprey AP-2 genes: implications for neural crest evolution and migration patterns. Development. 2002;129:4953–4962. doi: 10.1242/dev.129.21.4953. [DOI] [PubMed] [Google Scholar]
- Nelms BL, Labosky PA. Transcriptional Control of Neural Crest Development. San Rafael, CA: Morgan & Claypool Life Sciences; 2010. [PubMed] [Google Scholar]
- Noden DM, Francis-West P. The differentiation and morphogenesis of craniofacial muscles. Developmental Dynamics. 2006;235:1194–1218. doi: 10.1002/dvdy.20697. [DOI] [PubMed] [Google Scholar]
- Northcutt RG. A reassessment of Goodrich’s model of cranial nerve phylogeny. Acta Anatomica. 1993;148:71–80. [PubMed] [Google Scholar]
- Northcutt RG. The origin of craniates: Neural crest, neurogenic placodes, and homeobox genes. Israel Journal of Zoology. 1996;42:S-273–S-313. [Google Scholar]
- Northcutt RG, Gans C. The genesis of neural crest and epidermal placodes: A reinterpretation of vertebrate origins. The Quarterly Review of Biology. 1983;58:1–28. doi: 10.1086/413055. [DOI] [PubMed] [Google Scholar]
- Osumi-Yamashita N, Ninomiya Y, Doi H, Eto K. The Contribution of both Forebrain and Midbrain Crest Cells to the Mesenchyme in the Frontonasal Mass of Mouse Embryos. Journal of Developmental Biology. 1994;164:409–419. doi: 10.1006/dbio.1994.1211. [DOI] [PubMed] [Google Scholar]
- Ovcharenko I, Loots GG, Giardine BM, Hou M, Ma J, Hardison RC, Stubbs L, Miller W. Mulan: multiple-sequence local alignment and visualization for studying function and evolution. Genome Research. 2005;15:185–194. doi: 10.1101/gr.3007205. [DOI] [PMC free article] [PubMed] [Google Scholar]
- Phillips BT, Kwon HJ, Melton C, Houghtaling P, Fritz A, Riley BB. Zebrafish msxB, msxC and msxE function together to refine the neural-nonneural border and regulate cranial placodes and neural crest development. Developmental Biology. 2006;294:376–390. doi: 10.1016/j.ydbio.2006.03.001. [DOI] [PubMed] [Google Scholar]
- Sahly I, Andermann P, Petit C. The zebrafish eya1 gene and its expression pattern during embryogenesis. Development, Genes and Evolution. 1999;209:399–410. doi: 10.1007/s004270050270. [DOI] [PubMed] [Google Scholar]
- Sato Y, Miyasaka N, Yoshihara Y. Mutually exclusive glomerular innervation by two distinct types of olfactory sensory neurons revealed in transgenic zebrafish. Journal of Neuroscience. 2005:25. doi: 10.1523/JNEUROSCI.0679-05.2005. [DOI] [PMC free article] [PubMed] [Google Scholar]
- Schlosser G. Induction and specification of cranial placodes. Developmental Biology. 2006 doi: 10.1016/j.ydbio.2006.03.009. [DOI] [PubMed] [Google Scholar]
- Schlosser G. Making Senses: Development of Vertebrate Cranal Placodes. Burlinton: Academic Press; 2010. pp. 129–234. [DOI] [PubMed] [Google Scholar]
- Schulte-Merker S. Looking at embryos. In: Nusslein-Volhard C, Dahm R, editors. Zebrafish. Oxford: Oxford University Press; 2002. [Google Scholar]
- Solomon KS, Fritz A. Concerted action of two dlx paralogs in sensory placode formation. Development. 2002;129:3127–3136. doi: 10.1242/dev.129.13.3127. [DOI] [PubMed] [Google Scholar]
- Thisse C, Thisse B, Schilling TF, Postlethwait JH. Structure of the zebrafish snail1 gene and its expression in wild-type, spadetail and no tail mutant embryos. Development. 1993;119:1203–1215. doi: 10.1242/dev.119.4.1203. [DOI] [PubMed] [Google Scholar]
- Torres M, Giraldez F. The development of the vertebrate inner ear. Mechanisms of Development. 1998;71:5–21. doi: 10.1016/s0925-4773(97)00155-x. [DOI] [PubMed] [Google Scholar]
- Vitebsky A, Reyes R, Sanderson MJ, Michel WC, Whitlock KE. Isolation and characterization of the laure olfactory behavioral mutant in the zebrafish Danio rerio. Developmental Dynamics. 2005;234:229–242. doi: 10.1002/dvdy.20530. [DOI] [PubMed] [Google Scholar]
- Wada N, Javidan Y, Nelson S, Carney TJ, Kelsh RN, Schilling TF. Hedgehog signaling is required for cranial neural crest morphogenesis and chondrogenesis at the midline in the zebrafish skull. Development. 2005;132:3977–3988. doi: 10.1242/dev.01943. [DOI] [PubMed] [Google Scholar]
- Westerfield M. THE ZEBRAFISH BOOK: A guide for the laboratory use of zebrafish (Danio rerio) Eugene: University of Oregon Press; 2007. [Google Scholar]
- Whitlock KE. A new model for olfactory placode development. Brain, Behavior and Evolution. 2004b;64:1–11. doi: 10.1159/000079742. [DOI] [PubMed] [Google Scholar]
- Whitlock KE. Development of the nervus terminalis: Origin and migration. Microscopy Research and Techniques. 2004c;65(1–2):2–12. doi: 10.1002/jemt.20094. [DOI] [PubMed] [Google Scholar]
- Whitlock KE, Smith KM, Kim H, Harden MR. A role for foxd3 and sox10 in the differentiation of gonadotropin-releasing hormone (GnRH) cells in the zebrafish, Danio rerio. Development. 2005;132:5491–5502. doi: 10.1242/dev.02158. [DOI] [PubMed] [Google Scholar]
- Whitlock KE, Westerfield M. The olfactory placode of the zebrafish form by convergence of cellular fields at the edge of the neural plate. Development. 2000;127:3645–3653. doi: 10.1242/dev.127.17.3645. [DOI] [PubMed] [Google Scholar]
- Whitlock KE, Wolf CD, Boyce ML. Gonadotropin-releasing hormone (GnRH) cells arise from cranial neural crest and adenohypophyseal regions of the neural plate in the zebrafish, danio rerio. Developmental Biology. 2003;257:140–152. doi: 10.1016/s0012-1606(03)00039-3. [DOI] [PubMed] [Google Scholar]
Associated Data
This section collects any data citations, data availability statements, or supplementary materials included in this article.
Supplementary Materials
S1. Alignment of 10kb blocks of sequence for the six4b gene in fishes. Information about the identity of the sequences used for each species and the sequence alignment of the aligned blocks that resulted in the identification of conserved elements are shown in (Figure 5).
S2. six4b:mCherry is expressed in the developing OP precursors during somitogenesis. Time lapse movie corresponding to images presented in Figure 6. Dorsal view, anterior is to the right,.
S3. sox10:EGFP expressing neural crest cells (green) migrate with six4b:mCherry olfactory placode precursors (red). Time lapse movie corresponding to images presented in Figure 7. Dorsal view, anterior is to the right,.
S4. Time lapse movie corresponding to images presented in Figure 7 showing only the sox10:EGFP expressing neural crest cells (green).