Abstract
VisANT is a Web-based workbench for the integrative analysis of biological networks with unique features such as exploratory navigation of interaction network and multi-scale visualization and inference with integrated hierarchical knowledge. It provides functionalities for convenient construction, visualization, and analysis of molecular and higher order networks based on functional (e.g., expression profiles, phylogenetic profiles) and physical (e.g., yeast two-hybrid, chromatin-immunoprecipitation and drug target) relations from either the Predictome database or user-defined data sets. Analysis capabilities include network structure analysis, overrepresentation analysis, expression enrichment analysis etc. Additionally, network can be saved, accessed, and shared online. VisANT is able to develop and display meta-networks for meta-nodes that are structural complexes or pathways or any kind of subnetworks. Further, VisANT supports a growing number of standard exchange formats and database referencing standards, e.g., PSI-MI, KGML, BioPAX, SBML(in progress) Multiple species are supported to the extent that interactions or associations are available (i.e., public datasets or Predictome database).
Keywords: interaction, network, meta-network, visualization, integration
VisANT is a software platform for visually building and analyzing networks of relations among and between biological entities. Network nodes can represent various levels of biological organization, including molecules and chemical compounds, complexes, pathways, and other functional modules. VisANT is supported by the Predictome database, which includes more than 1.2 million relations based on 100+ experimental and computational methods. Networks uncovered by VisANT can be easily saved online and thereby shared with the wider community.
VisANT is predicated on the desirability of accessing and integrating multiple methods for inferring and extending relations across multiple species, and accessing and using data in a way that is not limited by the existence of diverse nomenclatures. One of its intermediate goals is to simulate and test hypotheses about the behavior of a cell under changes in environmental conditions; a long range goal is to do the same for groups of cells and organs.
Because VisANT displays relations based on a number of different kinds of evidence, links between nodes are displayed in different ways, depending on whether they represent direct physical interactions (e.g., yeast two-hybrid experiments, chromosome immunoprecipitation, mass spectrometry), functional correlations (e.g., microarray perturbation data, phylogenetic profiles), causal relations, and so forth. Some of these are discussed below, others are in the online VisANT user’s manual http://www.visantnet.org/vmanual. VisANT also allows simultaneous searching of multiple genes and proteins for 112 species. Searchable terms include protein name, gene name, open reading frame (ORF) ID, Entrez gene ID, and KEGG pathway ID etc. It also supports special retrieval terms for specific species such as Online Mendelian Inheritance in Man (OMIM; UNIT 1.2) ID for Homo sapiens. Additional details are in the VisANT user’s manual.
The latest development of VisANT provides it new capabilities of translational sciences to convert our understanding of basic biological knowledge into effective ways to treat and prevent diseases (Hu et al. 2013). The first version of VisANT was released in early 2004 and supported exploratory navigation to walk through the interactions based on a few initial genes or proteins of interest (Hu et al. 2004); The second release implemented a primary version of metagraph as we realized the importance to integrate the context information (such as protein complex, functional modules etc.) into the network(Hu et al. 2005). This release also featured the unique topological analyses (e.g., exhaustive search of shortest paths between two nodes) that is dynamically linked to the network; The importance of the metagraph was quickly recognized by the community(Hu et al. 2007a) and in VisANT release 3(Hu et al. 2007b) & 3.5(Hu et al. 2009) it was successfully applied to achieve intuitive visualization of KEGG pathway and multi-scale network visual analysis & inference with integrated Gene Ontology (GO). In VisANT 3.5 we also implemented a sophisticated GO explorer to facilitate the visual navigation and application of GO hierarchy, which is renamed as Hierarchy Explorer in version 4.0 to reflect the addition of disease and therapy hierarchies (Hu et al. 2013).
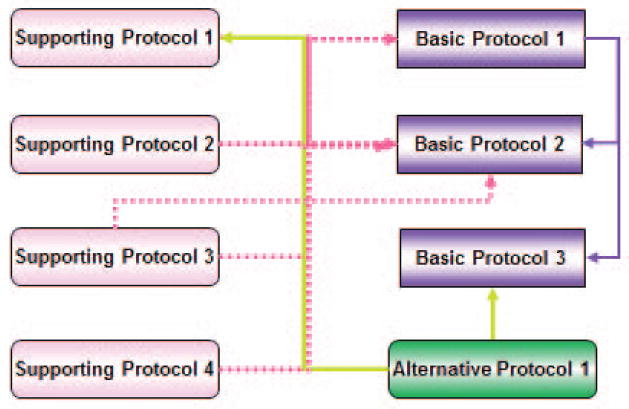
This unit is organized around a set of visual data-mining protocols, i.e., procedures for constructing, displaying, manipulating, and analyzing large numbers of relations (Fig. 8.8.1). The first method (see Basic Protocol 1) covers basic network construction, while its alternative (see Alternate Protocol) shows how to quickly build and combine large scale networks. Additionally, an introduction to integrative analysis and annotation of constructed networks is presented (see Basic Protocol 2). Integrative analysis of the networks of gene, drug, disease and therapy with an application in drug repositioning (see Basic Protocol 3). Finally, Support Protocol 1 describes analytical functions, such as those that enable characterization of network topology, Support Protocol 2 introduces online network saving and sharing, Support Protocol 3 illustrates how to change the visual properties of the network, and Support Protocol 4 demonstrate how to use macros to speed up repetitive or time-consuming tasks.
Figure 8.8.1.
Relationships between protocols. Protocols are colored by type, with the direction of the line indicating relationship—for example, the Alternate Protocol is used by Basic Protocol 3 and Support Protocol 1. To distinguish the relationships of the Support Protocols, dashed lines are used for Support Protocol 1.
BASIC PROTOCOL 1: BASIC NETWORK CONSTRUCTION
As an example of how relations are used to visualize and analyze complex networks, this discussion will focus on the network of interactions in which the Saccharomyces cerevisiae proteins STE3 and FUS1 are embedded.
Necessary Resources
Hardware
Any computer with Internet access
Software
Java compatible browser
Java Run-time Environment (JRE) 1.4 or above (see Internet Resources)
Files
None
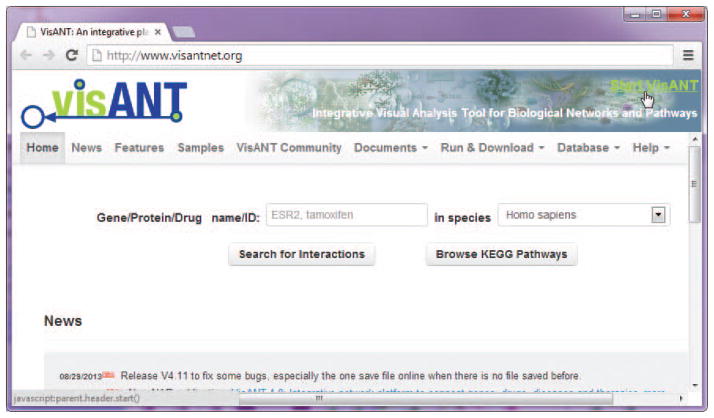
Start a Java-compatible browser and open the VisANT start page (http://www.visantnet.org, Fig. 8.8.2). Make sure that Javascript is enabled and follow the instructions in the VisANT user’s manual to install the required software (JRE).
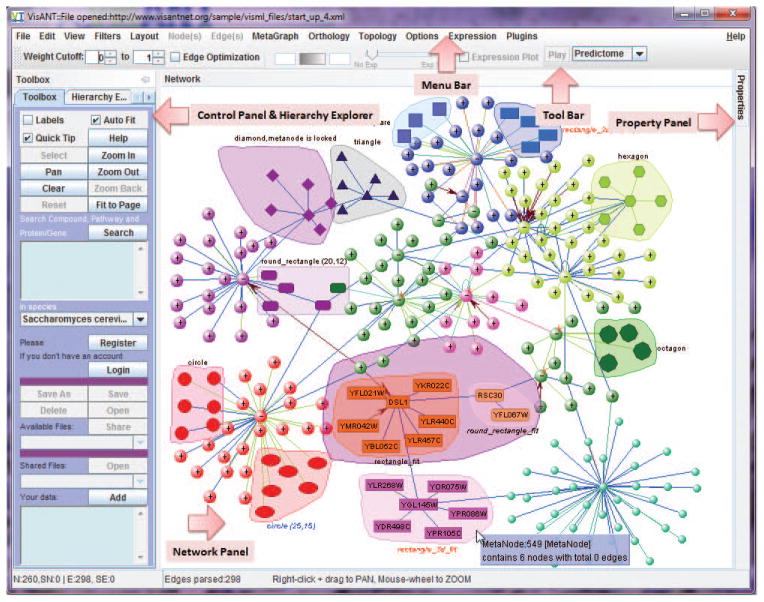
Click the Start button (up-right corner in Fig. 8.8.2), which will cause a VisANT window, having three main components, Menu Bar, Control Panel, and Network Panel (Fig. 8.8.3), to appear. Keep the web page open during all procedures. Alternatively, type in the gene/drag name.
Clear the network panel by clicking the Clear button in the control panel.
Select the genome to be analyzed, S. cerevisiae in this case, by scrolling through the In Species pulldown menu in the control panel.
-
Type FUS1 and STE3 in the Search Compound, Pathway & Protein/Gene Name box of the control panel.
The gene for most organisms are case insensitive, except some specific one such as Drosophila desulfuricans. VisANT by default will automatically handle this based on different organism, specific options are available for users to change it under the menu Options. The gene name shall be separated by space, or Tab, or “,”, e.g., Fus1, ste3 -
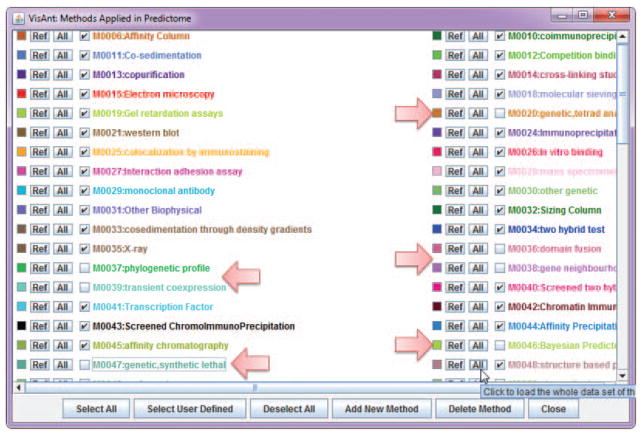
Open the View menu on the menu bar and click Methods Tables (Fig. 8.8.4). Close the methods table in the usual way (e.g., click “X” in upper right corner).
The Methods Table can also be accessed by right clicking on the network panel to invoke a pop-up menu.Notice that all methods are checked. This means that all associations stored in the Predictome database will be displayed. Throughout this discussion, when no method is specified, they are all invoked. -
Click the Clear button on the Control panel to clear the startup network.
The startup network serves as a configuration file in general when VisANT is not run as Web Applet -
Click the Search button to start the search, which will result in VisANT displaying all proteins to which the two seeds (FUS1 and STE3) are related (functionally or physically), where lines between the nodes (circles) represent associations (Fig. 8.8.5).
When a search term is found in the Predictome database, all related information as well as its binary interactions will be returned to VisANT and displayed, with the seed node (i.e., the search term) labeled. (Fig. 8.8.8).The initial display, especially when many genes are requested simultaneously, is likely to be cramped. Adjust the view as described in step 8. -
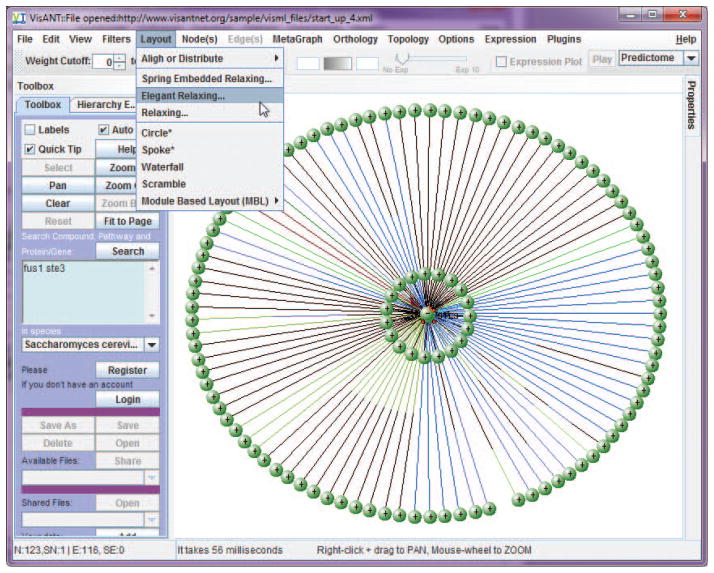
If necessary, present results more clearly by clicking Layout on the menu bar and selecting one of the network relaxation options (Fig. 8.8.5). Stop the animated layout process at any time by clicking the Stop Relaxing button.
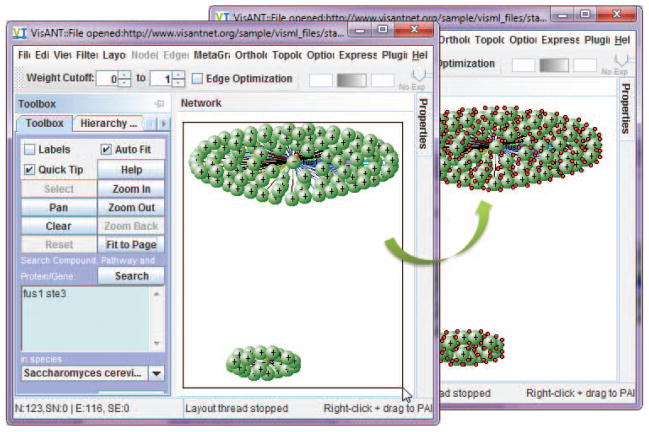
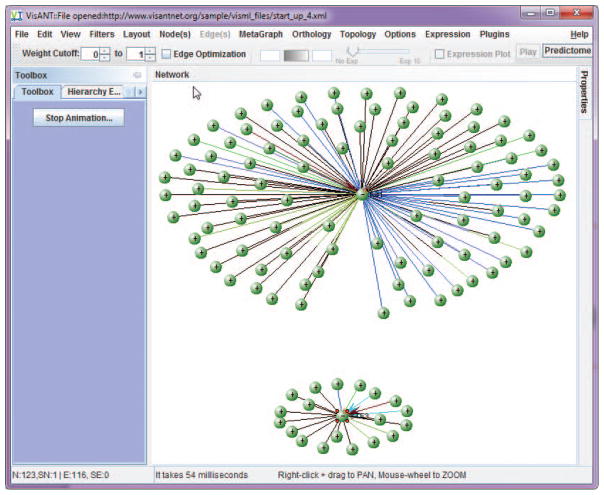
The layout options are designed to separate the nodes based on their connectivity. VisANT has implemented three spring-force based layout algorithms. Figure 8.8.6 shows characteristic layouts using each. The layout processes are animated and can be stopped at any time by clicking the stop relaxing button (Fig. 8.8.7).Note that Figure 8.8.7 clearly indicates that FUS1 and STE3 proteins do not interact directly. They may, however, interact indirectly. See steps 9 and 10 for information on how to find indirect links. To find indirect links, expand each node (i.e., find all nodes to which each node is linked) by dragging the mouse to draw a rectangle as shown in Figure 8.8.8. Select Query Selected from the Nodes menu in the menu bar to search the Predictome database for interacted nodes.
-
Click the Fit to Page button in the control panel once the queries have been completed. If desired, double click an individual node to expand it.
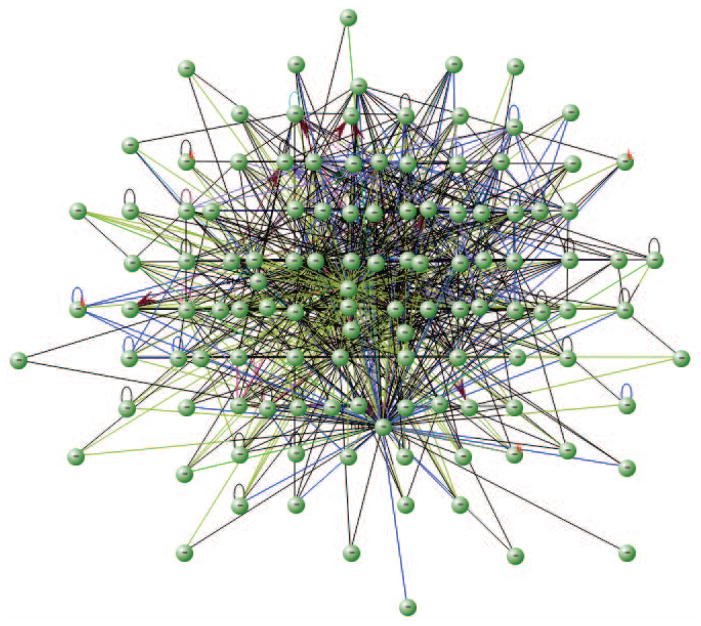
The expanded network is shown in Figure 8.8.9. Query represents the request to the Predictome database for interacted nodes and related information. Relax the network (step 9) and click Zoom Out (control panel) several times. Click the Fit To Page button to stretch the network and shrink the nodes.
-
Type STE3 and FUS1 in the Search Compound, Pathway & Protein/Gene box of the control panel. Click on Search to highlight these two proteins in the network panel, with the usual four dot signature on the periphery indicating they are selected.
Note that STE3 and FUS1 might still be difficult to identify at a very low level of magnification (Fig. 8.8.10). In such case, change the node size and color as shown Fig 8.8.10 (see Support Protocol 3 for details), -
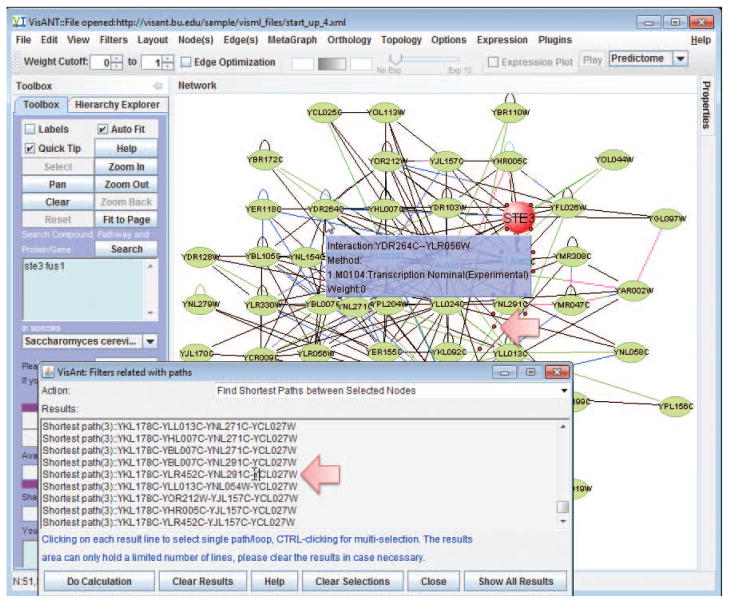
Determine if there is a path between STE3 and FUS1 by selecting Find Shortest Paths Between Selected Nodes under the Filters menu in the Menu bar (see Support Protocol 1 for details).
In this example, the results indicate that there are four shortest paths between STE3 and FUS1 (Fig. 8.8.11); connections between the two proteins are therefore verified.Note that the VisANT “tool-tip” can help identify nodes of interest by displaying information. For example, Fig 8.8.3 shows the mouse cursor pointing to the metanode. VisANT also allows users to add information to the tool-tip, as described (see Basic Protocol 2). However, the easiest method for determining paths is that described in the step above. -
Save the network as CPBI_1 online by clicking on the Save As button in the control panel.
See Support Protocol 2 for additional information about online network saving.
Figure 8.8.2.
The VisANT start page.
Figure 8.8.3.
VisANT main window.
Figure 8.8.4.
Methods table.
Figure 8.8.5.
Searching interactions of FUS1 and STE3 proteins. The circles represent genes or proteins, depending on the assay by which the relations were obtained; the connecting lines (links) represent relations established by the selected methods. The methods table can be viewed by clicking on the View menu in the menu bar. A minus sign (−) in the node indicates that the interaction has been expanded (i.e., all links are shown) while a plus symbol (+) indicates that links remain hidden.
Figure 8.8.8.
How to select all the nodes in the network panel. Note that selected nodes are clearly marked on the screen.
Figure 8.8.7.
The result after invoking a relaxation algorithm. In this case the Elegant Relaxation algorithm was used (see descriptions below).
Figure 8.8.9.
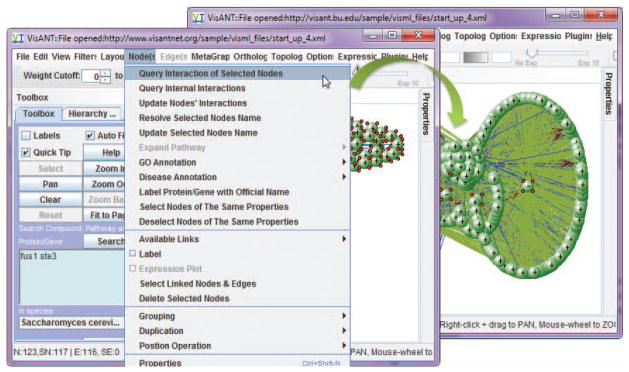
Querying the interactions of all the nodes in the network panel.
Figure 8.8.10.
A low resolution view of the network that contains STE3 and FUS1.
Figure 8.8.11.
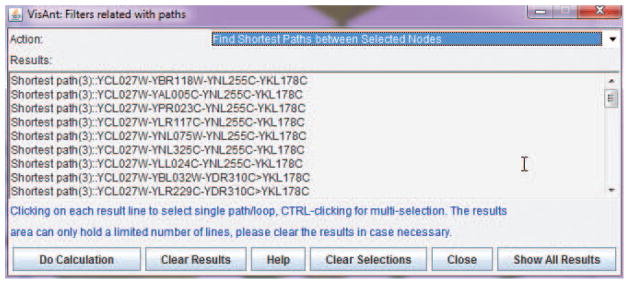
Shortest paths between STE3 and FUS1.
ALTERNATE PROTOCOL 1: CONSTRUCTING AND COMPARING LARGE-SCALE NETWORKS
To facilitate large scale analysis of interaction networks, VisANT enables method-based quick load of large interaction data sets. The following example illustrates the simultaneous use of physical protein-protein interaction (PPI) data based on yeast-two hybrid experiments (Uetz et al. 2000), and synthetic genetic array data (Tong et al. 2001) for S. cerevisae.
Necessary Resources
Hardware
Any computer with Internet access
Software
Java compatible browser
Java Run-time Environment (JRE) 1.4 or above (see Internet Resources)
Files
None
Select method
-
1
Start the browser, open the VisANT start page (http://www.visantnet.org), and click the start button as described (see Basic Protocol 1, steps 1 and 2).
Remember that the start page must be kept open during all procedures. -
2
Clear the network panel by clicking the Clear button in the control panel.
-
3
Invoke the Methods Table (see Basic Protocol 1, step 6), selecting method 34 (M0034; yeast two hybrid; Fig. 8.8.4). Click All to load all interactions obtained by this method.
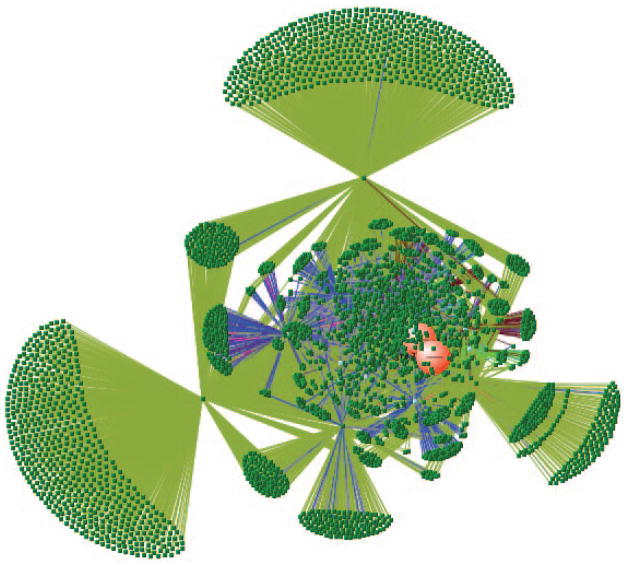
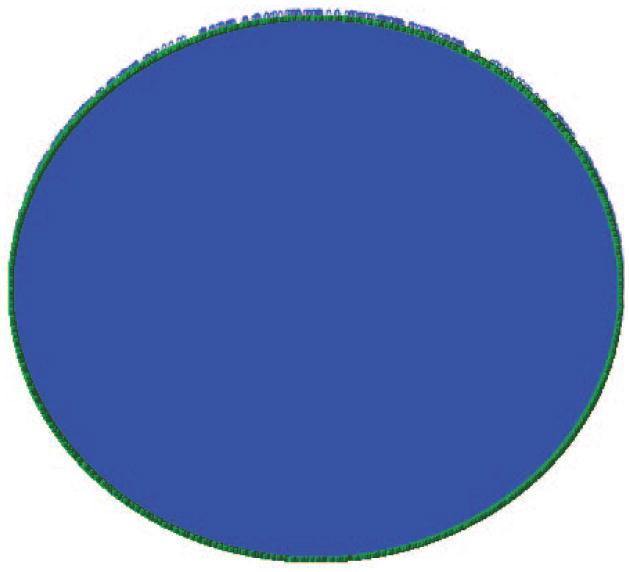
Figure 8.8.12 shows the interactions laid out with the circular layout algorithm. The dense field of blue results from the large number of connections between nodes. The green around the periphery are nodes which in this view are too small to resolve, and the jagged blue edge results from self correlated nodes. The Ref button of method 34 can be used to access references for individual interactions. The references can also be accessed by the Edge/Available Links menu for individual edges. -
4
Click on all of method M0047 to load synthetic genetic array data.
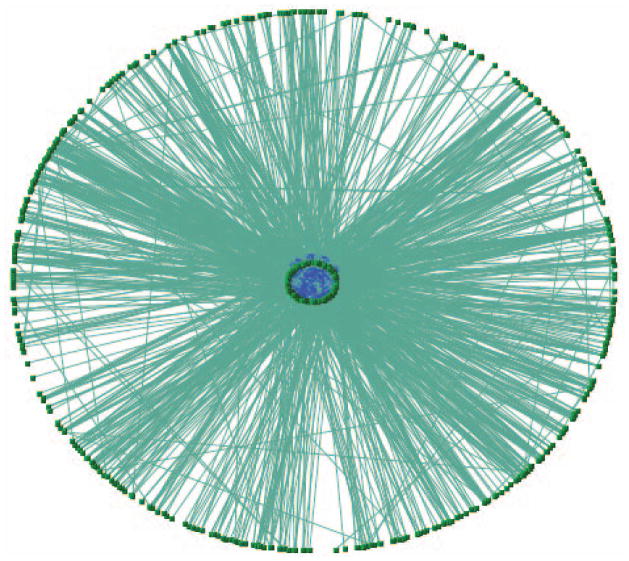
The combined network is shown in Figure 8.8.13. -
5
Ensure that pop-up blocking functions, such as those invoked by Google Toolbar, are turned off. Invoke Statistics Report under the View menu in the menu bar (Fig. 8.8.3), which will cause a new browser window to appear as shown in Figure 8.8.14.
Figure 8.8.14 shows that there is a few of intersection between the two networks. In particular there are 491 overlaps (the edges associated with both methods) between 13564 genetic and 18789 physical interactions.
Figure 8.8.12.
PPI network (yeast two hybrid) of S. cerevisiae.
Figure 8.8.13.
Combined network of PPI (blue region) and genetic network (green) for S. cerevisiae.
Figure 8.8.14.
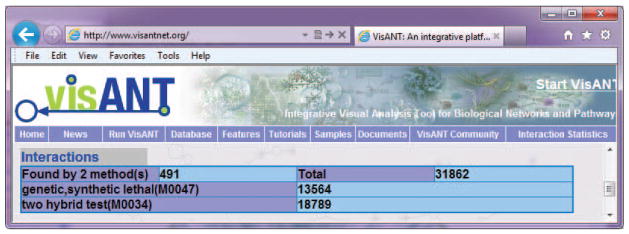
Status report of the combined network
Determine common nodes
-
6
Invoke Select N(odes)&E(dges) With Edge Discovered By Multiple Methods under menu Filters in the menu bar, which will cause the common edges to be selected.
-
7
Invoke Invert Selection under the Edit menu in the menu bar, which will cause the selection to become reversed so that nodes and edges that are not identified by both methods will be selected.
-
8
Invoke Delete Selected Node and Delete Selected Edges respectively under the View menu to remove all nodes and edges that are not common to the two networks. Layout the network by invoking the menu Layout/Spring Embedded Layout
-
9
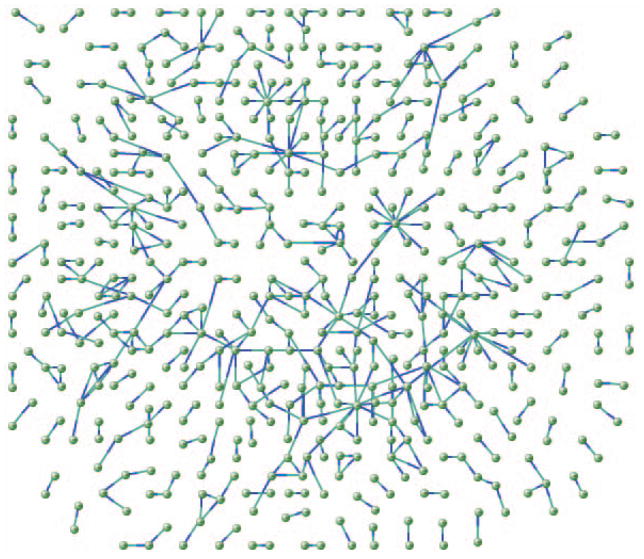
Click the Zoom Out and then Reset buttons in the control panel to restore the remaining nodes to their original size. Click button Zoom Out to zoom out the network and the click the Fit to Page button so that the edges are clearly visible similar to Figure 8.8.15.
All edges in Figure 8.8.15 are shown in two colors, indicating that they are identified by two different methods.
Figure 8.8.15.
The intersection of the combined network. Each edge is labeled with two colors, indicating that the association is obtained by two methods. This black and white facsimile of the figure is intended only as a placeholder; for full-color version of figure go to http://www.interscience.wiley.com/c_p/colorfigures.htm.
SUPPORT PROTOCOL 1: QUANTITATIVE CHARACTERISTICS OF NETWORK TOPOLOGIES
Biological networks typically consist of one or more significantly overrepresented motifs. For example, feed-forward loops are common in yeast and E. coli. At present, VisANT identifies feed-forward motifs, cycles (feedback) and self-loops. In addition, options are available for compiling statistics on various network characteristics including shortest paths between nodes, number of links per node (degree distribution), and the average path length between nodes. The following protocols demonstrate VisANT functions related to transcription factor/target networks.
Necessary Resources
Hardware
Any computer with Internet access
Software
Java compatible browser
Java Run-time Environment (JRE) 1.4 or above (see Internet Resources)
Files
None
-
1
Start the browser, open the VisANT start page (http://www.visantnet.org), and click the start button as described (see Basic Protocol 1, steps 1 and 2).
Remember that the start page must be kept open during all procedures.
Display distribution of edges per node
-
2
Load transcription factor-target pairs determined by chromatin immunoprecipitation (ChIP; Lee et al., 2002) using the same procedure as described for yeast two hybrid (see Alternate Protocol, steps 2 and 3), except substituting method 42 (M0042) for method 34 (Fig. 8.8.4).
-
3
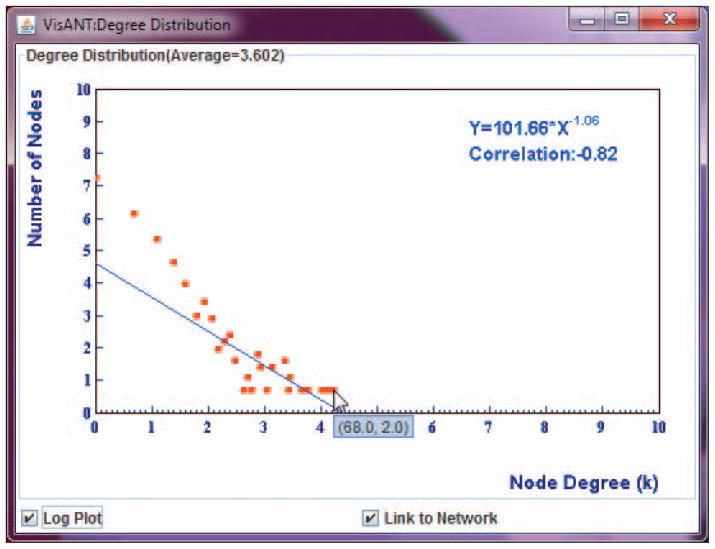
View the degree distribution of the network by invoking Degree Distribution under the Topology/Global Statistics menu in the menu bar, which will cause a window showing the distribution to appear (Fig. 8.8.16). Make sure Log Plot is checked.
The number of edges per node is measured along the horizontal axis, while the corresponding number of nodes is measured along the vertical axis. The equation at the upper right is the power law that best fits the observations.The Link to Network option shown in Fig. 8.8.16 allows users to conveniently select the nodes with a given degree or a given range of degrees in the network by select the nodes in the degree plot. In this way, network hubs can be easily detected.
Figure 8.8.16.
Degree distribution of regulatory network (ChIP).
Cycle detection
-
4
Close the Degree Distribution window.
-
5
Ensure there is no selected node in Network Panel, as otherwise VisANT will only show the detected cycles that include at least one selected node. To deselect nodes, click on any empty position in the network panel.
-
6
Invoke Find Cycles (i.e., feedback loops) under Filters in the menu bar (Fig. 8.8.3), which will cause a cycle with three nodes to be selected.
A cycle is defined as a closed unidirectional path of the network. Here, the unidirectional path only requires that each edge of the path has the corresponding direction of the cycle, which means that if an edge is bidirectional, then this edge can always be in the cycle. VisANT supports hybrid networks, which can either be directional or directionless, and a directionless edge is treated as bidirectional when performing topological analysis. -
7
To isolate the cycle, first reverse the selection by invoking Reverse Selection under Edit in the menu bar and then invoking Remove Selected under Nodes in the menu bar to remove the selected nodes.
-
8
Click Zoom Out in the control panel and then click the Reset button to restore nodes to normal size. Turn the label on and perform a layout of Spring Embedded Relax to obtain the cycle as shown in Fig. 8.8.17.
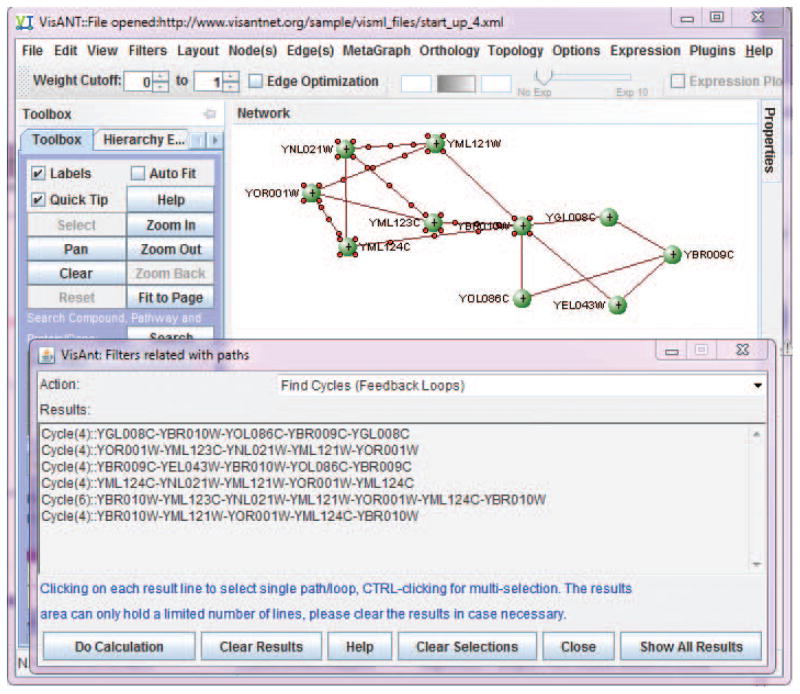
There are total of 6 feedback cycle using the updated data from Lee et al. (2002). Click the line of each cycle shown in the result window will select corresponding cycle in the network panel, as shown in Fig. 8.8.17.
Figure 8.8.17.
Feedback loop retrieved from a complex transcription-factor/target network.
Shortest paths
-
9
Clear the network panel.
-
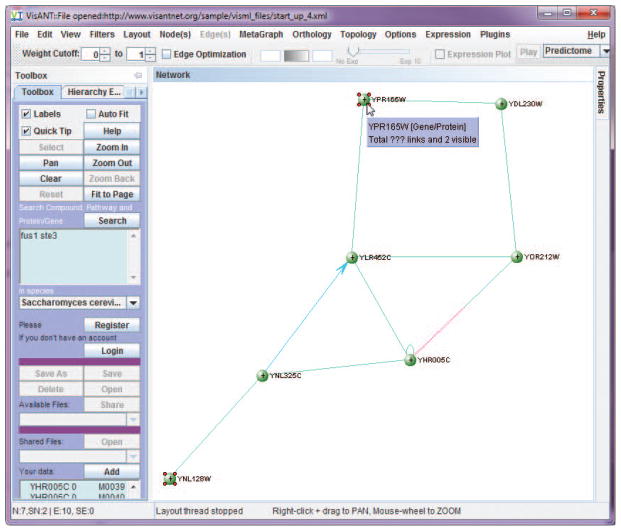
10Add the following lines into the Your Data text field in the control panel (Fig. 8.8.3), using tabs to separate each component and a hard return to complete each line (i.e., tab-delimited format):
YNL325C YLR452C 1 M0041 YOR212W YDL230W 0 M0039 YNL325C YHR005C 0 M0039 YNL325C YNL128W 0 M0039 YOR212W YLR452C 0 M0039 YLR452C YHR005C 0 M0039 YPR165W YDL230W 0 M0039 YPR165W YLR452C 0 M0039 YOR212W YHR005C 0 M0039 YOR212W YHR005C 0 M0040 YHR005C YHR005C 0 M0039 Each line represents a binary interaction between node 1 (first column) and node 2 (second column). The integer in the third column represents the direction of the interaction, i.e., 0 signifies an undirected link, 1 indicates that the link has a direction from node 1 to node 2, and –1 indicates that the link has a reverse direction from node 1 to node 2. (There are many different types of directions indicating different types of biological relationship; refer to the VisANT user manual for more detail.) The last column represents the associated method (method ID) of this interaction. For example, in the first line given above, node 1 is YNL325C, node 2 is YLR452C, the direction is 1, and the method ID is M0041. Therefore, YNL325C binds YLR452C, because M0041 represents gene regulation.The method ID represents the method used to uncover the interaction/association, and allows the biological interpretation of the edge (interaction/association). For example, a directed edge from node 1 to node 2 with method ID of M0039 can be interpreted as node 1 activates node 2, because M0039 represents gene expression. On the other hand, the same edge can be interpreted as indicating that the protein of node 1 binds the gene of node 2 (i.e., node 1 is a transcription factor of node 2) if the method is M0041, because M0041 represents the transcription factors of gene regulation from TRANSFAC database (http://www.gene-regulation.com).Note that columns 3 and 4 are optional. The default value of the direction is0 and the default method ID is M9999, which indicates that the method is unknown. -
11
Click the Add button to display the network data. Invoke Spring Embedded Relaxing…under the Layout menu to make the network similar to the one shown in Figure 8.8.18. Check Labels and deselect all nodes by clicking on any empty location in the network panel.
-
12
Select the nodes YNL128W and YPR165W by holding down the control key and clicking on them.
-
13Invoke Find Shortest Paths under menu Topology/Shortest Path to obtain the following paths.
Shortest path(3)::YNL128W-YNL325C>YLR452C-YPR165W
Shortest path(4)::YPR165W-YLR452C-YHR005C-YNL325C-YNL128W
Because the edge from YNL325C to YLR452C is directional, the shortest path from YNL128W to YPR165W is not same as the one from YPR165W toYNL128W. If more than two nodes are selected, VisANT will exhaustively search for the shortest paths between all pairs.
Figure 8.8.18.
An example of shortest path detection.
SUPPORT PROTOCOL 2: ONLINE SAVING AND READING OF THE NETWORK
VisANT provides online saving, reading, and sharing functions. Data security necessitates registration by researchers wishing to use these capabilities; however, the only required information for registration is an email address. The registration can be started by clicking the Register button in the control panel or by visiting following http://www.visantnet.org/vserver/register.jsp.
Additional information can be found in the VisANT user manual http://www.visantnet.org/vmanual. VisANT can also run as a local application, or start through Java Web Start, that enable users to save the network file to a local disk. Please reference http://visantnet.org/running2.htm for more information.
Necessary Resources
Hardware
Any computer with Internet access
Software
Java compatible browser
Java Run-time Environment (JRE) 1.4 or above (see Internet Resources)
Files
None
Clear the network panel, change species to Homo sapiens, and search for P53 without deselecting any methods (see Basic Protocol 1, steps 1 to 4). Select and query all nodes in the network panel (see Basic Protocol 1, steps 9 to 11).
Login to VisANT by clicking the Login button in the control panel.
-
Click the Save As button in the control panel to save the network using the file name CPBI_2, which will cause the file to be saved to the VisANT application server through the network with CPBI_2 listed in the Available Files drop-down list in the control panel.
The file is stored in the VisANT application server. Storage is limited to ten files per user. All the information, including customized annotation, is stored in the file. If files have been saved previously, they will be shown in the drop-down list named Available Files in the control panel. -
Share a network file. Select CPBI_2 from the Available Files drop-down list and click the Share button. In the first text box in the window, enter the email addresses of the users with whom the file is to be shared: in this example, the user’s own. Click the OK button.
A network must be saved before it can be shared with other users. The network can be shared with any users, irrespective of whether they are registered with VisANT. Please refer to the VisANT user’s manual for more information. Open the file that has been shared. Log out VisANT by clicking the Logout button in the control panel and then log in again. Note the emailed file is shown in the drop-down list named Shared Files in the control panel (Fig. 8.8.3).
-
Select the file from the drop-down list and click the Open button just above it to open the shared file.
Once the shared file is opened, it will no long appear in the list of Shared Files and will be deleted upon logging out unless it is saved.
SUPPORT PROTOCOL 3: CUSTOMIZE VISUAL PROPERTIES OF THE NETWORK
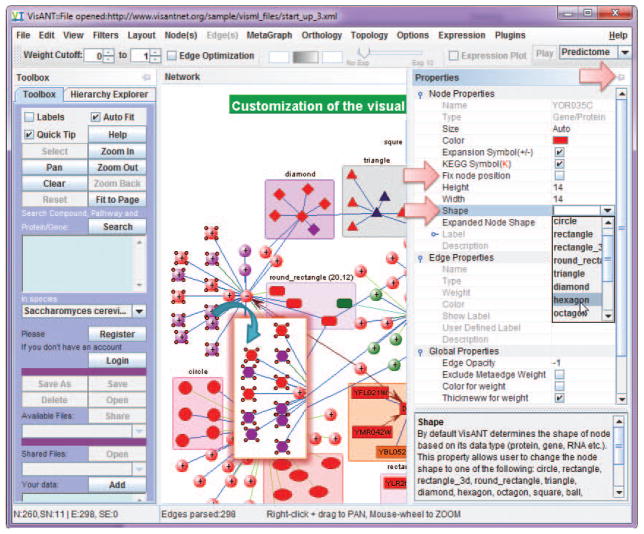
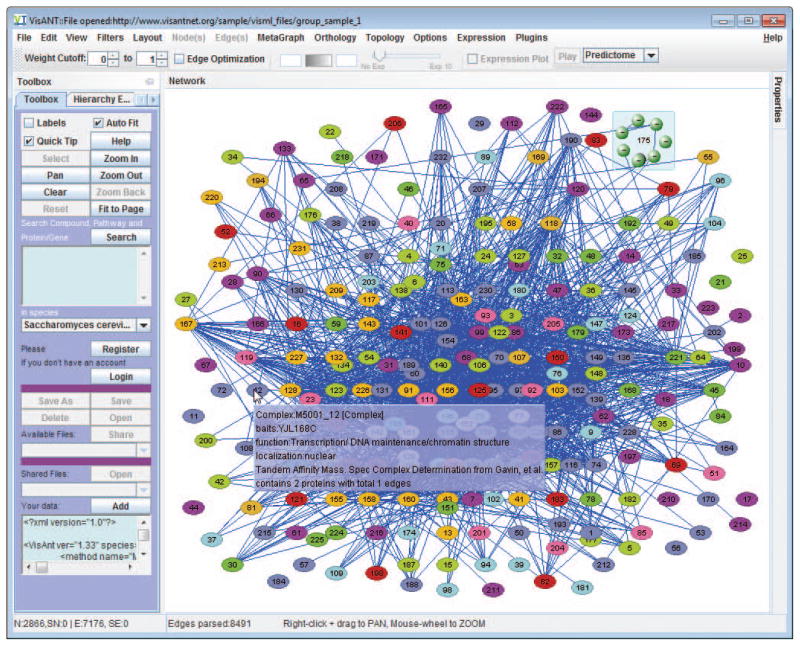
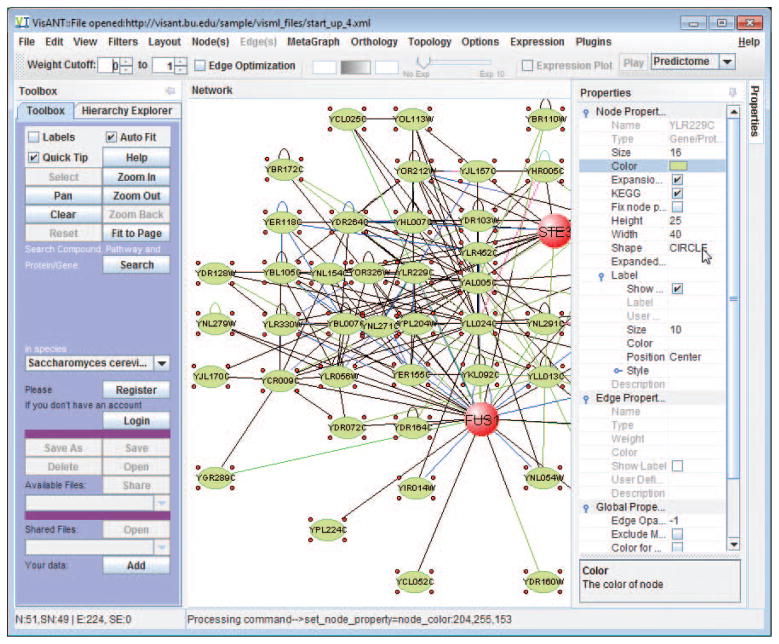
VisANT provides convenient functions to allow user to customize the visual properties of the network. Most of the customizations are carried out by the Properties docking window as shown in Fig. 8.8.3 & Fig. 8.8.19, in the style of spread sheet with common user convention to make it easier to use. When node(s)/edge(s) are selected, all corresponding properties are editable except those grayed ones. Properties are grouped and these groups can be collapsed/expanded. As shown in Fig. 8.8.19, Edge properties and global properties are collapsed while node properties are expanded in which properties of node label are however collapsed. The column width can be changed in case the name of property is too long. Clicking on each property row will also display the detailed explanation as shown for node shape in Fig. 8.8.19.
Figure 8.8.19.
Customization of network property in VisANT.
Necessary Resources
Hardware
Any computer with Internet access
Software
Java compatible browser
Java Run-time Environment (JRE) 1.4 or above (see Internet Resources)
Files
http://www.visantnet.org/sample/visml_files/start_up_3.xml
http://www.visantnet.org/sample/visml_files/gavin_complex_y2h.xml
http://www.visantnet.org/sample/macro/node_edge_prop.txt
-
Load the network from VisANT web server by opening the following URL through the menu Files/Open URL:
Click on the Properties button on right side bar (Fig. 8.8.3) to make Properties panel visible, click on the small Pin button on the upper-right corner (Fig. 8.8.19) to dock the Properties panel.
Use mouse to drag the left side of the Properties panel to change its width. The Properties of nodes and edges, as well as those from plugins, are organized as a table of name value pairs. Change the width of the column of the property name to make it looks similar to Fig. 8.8.19.
-
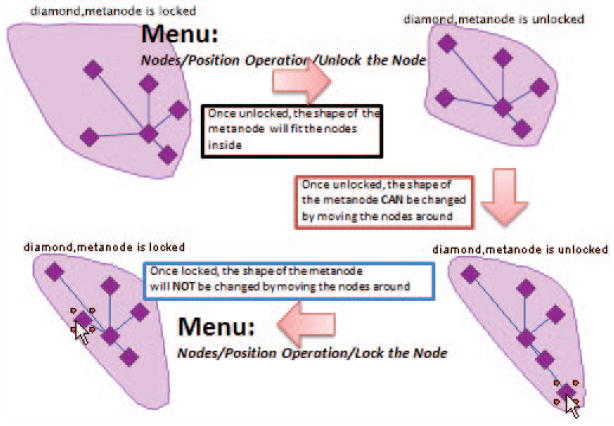
Click on the metanode node labeled “diamond” as shown in Fig. 8.8.19, and change its Expanded Shape as the Convex polygon, Move the embedded nodes around to make the metanode looks similar to the one shown in Fig. 8.8.20. Lock the shape of metanode by select the checkbox of the property Fix node position as shown in Fig. 8.8.19.
When a metanode position is locked, its expanded shape will also be locked and nodes inside the metanode will not be able to be moved out of the fixed polygon; and once unlocked, the shape will fit the nodes inside, and can be changed by moving the nodes around, as shown in Fig. 8.8.20.Although the locked node can not be moved around, its position can be changed when the whole network is panned. Such behavior of the expanded metanode is designed to allow it to model the cellular compartment. The information of the cellular compartment may easily be obtained by drag & drop operation of the tree nodes of the Gene Ontology (GO) hierarchy from the Hierarchy Explorer, and related functions have been detailed in our publication: VisANT 3.5: multi-scale network visualization, analysis and inference based on the gene ontology (Hu et al. 2009). -
Load the network of protein complex with integrated interactions derived by large-scale two-hybrid assays from following URL, as shown in Fig. 8.8.21:http://www.visantnet.org/sample/visml_files/gavin_complex_y2h.xml
Alternatively, users can copy/paste the content of the file shown in above link to the Add text box as shown in Fig. 8.8.21. In fact, VisANT identifies the file type based on its content; therefore any data in the format supported by VisANT can be loaded by copy/paste to the Add textbox. -
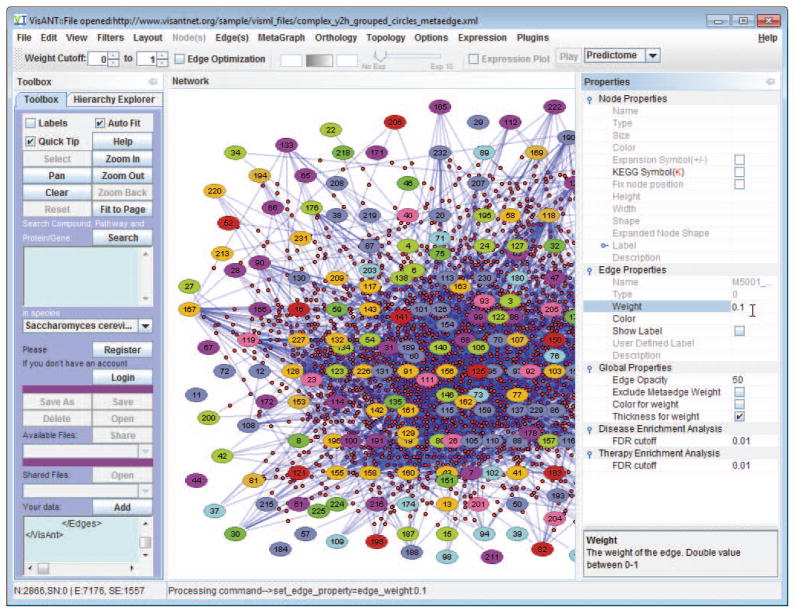
Select all the edges using menu Edit/Select All Edges, and set the edge weigh as 0.1 at the Properties panel.
Make sure the global option Thickness for weight is selected on the Properties panel and the option Fine Arts is selected under menu Options. Given two options, edges with be thinker in proportion to their weights (ranging from 0–1) The labels of the nodes become hard to read in the network after above step, which can be addressed by changing the global property Edge Opacity to 50 as shown in Fig. 8.8.22.
-
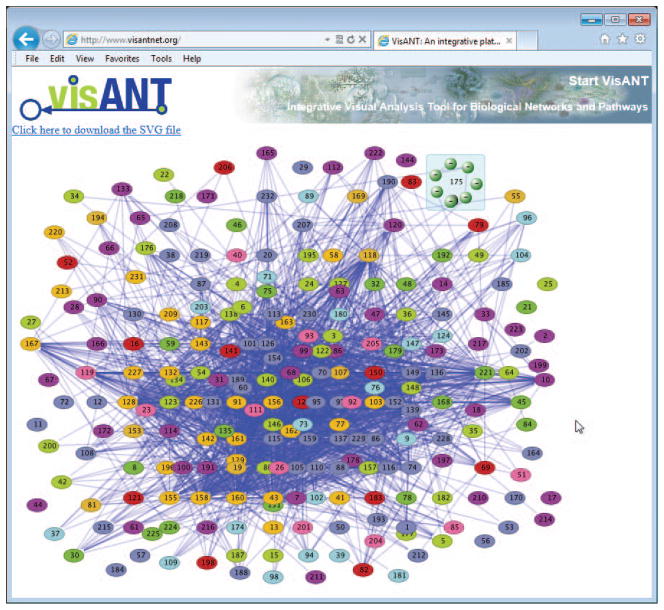
Export the network as SVG (Scalable Vector Graph) using the menu Files/Export As SVG File. The SVG file will appear in VisANT page (Fig. 8.8.23) with links to the save the SVG file to local disk.
SVG is an XML-based vector image format that provides high-quality pictures. SVG file can further processed by other software tools such as Adobe Illustrator. SVG is also supported by all major modern web browsers—including Mozilla Firefox, Internet Explorer 9 and 10, Google Chrome, Opera, and Safari. -
Open the file of following URL similar to step 1 and 5 to check the illustration of node and edge visual customization that are available in VisANT.
http://www.visantnet.org/sample/macro/node_edge_prop.txt
The file in above link is a macro file which lists the commands that will be carried out one by one in VisANT. The detail of macro file can be found in Support Protocol 4.
Figure 8.8.20.
Illustration of locked metanode with convex polygon as expanded shape for the potential modeling of cellular compartment.
Figure 8.8.21.
Network of protein complex with integrated interactions derived by large-scale two-hybrid assays.
Figure 8.8.22.
Illustration of edge customization (line thickness and opacity).
Figure 8.8.23.
Network of protein complex after edge customization. Nodes are more distinguished in comparison to Fig. 8.8.21
SUPPORT PROTOCOL 4: BATCH MODE AND MACROS
The batch-mode of the VisANT makes it possible for VisANT to run quietly in the background without any user interaction. When VisANT is started in this mode, it will carry out a list of the processes specified in the command file (simply a text file). Although not required, it is suggested that the first line of a command file to be started with “#!batch commands”. The batch mode must be started using command line such as:
java -Xmx512M -Djava.awt.headless=true -jar VisAnt.jar -b res/batch_cmd.txt
“-Djava.awt.headless=true” must be presented; “-b” tells VisANT to run in the batch mode, “res/batch_cmd.txt” specifies the command file; and -Xmx specifies the maximum size of the memory that java can use (512M memory in this example).
All command files can also be directly loaded into VisANT as macros. A macro file is identified by VisANT if the first line of the file starts with #!batch commands.
In general, batch mode or macro file allows VisANT to 1) automate repetitive processes; 2) handle time-consuming tasks with much better performance; 3) run VisANT on the super/cluster computer; 4) can handle large network with millions of nodes and edges.
Necessary Resources
Hardware
Any computer with Internet access
Software
Java compatible browser
Java Run-time Environment (JRE) 1.4 or above (see Internet Resources)
Files
http://www.visantnet.org/misi/cmd_line.zip
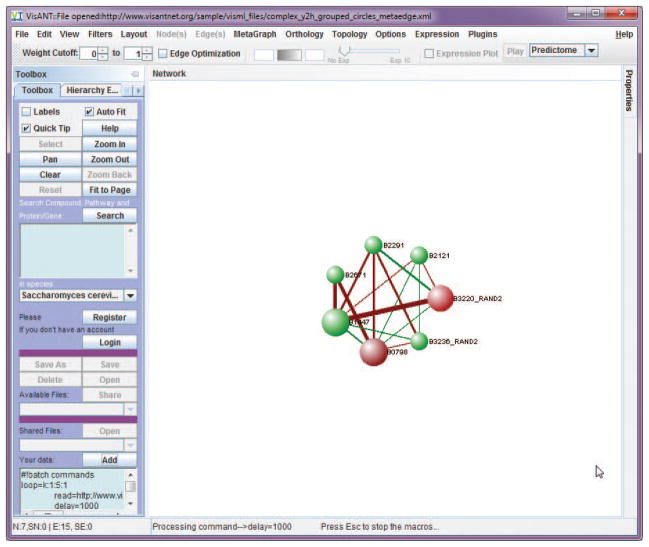
-
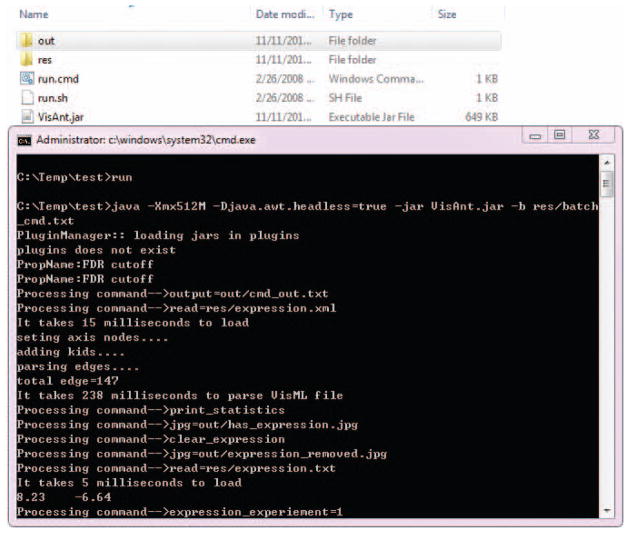
Download the file from above link and unzip the files to a local directory such as c:\temp\test, as shown in Fig. 8.8.24.
The zip file contains a copy of VisANT for user’s convenience and the subdirectory out shown in Fig. 8.8.24 is empty. The batch file batch_cmd.txt is located under res subdirectory that also contains a list of files that is required for this example. -
Open a DOS or SHELL window, and go the directory where the files are unzipped (c:\temp\test). Type “run” as shown in Fig. 8.8.24 to start the batch process.
The file batch_cmd.txt has a lot of comments (starts with “#”) to explains the batch commends used in the file. The complete list of these commands can be found at: http://www.visantnet.org/vmanual/cmd.htm -
Start the browser, open the VisANT start page (http://www.visantnet.org), and click the start button as described (see Basic Protocol 1, steps 1 and 2). Copy/paste following line into the Add textbox and click the button Add as shown in Fig. 8.8.25.
 #!batch commands
 loop=k:1:5:1
   read=

http://www.visantnet.org/other_formats/gml_test#k#.txt

   delay=1000
 loop_end
Above macros use loops to read 5 GML files from VisANT web server for animation purpose.The batch commands are often called macros when they are carried out with VisANT user interface.
Figure 8.8.24.
Illustration of the batch mode
Figure 8.8.25.
Illustration of using macros to animate the network
BASIC PROTOCOL 2: ANALYZING THE BIOLOGICAL NETWORK
Here the network utilized above (see Basic Protocol 1) is again processed, but this time it is pruned by using physical links only.
Necessary Resources
Hardware
Any computer with Internet access
Software
Java compatible browser
Java Run-time Environment (JRE) 1.4 or above (see Internet Resources)
-
1
Repeat step 1–3 in Basic Protocol 1 to start VisANT
-
2
Filter out computational and genetic interactions by clicking on (and therefore removing) the checks in the Methods Table (Fig. 8.8.4) for methods M0020, M0036, M0037, M0038, M0039, M0046, M0047 and M0054-M0059. Close the method table.
Methods M0020, M0047 and M0055-M0059 represent edges of genetic association based on knockout experiments. Methods M0036, M0037, M0038, M0039, and M0046 represent those edges of functional association predicted computationally. -
3
Repeat step 4–8 in Basic Protocol 1 to query interactions between ste3 and fus1.
-
4
Query all the interactions between nodes shown in the screen by selecting all the nodes and invoking the Query Internal Interactions of Selected Nodes under the Nodes in the menu bar. Layout the network by invoking the Spring Embedded Relaxing… under the Layout in the menu bar.
The resulting network will look similar to the one shown in Fig. 8.8.26.
Figure 8.8.26.
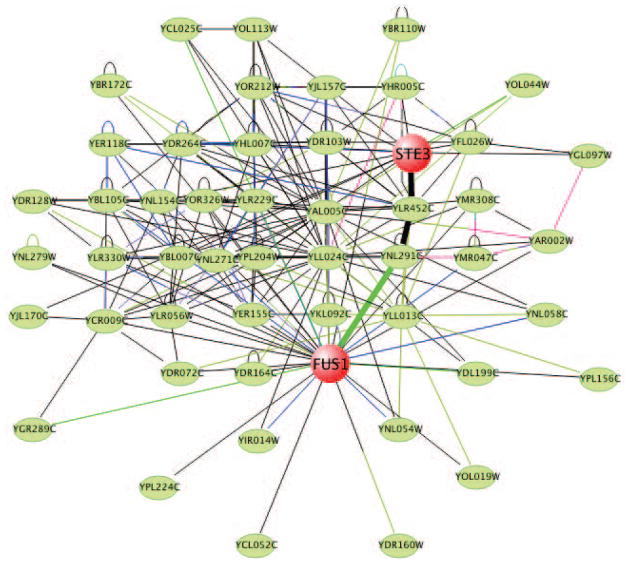
The network of physical interactions within which STE3 and FUS1 are embedded.
Filtering the network based on functional annotations
-
5
Turn on the node label by checking the Labels checkbox in the control panel.
-
6
Delete all invisible nodes by invoking the menu Edit/Delete Invisible Nodes.
When query the internal interactions between selected nodes, all the interactions of the selected nodes are queried, but those nodes are not on the existing network are made invisible. -
7
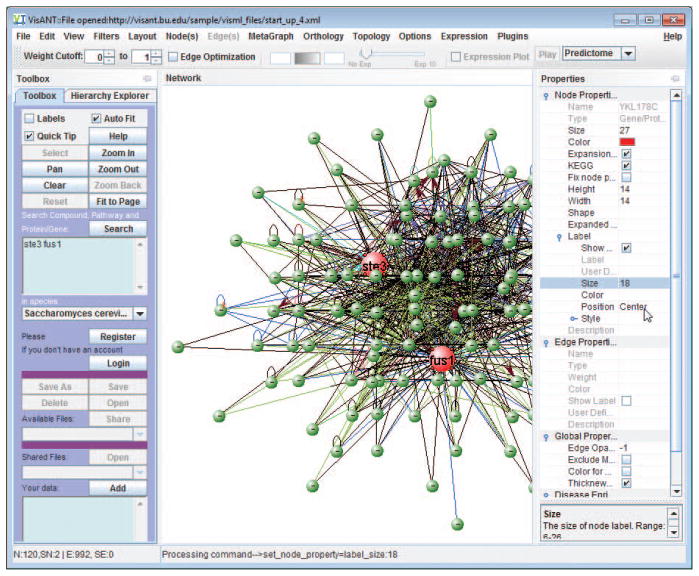
Select both FUS1 and STE3 by clicking the Search button, and invoke the node property window by selecting Properties under the Nodes menu. Change node Size to 30, node Label Size to 18, node Color to red, and change the label Position to Center (Fig. 8.8.27).
Once a node’s properties are specified, they will not change even if there is the global change of the network, such as zoom in/out. -
8
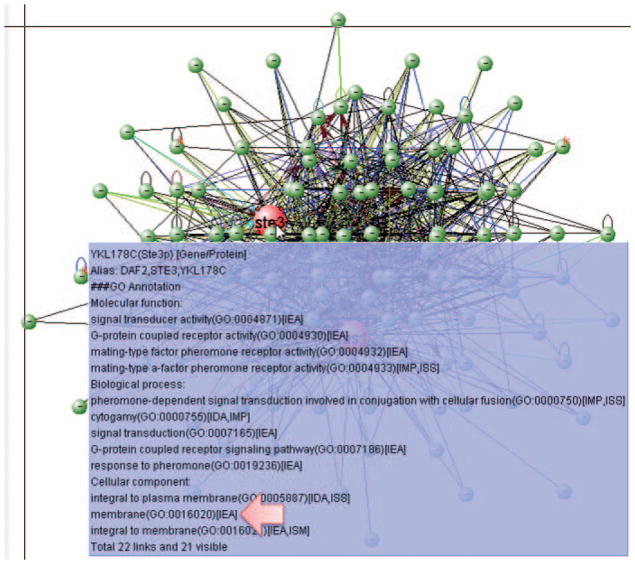
Make sure both FUS1 and STE3 are selected, annotate both genes using Gene Ontology (GO) terms by invoking menu Nodes/GO Annotation/Using Most Specific GO Terms.
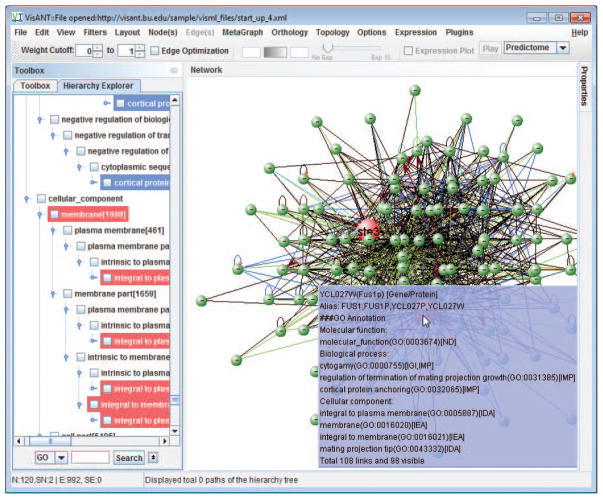
Mouse over node FUS1 and STE3, it can be found that both genes are membrane genes (Fig. 8.8.28). -
9
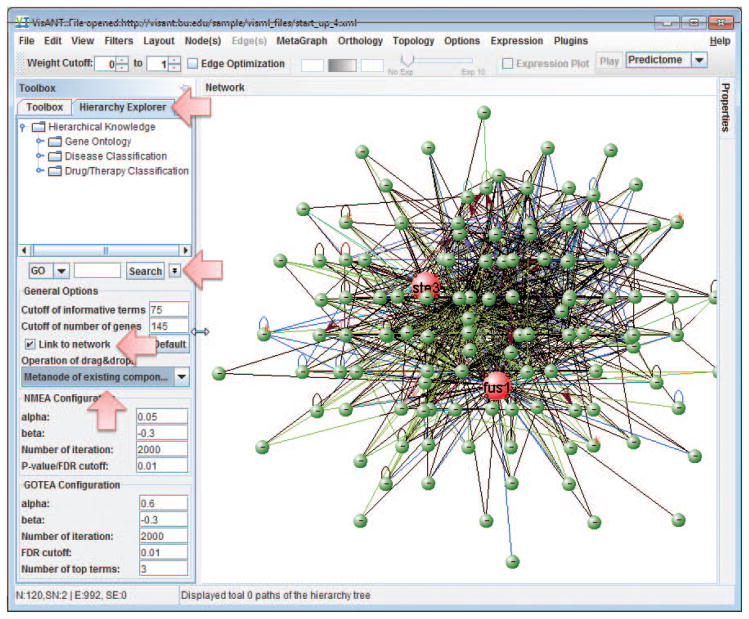
Click the Hierarchy Explorer (Fig. 8.8.29) to invoke the explorer of the hierarchy knowledge, including GO, disease classification and drug classification. Click the small arrow button (Fig. 8.8.29) to change the configuration: 1) make sure that Link to network (Fig. 8.8.29) is selected; 2) The Operation for drag&drop is Metanode of existing components (Fig. 8.8.29).
The option Link to network allows VisANT to connect the annotation of the node in the network to the corresponding knowledge in Hierarchy Explorer when the node is clicked. Although the auto-navigation runs in another thread, it is advised to uncheck the option to have better performance. -
10
Click the small arrow button to hide the configuration panel.
-
11
Click the node FUS1, the corresponding hierarchy of the GO annotations will be highlighted in Hierarchy Explorer, as shown in Fig, 8.8.30.
-
12
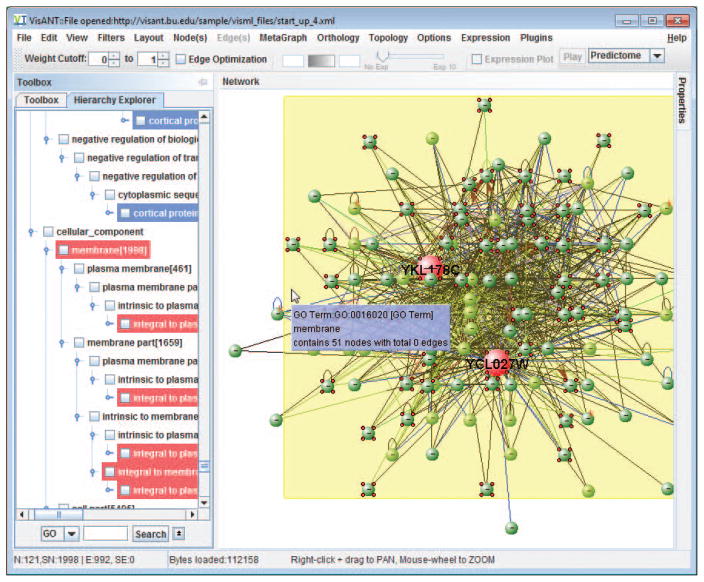
Because both FUS1 and STE3 are membrane genes, we therefore focus on membrane genes only. To achieve this, drag&drop the GO term Membrane to the network, a metanode will be created as shown in Fig. 8.8.31, with all nodes annotated under the GO term embedded in the metanode.
-
13
Double-click the metanode to collapse it, and select all nodes except the metanode by invoking the menu Edit/Invert Node Selection, as shown in Fig, 8.8.32.
-
14
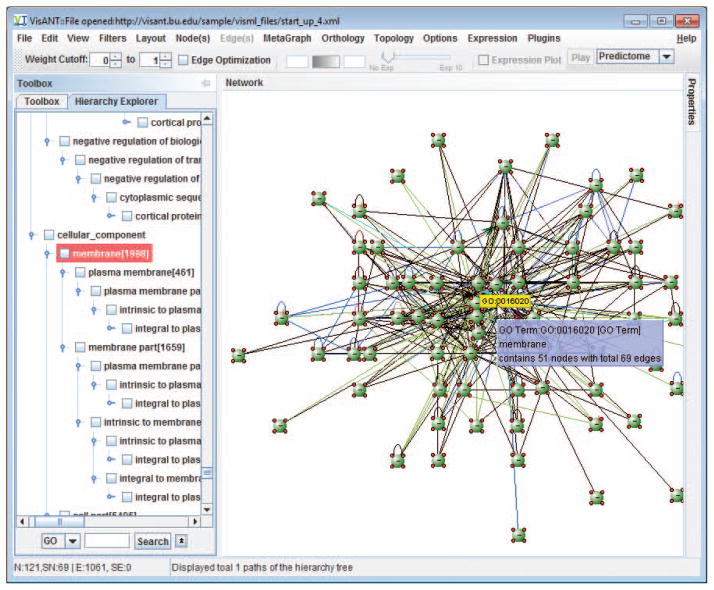
Delete all selected nodes by invoking the menu Edit/Delete Selected Nodes. Double-clicking on the metanode to expand it, and then remove the metanode by invoking the menu Metagraph/Grouping/Ungroup Selected Nodes. The nodes shown in the network now are all membrane genes. Layout the network by invoking the menu Layout/Spring Embedded Relaxing…, and the network will be similar to the one shown in Fig. 8.8.33.
-
15
Select all the nodes except STE3 and FUS1, and change their properties similar to what are shown in Fig. 8.8.34.
-
16
Detect the shortest path between FUS1 and STE3 (see Support Protocol 1), which will cause all possible shortest paths to be listed and selected in the network. Click on one of the path will cause only the corresponding path selected in the network, as shown in Fig. 8.8.35.
-
17
Make sure the option Fine Arts under Options menu is selected. Invoke the Property panel by mouse-over the Properties button on VisANT’ right sidebar, and change the edge weight as 0.5.
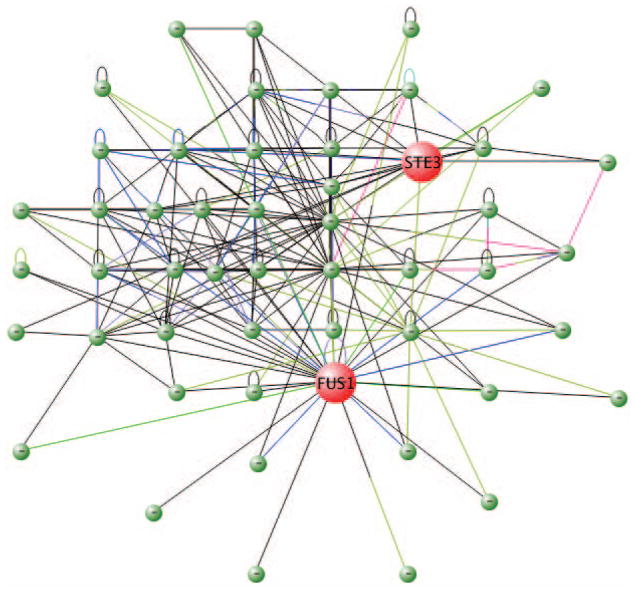
The resulting network is shown in Figure 8.8.36, with the shortest path clearly distinguished.
Figure 8.8.27.
Network after visual customization of both STE3 and FUS1.
Figure 8.8.28.
Network GO annotation. The tooltip shows the GO annotation of STE3, indicating it is a membrane protein.
Figure 8.8.29.
Configuration of Hierarchy Explorer.
Figure 8.8.31.
Illustration of filtering the network with GO annotation. Drag&drop the GO term membrane will create a metanode of GO term with all membrane embedded, including STE3 and FUS1.
Figure 8.8.32.
Collapse the metanode of GO term and invert the node selection to select all nodes that are not membrane proteins.
Figure 8.8.33.
Network after removing nodes that are not membrane proteins.
Figure 8.8.34.
Change node property to make the network easier to read.
Figure 8.8.35.
Select the shortest path by clicking on the detection results.
Figure 8.8.36.
Network with highlighted shortest path between FUS1 and STE3.
BASIC PROTOCOL 3: CONNECTING GENES, DRUGS, DISEASES AND THERAPIES: AN APPLICATION TO DRUG REPOSITIONING
There is increasing evidence that most diseases result from abnormalities of many genes rather than a single gene. These genes work collaboratively, as a complicated network, to reflect the functional variation of corresponding cellular processes (Barabasi et al. 2011; Bast 2011). Such network-based views and approaches enhance our capability to identify disease-associated genes, modules and pathways; They also bring new insights of the functional and causal relationship among different diseases because of the interdependency between a cell’s molecular components (Goh et al. 2007).
Network-based approaches also lead to the relatively new emerging field, network pharmacology, where drug actions and side effects have been analyzed in the context of regulatory networks, within which drug targets and disease genes function through complicated inter-connection (Hopkins 2008). Such approaches provide new tools for the drug discovery of complex diseases, and the study of the efficacy of drugs that may have more than one binding partners. A number of new ideas, such as drug repositioning (Ashburn and Thor 2004; Harrison 2011; Corbett et al. 2012; Sanseau et al. 2012; Shigemizu et al. 2012), multi-target drugs (Csermely et al. 2005; Tian and Liu 2012; Liu et al. 2013) and combination therapy (i.e., the use of several drugs together to treat a single disease) (Borisy et al. 2003) are therefore becoming promising areas of drug design.
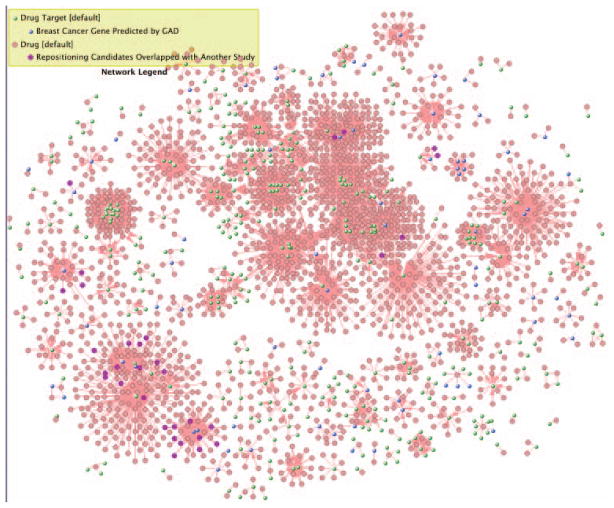
Here we will try to find the repositioning drug candidates, using breast cancer as an example, with the assumption that drugs whose targets are associated with breast cancer may be applied to treat the disease. We first build the drug-target network by loading all drug-target interactions in VisANT. We then filtered the network to find the genes predicted to be associated with breast cancer by the GAD database (marked as blue nodes). The drugs binding to the blue nodes will be our repositioning candidates. A quick comparison against the results from an independent repositioning study (Shigemizu et al. 2012) indicates a total 32 overlaps of repositioning candidates with supporting evidence (marked as purple drug nodes).
Necessary Resources
Hardware
Any computer with Internet access
Software
Java compatible browser
Java Run-time Environment (JRE) 1.4 or above (see Internet Resources)
Files
None
Construct the drug-target network
-
1
Start a browser and open the VisANT start page (http://www.visantnet.org). If the Start button in the WEB page (Fig. 8.8.2) is not visible, follow the instructions in the VisANT user’s manual http://www.visantnet.org/vmanual to install the required software (JRE).
-
2
Click the Start button, which will cause a VisANT window, having three main components (menu bar, control panel, and network panel; Fig. 8.8.3), to appear. Keep the start page open during all procedures.
-
3
Clear the network panel by clicking the Clear button in the control panel, and set the current species to Home sapiens.
-
4
Do not deselect any methods (Fig. 8.8.4). Scroll down the method table to make the method M6001 visible, and click the button All near the method to load all drug-target interaction available in VisANT system
-
5
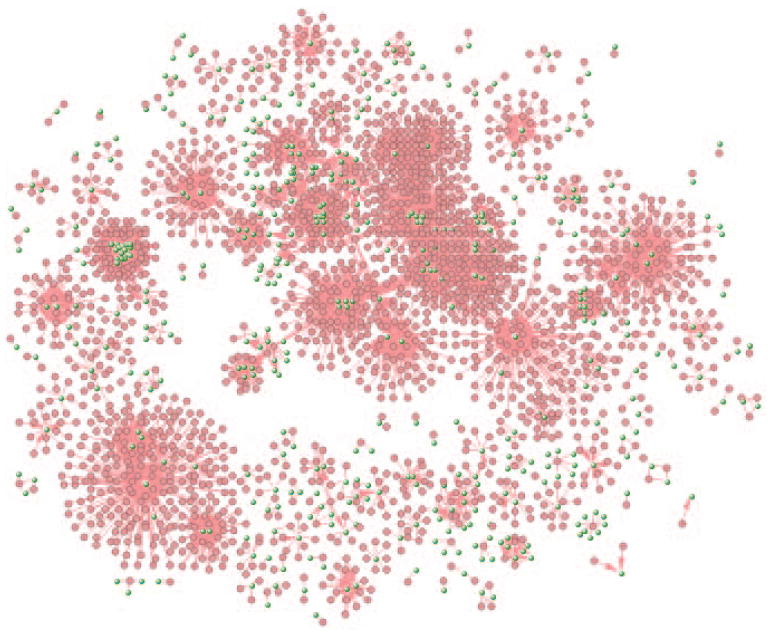
Do layout using the menu Layout/Spring Embedded Relax. Stop the layout when the network looks similar to the one shown in Fig. 8.8.37.
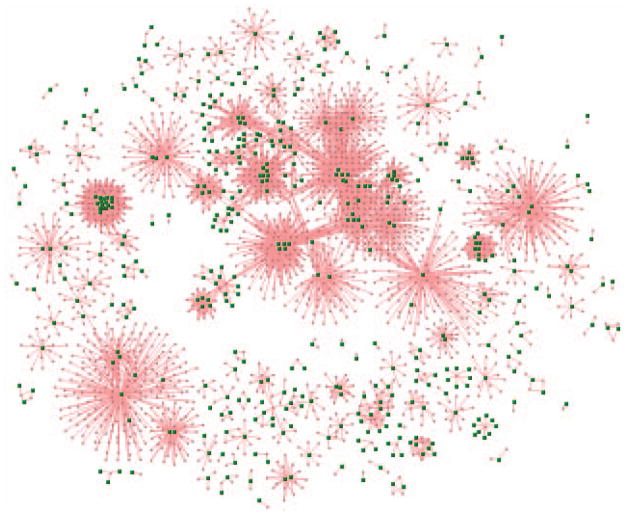
The small pink nodes represent the drugs and the green nodes are proteins targeted by drugs. -
6
The node is too small in Fig. 8.8.37. Click the button Zoom Out on VisANT toolbox, and then click button Reset button to reset the node to the default size. Then click the button Zoom Out several times so that the node size will be similar to the one shown in Fig. 8.8.38, and then click the button Fit to Page.
-
7
Select all nodes by either using mouse to drag a rectangle to cover all nodes, or through the key combination CTRL-A, or through the menu Edit/Select All.Nodes.
-
8
Click on the button Properties on right sidebar in VisANT so that properties window will be popped up, and click the Dock Button (as shown in Fig. 8.8.19) to dock the property window, and change the width of the property window if necessary. Make sure that two node properties: Expansion symbol and KEGG symbol are unchecked.
-
9
Click the Dock button again to hide the property window. Click on the empty space in the network to clear the selection.
The network shall look similar to the one shown in Fig. 8.8.38.
Figure 8.8.37.
Network of drug targets.
Figure 8.8.38.
Network of drug target with adjusted node size.
Filter the network using disease information
-
10
Click the Hierarchy Explorer on VisANT ToolBox, so that disease classification is ready to explore. Make sure that the More button (represented by an icon of up arrow near Search button) is visible. Change the width of the Hierarchy Explorer if necessary.
-
11
Click the More button so that configuration panel expands, make sure the option for the operation of drag&drop is Metanode of existing components only (Fig. 8.8.29). Click the More button again to hide the configuration panel.
Also see step 9 in Basic Protocol 2. -
12
Click the drop down list near the search textbox, and select Disease as the hierarchy to be searched.
-
13
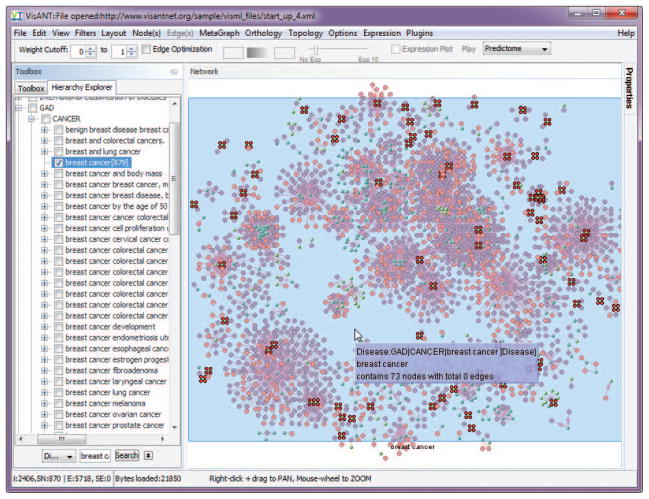
Type in breast cancer as the key words to be searched, and click the button Search. The results are shown in Fig. 8.8.39.
-
14
As shown in Fig. 8.8.39, the number of genes associated with the disease will be shown when the expansion symbol of the tree node is clicked. In this example, GAD (Genetic Association Database) predicted that there are 879 genes associated with breast cancer. Drag and drop this tree node to the drug-target network, a metanode of 73 genes is created and the nodes of the 73 genes are selected, as shown in Fig. 8.8.39.
-
15
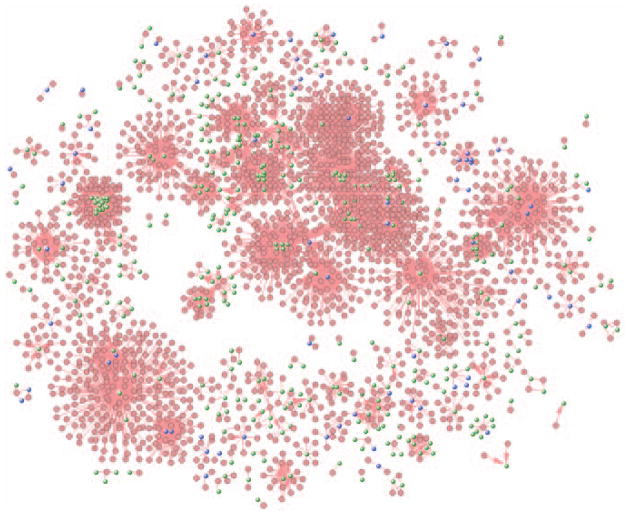
To distinguish these breast cancer genes predicted by GAD database (Becker et al. 2004), let’s change these nodes of disease genes into to blue color.
-
16
Because we only need to know the genes associated with breast cancer, we will therefore remove the metanode of breast cancer. Select the metanode by click on it, and ungroup it using menu MetaGraph/Grouping/Ungroup Selected Nodes. The resulting network will look similar to the one shown in Fig. 8.8.40.
The drugs connecting to the genes in the blue color shall be the repositioning candidates for breast cancer, given the hypothesis we made in this case study.
Figure 8.8.39.
Filtering drug target network using disease information (breast cancer).
Figure 8.8.40.
Network of drug target network with breast cancer genes in blue.
Result Comparison
The hypothesis we made obviously is primary and simple. As a quick test of this hypothesis, we compared our prediction against the predictions of an independent repositioning study (Shigemizu et al. 2012), which list following drugs as repositioning candidates for breast cancer with supporting evidence:
In the case of UC/DB:
Amiloride, Dizocilpine, Estradiol, Irinotecan, Metergoline, Nocodaole, Sirolimus, Thioridazine, Valproic acid
In the case of DC/UB:
Artemisinn, Bupropion, Dexamethasone, Dizocilpine, Dydrogesterone, Etoposide, Gabapentin, Irinotecan, Mestranol, Methotrexate, Nimesulide, Nomegestrol, Novobiocin, Prochlorperazine, Sirolimus, Testosterone, Valproic acid, Trifluoperazine, Troglitazone
The following steps illustrate how we can examine whether above repositioning candidates overlap with the results in this example.
-
17
Select Drug as the hierarchy to be searched as shown in Fig. 8.8.41.
-
18
Type Amiloride into the search box, and click the button Search. If the drug can not be found in the ATC hierarchy, continue with next step. Otherwise, the result will be shown in the hierarchy true, as shown in Fig. 8.8.41.
Copy/paste (CTRL-C/CTRL-V) is available when VisANT is started as a local application or web starter -
19
As also shown in Fig. 8.8.41, the ATC hierarchy indicates there are two drugs under the classification. Drag & drop the tree node to the network panel, unlike step 14, a collapsed therapy is created, which indicates that the drug-target network do not have drug Amiloride. Select and delete the therapy node using the menu Edit/Delete Selected Nodes.
-
20 Continu
with drugs Dizocilpine, Estradiol by repeating step 19, Dizocilpine can be bypassed because nothing can be found in the drug hierarchy for it.
-
21
When dragging & dropping Estradio tree node into the network, it does find several drugs in the drug-target network, and these drugs are targeting to the blue nodes, and that is what we are looking for, as shown in Fig. 8.8.42.
-
22
Change the color of these drugs so they can be distinguished from the rest. Use the same instructions as step 16, and change the color to purple (RGB; 102, 0, 204), and ungroup the therapy metanode.
-
23
Repeat steps 18–22 for the rest drugs, the resulting network will look similar to the network shown in Fig. 8.8.43. During the process of searching for the drugs, users can always use pop-up menu Collapse All to collapse all expanded trees.
-
24
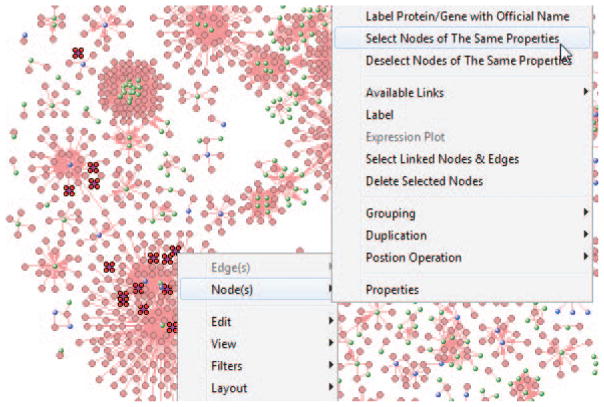
To check exactly how many drugs have supporting evidence as the repositioning candidates for the breast cancer, right mouse click over the purpose nodes, and use the pop-up menu Nodes/Select Nodes of Same Properties, as shown in Fig. 8.8.44. The number 32 (located at left-bottom corner in Fig. 8.8.44) is the total number of selected nodes (SN).
-
25
Add the network legend by menu View/Network Legend. Customize the label of the nodes embedded in the Legend nodes so they look similar to the one shown in Fig. 8.8.43.
Figure 8.8.41.

Filtering the drug target network using drug hierarchy in Hierarchy Explorer.
Figure 8.8.42.
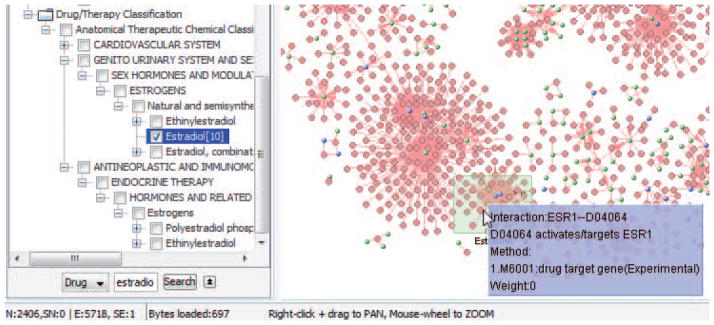
Illustration of how to find drug Estradio in the network.
Figure 8.8.43.
Network with drug target with highlighted repositioning candidates and network legend.
Figure 8.8.44.
Illustration of filtering nodes based on their visual properties.
COMMENTARY
Background Information
The VisANT tool for network visualization and analysis is a flexible web-enabled program for quick and flexible manipulation of biological interaction data. Biological interaction and network data can be derived from any method that detects associations between genes, proteins, or other biomolecules. As broad categories, some methods are experimental (e.g., yeast two hybrid, ChIP), while others are more computational and predictive of functional information (e.g., sequence similarity). As a network tool, VisANT enables users to manipulate and annotate bionetworks and pathways in a cohesive graphical interface with the goal of facilitating annotation and layering of user-defined information.
VisANT is accessible from any recent Java-enabled web browser on any platform. It supports a growing number of standard exchange formats and database referencing standards, such as KEGG/KGML (Kanehisa et al. 2012), Proteomics Standards Initiative (PSI; (Hermjakob et al. 2004)), BioPAX (in progress), GenBank (Benson et al. 2013), and the Gene Ontology (Ashburner et al. 2000). Multiple species are supported, to the extent that computed or experimental evidence of interactions or associations are available in public datasets or the Predictome database (Mellor et al. 2002). Functional linkage network (Linghu et al. 2009) is also available in VisANT system for Home sapients, Escherichia coli and Saccharomyces cerevisiae.
Predictome includes relations collected from other interaction databases (such as BioGrid; (Chatr-Aryamontri et al. 2013)) and MIPS (Mewes et al. 2002), from large scale studies based on public literature, or from inferences drawn using evolution-based computational methods. It is fully integrated with standard nomenclatures of different species (HUGO; (Povey et al. 2001)), Flybase (Drysdale 2008), SGD (Costanzo et al. 2013), and many others. The VisANT tool and Predictome database are under constant development. Please visit VisANT home page for latest updates.
Critical Parameters and Troubleshooting
The quality of a VisANT network is heavily dependent on the reliability of biological interactions/associations used to construct it, which in turn relies on the quality of the experimental and inferential methods used to detect the interactions. At the time of this writing, proteins are displayed as linked if they are correlated by one or another method, but no weight is given to the reliability of the method by which a correlation (link) is established. In general, the reliability of a link will increase when it is established by more than a single method (Yanai and DeLisi 2002). In addition, functional linkage networks are also developed where links is assigned probabilities and different sources of evidence integrated using a Bayesian formalism (Linghu et al. 2009).
Choice of network representation is often dictated by the research problem at hand. A disease-disease network will help to determine whether they share a common genetic origin while a disease-gene network may tell the common genes shared by them (Goh et al. 2007; Chavali et al. 2010). On the other hand, a drug target network may be preferred for the purpose of drug repositioning detailed in Basic Protocol 3 (Fig. 8.8.38). This global drug-target network also reveals some clear characteristics of the drug design similar to what has been found by the work of Yildirim et. al (Yildirim et al. 2007): the majority of the drugs target only a few proteins, indicating most of drugs are ‘follow-on’ drugs because they target already known targets. There are also a few of drugs, as also can be found in Fig. 8.8.38, that target many proteins. Many more networks may be constructed to fit various research purpose, as discussed by Spiro etc. (Spiro et al. 2008) and Barabasi et. al. (Barabasi et al. 2011). With the implementation of advanced metagrph and integrated hierarchical knowledge, these varied type of network can easily achieved in VisANT(Hu et al. 2013)
Although tools designed for network analysis have been blooming since early 2004 as a response to the emerging popularity of the interaction data of biomolecules (e.g., protein-protein interaction) (Hu et al. 2007a; Suderman and Hallett 2007; Kim Kjaerulff et al. 2013), none of them provide the integrated knowledge and functionality to support systematic analysis of the versatile type of networks of diseases, therapies, genes and drugs (as shown in Fig. 1) that have a great promise to aid the understanding of the mechanism of disease complexity and drug action, and to discover novel drug targets and improve the approval rate of new drugs (Spiro et al. 2008; Barabasi et al. 2011). Again, the great challenge is to integrate the hierarchical knowledge (e.g., disease hierarchy and therapy hierarchy) with adjacency relations (e.g., protein-protein interaction and drug-target interaction), which requires the use of advanced graph types as detailed in our previous publication (Hu et al. 2007a).
Figure 8.8.6.

The difference between three spring-forces-based layout algorithms.
Figure 8.8.30.
Clicking the node FUS1 to highlight its GO annotation in Hierarchy Explorer. FUS1 is also a membrane protein.
Acknowledgments
Research support was provided by NIH grants R01GM103502-05, 1R01RR022971-01A1, and 1R21CA135882-01.
Footnotes
Internet Resources
http://www.visantnet.org VisANT homepage.
http://www.visantnet.org/vmanual The VisANT user’s manual.
http://java.sun.com Free source of Java run-time environment 1.4 or above. Refer to VisANT user manual for detailed instruction.
Literature Cited
- Ashburn TT, Thor KB. Drug repositioning: identifying and developing new uses for existing drugs. Nat Rev Drug Discov. 2004;3(8):673–683. doi: 10.1038/nrd1468. [DOI] [PubMed] [Google Scholar]
- Ashburner M, Ball CA, Blake JA, Botstein D, Butler H, Cherry JM, Davis AP, Dolinski K, Dwight SS, Eppig JT, et al. Gene ontology: tool for the unification of biology. The Gene Ontology Consortium. Nat Genet. 2000;25(1):25–29. doi: 10.1038/75556. [DOI] [PMC free article] [PubMed] [Google Scholar]
- Barabasi AL, Gulbahce N, Loscalzo J. Network medicine: a network-based approach to human disease. Nat Rev Genet. 2011;12(1):56–68. doi: 10.1038/nrg2918. [DOI] [PMC free article] [PubMed] [Google Scholar]
- Bast RC., Jr Molecular approaches to personalizing management of ovarian cancer. Ann Oncol. 2011;22(Suppl 8):viii5–viii15. doi: 10.1093/annonc/mdr516. [DOI] [PMC free article] [PubMed] [Google Scholar]
- Becker KG, Barnes KC, Bright TJ, Wang SA. The genetic association database. Nat Genet. 2004;36(5):431–432. doi: 10.1038/ng0504-431. [DOI] [PubMed] [Google Scholar]
- Benson DA, Clark K, Karsch-Mizrachi I, Lipman DJ, Ostell J, Sayers EW. GenBank. Nucleic acids research. 2013 doi: 10.1093/nar/gku1216. [DOI] [PMC free article] [PubMed] [Google Scholar]
- Borisy AA, Elliott PJ, Hurst NW, Lee MS, Lehar J, Price ER, Serbedzija G, Zimmermann GR, Foley MA, Stockwell BR, et al. Systematic discovery of multicomponent therapeutics. Proc Natl Acad Sci U S A. 2003;100(13):7977–7982. doi: 10.1073/pnas.1337088100. [DOI] [PMC free article] [PubMed] [Google Scholar]
- Chatr-Aryamontri A, Breitkreutz BJ, Heinicke S, Boucher L, Winter A, Stark C, Nixon J, Ramage L, Kolas N, O’Donnell L, et al. The BioGRID interaction database: 2013 update. Nucleic acids research. 2013;41(Database issue):D816–823. doi: 10.1093/nar/gks1158. [DOI] [PMC free article] [PubMed] [Google Scholar]
- Chavali S, Barrenas F, Kanduri K, Benson M. Network properties of human disease genes with pleiotropic effects. BMC Syst Biol. 2010;4:78. doi: 10.1186/1752-0509-4-78. [DOI] [PMC free article] [PubMed] [Google Scholar]
- Corbett A, Pickett J, Burns A, Corcoran J, Dunnett SB, Edison P, Hagan JJ, Holmes C, Jones E, Katona C, et al. Drug repositioning for Alzheimer’s disease. Nat Rev Drug Discov. 2012;11 (11):833–846. doi: 10.1038/nrd3869. [DOI] [PubMed] [Google Scholar]
- Costanzo MC, Engel SR, Wong ED, Lloyd P, Karra K, Chan ET, Weng S, Paskov KM, Roe GR, Binkley G, et al. Saccharomyces genome database provides new regulation data. Nucleic acids research. 2013 doi: 10.1093/nar/gkt1158. [DOI] [PMC free article] [PubMed] [Google Scholar]
- Csermely P, Agoston V, Pongor S. The efficiency of multi-target drugs: the network approach might help drug design. Trends Pharmacol Sci. 2005;26(4):178–182. doi: 10.1016/j.tips.2005.02.007. [DOI] [PubMed] [Google Scholar]
- Drysdale R. FlyBase : a database for the Drosophila research community. Methods in molecular biology (Clifton, NJ) 2008;420:45–59. doi: 10.1007/978-1-59745-583-1_3. [DOI] [PubMed] [Google Scholar]
- Goh KI, Cusick ME, Valle D, Childs B, Vidal M, Barabasi AL. The human disease network. Proc Natl Acad Sci U S A. 2007;104(21):8685–8690. doi: 10.1073/pnas.0701361104. [DOI] [PMC free article] [PubMed] [Google Scholar]
- Harrison C. Signatures for drug repositioning. Nat Rev Genet. 2011;12(10):668. doi: 10.1038/nrg3076. [DOI] [PubMed] [Google Scholar]
- Hermjakob H, Montecchi-Palazzi L, Bader G, Wojcik J, Salwinski L, Ceol A, Moore S, Orchard S, Sarkans U, von Mering C, et al. The HUPO PSI’s molecular interaction format--a community standard for the representation of protein interaction data. Nat Biotechnol. 2004;22 (2):177–183. doi: 10.1038/nbt926. [DOI] [PubMed] [Google Scholar]
- Hopkins AL. Network pharmacology: the next paradigm in drug discovery. Nat Chem Biol. 2008;4 (11):682–690. doi: 10.1038/nchembio.118. [DOI] [PubMed] [Google Scholar]
- Hu Z, Chang YC, Wang Y, Huang CL, Liu Y, Tian F, Granger B, Delisi C. VisANT 4.0: Integrative network platform to connect genes, drugs, diseases and therapies. Nucleic acids research. 2013;41(Web Server issue):W225–231. doi: 10.1093/nar/gkt401. [DOI] [PMC free article] [PubMed] [Google Scholar]
- Hu Z, Hung JH, Wang Y, Chang YC, Huang CL, Huyck M, DeLisi C. VisANT 3.5: multi-scale network visualization, analysis and inference based on the gene ontology. Nucleic acids research. 2009;37(Web Server issue):W115–121. doi: 10.1093/nar/gkp406. [DOI] [PMC free article] [PubMed] [Google Scholar]
- Hu Z, Mellor J, Wu J, DeLisi C. VisANT: an online visualization and analysis tool for biological interaction data. BMC bioinformatics. 2004;5:17. doi: 10.1186/1471-2105-5-17. [DOI] [PMC free article] [PubMed] [Google Scholar]
- Hu Z, Mellor J, Wu J, Kanehisa M, Stuart JM, DeLisi C. Towards zoomable multidimensional maps of the cell. Nat Biotechnol. 2007a;25(5):547–554. doi: 10.1038/nbt1304. [DOI] [PubMed] [Google Scholar]
- Hu Z, Mellor J, Wu J, Yamada T, Holloway D, Delisi C. VisANT: data-integrating visual framework for biological networks and modules. Nucleic acids research. 2005;33(Web Server issue):W352–357. doi: 10.1093/nar/gki431. [DOI] [PMC free article] [PubMed] [Google Scholar]
- Hu Z, Ng DM, Yamada T, Chen C, Kawashima S, Mellor J, Linghu B, Kanehisa M, Stuart JM, DeLisi C. VisANT 3.0: new modules for pathway visualization, editing, prediction and construction. Nucleic acids research. 2007b;35(Web Server issue):W625–632. doi: 10.1093/nar/gkm295. [DOI] [PMC free article] [PubMed] [Google Scholar]
- Kanehisa M, Goto S, Sato Y, Furumichi M, Tanabe M. KEGG for integration and interpretation of large-scale molecular data sets. Nucleic acids research. 2012;40(Database issue):D109–114. doi: 10.1093/nar/gkr988. [DOI] [PMC free article] [PubMed] [Google Scholar]
- Kim Kjaerulff S, Wich L, Kringelum J, Jacobsen UP, Kouskoumvekaki I, Audouze K, Lund O, Brunak S, Oprea TI, Taboureau O. ChemProt-2.0: visual navigation in a disease chemical biology database. Nucleic acids research. 2013;41(Database issue):D464–469. doi: 10.1093/nar/gks1166. [DOI] [PMC free article] [PubMed] [Google Scholar]
- Linghu B, Snitkin ES, Hu Z, Xia Y, Delisi C. Genome-wide prioritization of disease genes and identification of disease-disease associations from an integrated human functional linkage network. Genome Biol. 2009;10(9):R91. doi: 10.1186/gb-2009-10-9-r91. [DOI] [PMC free article] [PubMed] [Google Scholar]
- Liu X, Zhu F, Ma XH, Shi Z, Yang SY, Wei YQ, Chen YZ. Predicting Targeted Polypharmacology for Drug Repositioning and Multi-Target Drug Discovery. Curr Med Chem. 2013 doi: 10.2174/0929867311320130005. [DOI] [PubMed] [Google Scholar]
- Mellor JC, Yanai I, Clodfelter KH, Mintseris J, DeLisi C. Predictome: a database of putative functional links between proteins. Nucleic acids research. 2002;30(1):306–309. doi: 10.1093/nar/30.1.306. [DOI] [PMC free article] [PubMed] [Google Scholar]
- Mewes HW, Frishman D, Guldener U, Mannhaupt G, Mayer K, Mokrejs M, Morgenstern B, Munsterkotter M, Rudd S, Weil B. MIPS: a database for genomes and protein sequences. Nucleic acids research. 2002;30(1):31–34. doi: 10.1093/nar/30.1.31. [DOI] [PMC free article] [PubMed] [Google Scholar]
- Povey S, Lovering R, Bruford E, Wright M, Lush M, Wain H. The HUGO Gene Nomenclature Committee (HGNC) Hum Genet. 2001;109(6):678–680. doi: 10.1007/s00439-001-0615-0. [DOI] [PubMed] [Google Scholar]
- Sanseau P, Agarwal P, Barnes MR, Pastinen T, Richards JB, Cardon LR, Mooser V. Use of genome-wide association studies for drug repositioning. Nat Biotechnol. 2012;30(4):317–320. doi: 10.1038/nbt.2151. [DOI] [PubMed] [Google Scholar]
- Shigemizu D, Hu Z, Hung JH, Huang CL, Wang Y, DeLisi C. Using functional signatures to identify repositioned drugs for breast, myelogenous leukemia and prostate cancer. PLoS Comput Biol. 2012;8(2):e1002347. doi: 10.1371/journal.pcbi.1002347. [DOI] [PMC free article] [PubMed] [Google Scholar]
- Spiro Z, Kovacs IA, Csermely P. Drug-therapy networks and the prediction of novel drug targets. J Biol. 2008;7(6):20. doi: 10.1186/jbiol81. [DOI] [PMC free article] [PubMed] [Google Scholar]
- Suderman M, Hallett M. Tools for visually exploring biological networks. Bioinformatics. 2007;23 (20):2651–2659. doi: 10.1093/bioinformatics/btm401. [DOI] [PubMed] [Google Scholar]
- Tian XY, Liu L. Drug discovery enters a new era with multi-target intervention strategy. Chin J Integr Med. 2012 doi: 10.1007/s11655-011-0900-2. [DOI] [PubMed] [Google Scholar]
- Tong AH, Evangelista M, Parsons AB, Xu H, Bader GD, Page N, Robinson M, Raghibizadeh S, Hogue CW, Bussey H, et al. Systematic genetic analysis with ordered arrays of yeast deletion mutants. Science. 2001;294(5550):2364–2368. doi: 10.1126/science.1065810. [DOI] [PubMed] [Google Scholar]
- Uetz P, Giot L, Cagney G, Mansfield TA, Judson RS, Knight JR, Lockshon D, Narayan V, Srinivasan M, Pochart P, et al. A comprehensive analysis of protein-protein interactions in Saccharomyces cerevisiae. Nature. 2000;403(6770):623–627. doi: 10.1038/35001009. [DOI] [PubMed] [Google Scholar]
- Yanai I, DeLisi C. The society of genes: networks of functional links between genes from comparative genomics. Genome Biol. 2002;3(11):research0064. doi: 10.1186/gb-2002-3-11-research0064. [DOI] [PMC free article] [PubMed] [Google Scholar]
- Yildirim MA, Goh KI, Cusick ME, Barabasi AL, Vidal M. Drug-target network. Nat Biotechnol. 2007;25(10):1119–1126. doi: 10.1038/nbt1338. [DOI] [PubMed] [Google Scholar]
Key References
- Hu Z, Chang YC, Wang Y, Huang CL, Liu Y, Tian F, Granger B, Delisi C. VisANT 4.0: Integrative network platform to connect genes, drugs, diseases and therapies. Nucleic acids research. 2013;41(Web Server issue):W225–231. doi: 10.1093/nar/gkt401. [DOI] [PMC free article] [PubMed] [Google Scholar]
- Hu Z, Hung JH, Wang Y, Chang YC, Huang CL, Huyck M, DeLisi C. VisANT 3.5: multi-scale network visualization, analysis and inference based on the gene ontology. Nucleic acids research. 2009;37(Web Server issue):W115–121. doi: 10.1093/nar/gkp406. [DOI] [PMC free article] [PubMed] [Google Scholar]
- Hu Z, Mellor J, Wu J, DeLisi C. VisANT: an online visualization and analysis tool for biological interaction data. BMC bioinformatics. 2004;5:17. doi: 10.1186/1471-2105-5-17. [DOI] [PMC free article] [PubMed] [Google Scholar]
- Hu Z, Mellor J, Wu J, Yamada T, Holloway D, Delisi C. VisANT: data-integrating visual framework for biological networks and modules. Nucleic acids research. 2005;33(Web Server issue):W352–357. doi: 10.1093/nar/gki431. [DOI] [PMC free article] [PubMed] [Google Scholar]
- Hu Z, Ng DM, Yamada T, Chen C, Kawashima S, Mellor J, Linghu B, Kanehisa M, Stuart JM, DeLisi C. VisANT 3.0: new modules for pathway visualization, editing, prediction and construction. Nucleic acids research. 2007b;35(Web Server issue):W625–632. doi: 10.1093/nar/gkm295. [DOI] [PMC free article] [PubMed] [Google Scholar]
- Hu Z, Snitkin ES, DeLisi C. VisANT: an integrative framework for networks in systems biology. Briefings in bioinformatics. 2008;9(4):317–325. doi: 10.1093/bib/bbn020. [DOI] [PMC free article] [PubMed] [Google Scholar]
- Hu Z, Mellor J, Wu J, Kanehisa M, Stuart JM, DeLisi C. Towards zoomable multidimensional maps of the cell. Nat Biotechnol. 2007a;25(5):547–554. doi: 10.1038/nbt1304. [DOI] [PubMed] [Google Scholar]


