Abstract
When they are hydraulically isolated, embolized xylem vessels can be refilled, while adjacent vessels remain under tension. This implies that the pressure of water in the refilling vessel must be equal to the bubble gas pressure, which sets physical constraints for recovery. A model of water exudation into the cylindrical vessel and of bubble dissolution based on the assumption of hydraulic isolation is developed. Refilling is made possible by the turgor of the living cells adjacent to the refilling vessel, and by a reflection coefficient below 1 for the exchange of solutes across the interface between the vessel and the adjacent cells. No active transport of solutes is assumed. Living cells are also capable of importing water from the water‐conducting vessels. The most limiting factors were found to be the osmotic potential of living cells and the ratio of the volume of the adjacent living cells to that of the embolized vessel. With values for these of 1·5 MPa and 1, respectively, refilling times were in the order of hours for a broad range of possible values of water conductivity coefficients and effective diffusion distances for dissolved air, when the xylem water tension was below 0·6 MPa and constant. Inclusion of the daily pattern for xylem tension improved the simulations. The simulated gas pressure within the refilling vessel was in accordance with recent experimental results. The study shows that the refilling process is physically possible under hydraulic isolation, while water in surrounding vessels is under negative pressure. However, the osmotic potentials in the refilling vessel tend to be large (in the order of 1 MPa). Only if the xylem water tension is, at most, twice atmospheric pressure, the reflection coefficient remains close to 1 (0·95) and the ratio of the volume of the adjacent living cells to that of the embolized vessel is about 2, does the osmotic potential stay below 0·4 MPa.
Key words: Embolism, water transport, solute transport, air diffusion, xylem vessels, tracheid
INTRODUCTION
Holbrook and Zwieniecki (1999) suggested a mechanism for removing gas bubbles (embolism) from the water‐transport system of vascular plants. Living cells adjacent to the embolized vessel would create a driving force, ΔX, causing water to flow into the vessel lumen pressurizing the gas, which would dissolve to xylem fluid and diffuse away from the vessel. A qualitative scheme for the compartmentalization of the repair process and for the re‐establishment of the hydraulic continuity in the vessels was presented. Holbrook and Zwieniecki (1999) also suggested that water release from living cells to the refilling vessel is by means of the opening of membrane/water channels, but the existence of such a property has not yet been empirically verified. Tyree et al. (1999) concluded that none of the existing paradigms explains results obtained for woody stems of laurel (Laurus nobilis L.) but could not discount the possibility of aquapore opening and the resulting refilling by release of solutes into the vessel in other species. A mechanism by which embolized conduits could be hydraulically isolated from adjacent conduits was considered in more detail by Zwieniecki and Holbrook (2000), and the requirement for the existence of a non‐zero contact angle in the bordered pit chamber was presented. The present study concerns only the refilling process, and for the present view of the final re‐establishment of hydraulic continuity to complete the recovery process we refer to Zwieniecki and Holbrook (2000) and Zwieniecki et al. (2001).
There are several mechanisms suggested in the literature by which the positive hydrostatic water gradient from surrounding living cells to embolized vessels could be established. The driving gradient could be achieved by active secretion of salts/solutes by living cells into embolized vessels, thus decreasing the osmotic potential of water in embolized vessels allowing them to refill (Holbrook and Zwieniecki, 1999). Tyree et al. (1999) suggested that the membrane between the refilling vessel and the surrounding cell could become permeable to solutes if water channels opened, thus allowing a flow of solutes, followed by water, into the refilling vessel. Grace (1993) also hypothesized that solutes were secreted into embolized vessels by living cells. Salleo et al. (1996) found that phloem girdling and hormones that influenced phloem loading affected refilling in young plants of Laurus nobilis, and thus proposed the radial transport of solutes from the phloem via the ray cells to the refilling vessel to lower their osmotic potential. Milburn (1996) proposed that phloem could be the source of water released into refilling vessels due to the positive hydrostatic pressure generated there. Canny (1998) considered that living adjacent cells could generate positive pressures (by reverse osmosis), forcing water to move into vessels, thus refilling them.
In this study we consider movement of water into the hydraulically isolated embolized vessel, as suggested by Holbrook and Zwieniecki (1999) and Zwieniecki and Holbrook (2000). We assume that the water for refilling derives from the water‐conducting vessels via the adjacent living cells under turgor. The living cells also act as a source for solutes. In addition, the possibility of a ray cell continuum from the phloem into the refilling vessel is considered. Via this route solutes could diffuse to the adjacent living cells and eventually to the refilling vessel. No active transport of solutes is assumed. We apply one‐dimensional, cylindrical symmetrical mass transport equations for a single refilling vessel. We aim to highlight the important concepts and to present order‐of‐magnitude estimates of refilling thresholds and times. Yang and Tyree (1992) considered the dissolution and movement of gas. Since they were interested in the entire stem they applied a two‐dimensional cylindrical symmetrical model. However, they assumed that the pressure in the water adjacent to the bubble was equal to the stem xylem water pressure modified by surface tension effects, i.e. hydraulic compartmentalization was not assumed. In their scheme, the dissolution of bubbles was the driving force for the recovery from embolism, and the volume of the bubbles was replaced by xylem fluid. In contrast, in the present model it is proposed that the pressure of water in the refilling vessel is equal to the bubble gas pressure under hydraulic isolation and that refilling can occur only if there is a driving force that draws water into the vessel. We discuss the implications of this, estimate the limits of the time scale for embolism repair in the range of values of physico‐physiological quantities, and calculate the maximum pressure in the vessel during refilling together with the changes in osmotic pressures in the repairing vessel and the living cell. We test the suggestion of Holbrook and Zwieniecki (2000) that the maximum pressure in the refilling vessel should not rise too high so as to maintain hydraulic isolation until the refilling process is complete. The case of removal of a pure water vapour bubble is also considered.
THEORY
Water and solute transport between refilling vessels and living cells, and living cells and water‐conducting vessels
We consider a system that consists of a refilling vessel, water‐conducting vessels and living cells (Fig. 1; compartments 1, 2 and 3 respectively). The refilling vessel is partly filled by a gas (mixture of water vapour and air) (see also Holbrook and Zwieniecki, 1999). The vessel is hydraulically isolated from the adjacent water‐conducting vessels, but the adjacent living cells can supply water and solutes to the vessel. The living cells are also in contact with other water‐conducting vessels, which can supply water. In reality, the vessel may include several droplets of water retained on the wall due to the non‐zero contact angle, but in a cylindrically symmetrical (one‐dimensional) model only the gas–liquid volume fraction is taken into account and the water‐exchanging interface is assumed to be half of the cylindrical vessel wall area.
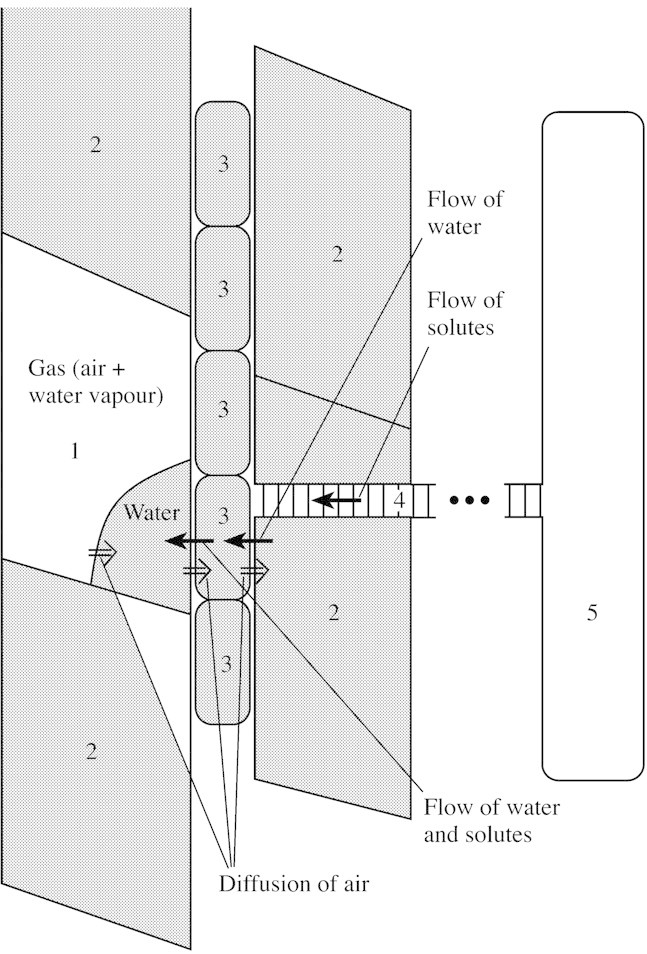
Fig. 1. Schematic representation of the system of the refilling vessel (1), water‐conducting vessels (2), living cells (3), ray cells (4) and phloem (5). The refilling vessel is hydraulically isolated from the xylem vessel. The refilling vessel contains liquid water and gas. The air dissolves in the water and diffuses out of the vessel.
In the presence of a driving force (ΔX) between two cells i and j, the flow rate of water (m3 s–1) into cell i is given by (e.g. Nobel, 1991):
Jij = AijLw,ijΔXij(1)
where subscripts i and j refer to the vessel type. Henceforth, e refers to the embolized, refilling vessel, l to a living one and x to the xylem; el and lx refer to the corresponding pair of cells. A is the area of the interface engaged in water exchange (half of the wall area) with a constant water conductivity coefficient Lw (m s–1 Pa–1). The driving force can be further estimated by (e.g. Dainty, 1963):


where the water pressure, Pe, in the refilling vessel is composed of the gas pressure (Pg) and the apparent osmotic pressure difference ΔPosm,el, which is the product of the reflection coefficient (σel), the difference in the solute concentration Cs (in mol m–3), the universal gas constant R and temperature T in K. For a semi‐permeable membrane the reflection coefficient is equal to unity and the apparent osmotic pressure difference is equal to the theoretical osmotic pressure difference. Pl corresponds to the turgor of living cells. The reflection coefficient for the living cell/xylem vessel boundary is set at unity and the solute concentration in the xylem water at zero.
The equation controlling the movement of solutes into the refilling vessel from the living cells is (e.g. Dainty, 1963; Nobel, 1991):

where Cs,el is the average of the concentrations Cs,l and Cs,e, and Ls,el is permeability of the solute. Note that Ls,el is a function of the reflection coefficient. The two terms on the right‐hand side of eqn (4) correspond to a convective flux and a diffusive flux, respectively. The diffusive flux is generally dominant. The solute exchange between the living cells and water‐conducting vessels is set at zero. Note that we are considering only a two‐component system although, in reality, there could be several solutes each having a different value of σ and Ls.
The equation describing the turgor pressure of the living cell is (e.g. Dainty, 1963):

where Er is the volumetric elastic modulus, and dVl is the change in cell volume, Vl, arising from the imbalance in the amount of water entering from the xylem and being withdrawn into the refilling vessel. Here, the elastic modulus is approximated as a constant, but this is not the case over large variations in pressure as Er decreases as the pressure is reduced (Taiz and Zeiger, 1998).
Water and solute transport from ray cells
In some simulations the passive permeation of solutes from ray cells into living cells is allowed for (Fig. 1). The ray cells are also in contact with phloem. For the simulations, the ray‐cell pathway is divided into a number of elements, of constant length, and solute transport between the each element pair is:

where Ar is the interface area involved in solute exchange and Lr is solute permeability. In the simulations only the total permeability of the ray‐cell pathway, Lr,tot, is considered: it is equal to Lr/Nr, where Nr is the number of the ray cells, Cs,i is the solute concentration of the element i, and Cs,i–1 is the concentration of the adjacent element. The outermost ray cell element is adjacent to the phloem, while the innermost element is adjacent to the living cell. Note that water transport (and corresponding convective flux of solutes) via the ray cells is ignored since it is small compared with water flow from water‐conducting xylem cells (and diffusive flux given above). Ray‐cell transport is discussed by Van Bel (1990).
Air transport
The flow of water into the refilling vessel compresses the air, thus making it dissolve into the water. In the presence of a concentration difference of dissolved air between the vessel lumen and air outside the stem or in the stem xylem, the diffusive flux of air (mol s–1) is estimated to be (e.g. Bird et al., 1960):

where Dair is the diffusion coefficient of air in the stem, ro is the characteristic distance for the concentration difference (or the distance from the vessel to the nearest edge of the stem segment) and rV is the vessel radius. Note that the formula is strictly valid only for coaxial cylinders, i.e. when the vessel is located in the centre of the stem. Cair,i represents the equilibrium concentration with the ambient air (i ≡ x) and concentration in the vessel lumen (i ≡ e) in contact with the air with the (partial) pressure Pair,i. The relationship is given by Henry’s law:

where H is the Henry’s law constant in mol m–3 Pa–1 [for discussion of Henry’s law coefficient with varying dimensional units, see Daniels and Alberty (1966, p. 140) and Seinfeld and Pandis (1998, p. 340)]. In the vessel, pressure varies during the refilling process. Note that Pg in eqn (2) is the total gas pressure, and only in the absence of water vapour is it exactly equal to Pair,e.
Beside diffusion, air could also be transported by convection (mass flow of water), but we disregard this here as the effect is small (see Yang and Tyree, 1992) and the air transport is governed mainly by the proper choice of the effective distance for diffusion.
Model simulations
Equations (1)–(8) predict the rates of water exudation, and solute and air transport. By multiplying the flow rate of water [eqn (1)], the solute flux [eqns (4) and (6)] and air flux [eqn (7)] by the small time step, the amount of the transported species is obtained (see Appendix).
Water and solute transport
First, we consider the processes that could make water exudation possible, i.e. that make ΔXel [eqn (2)] positive, which requires transport of solutes into the refilling vessel. The driving force ΔPel is initially negative, so there is no net water flow towards the refilling vessel. However, if the reflection coefficient at the interface between the adjacent cell and the refilling vessel decreases below unity this would, under turgor, make ΔPel positive and cause a flow of water and solutes into the refilling vessel, according to eqns (1), (2) and (4). For this process, Tyree et al. (1999) suggested that water channels (aquaporins) would open, making the membrane leaky to solutes too. According to Holbrook and Zwieniecki (1999), neighbouring living (parenchyma) cells could also act as water sources. However, the volume of living cells is insufficient to account for refilling, but if they were in further contact with the water‐conducting xylem they could transfer water into the refilling vessel.
In the model simulations for living cells as solute sources, the cells are initially set at thermodynamic equilibrium with the water‐conducting vessel lumens, i.e. initially ΔXlx = 0 [eqn (3)]. This means that the total initial water pressure has to be negative, i.e. the osmotic pressure difference has to exceed the turgor pressure by an amount that is equal to the xylem potential, i.e. initially Pl – Cs,lRT = Px. After this the turgor pressure changes, according to eqn (5), if the amount of water that enters from the xylem does not equal that transferred into the recovering vessel. The osmotic pressure differences between the cell pairs also change due to the solute flux and, if there are no sources of solutes, the concentration in the living cells and in the refilling vessel is governed solely by eqn (4) and the conservation of mass. However, in some simulations the living cells are able to obtain more solutes from the ray cells. Then the flow and mass conservation equations for a number of consecutive ray‐cell elements are estimated by eqn (6).
Air diffusion
Water flow into the recovering vessel compresses the air bubble. Dissolution of air is diffusion‐limited since if insufficient air diffuses away from the vessel, the pressure in the bubble increases and hinders water flow. The gas volume is decreased by the volume of water exuded into the vessel, given by Jel [eqn (1)], and the subsequent change in the gas pressure is calculated from the ideal gas law. The pressure increase further increases the equilibrium liquid‐phase concentration, Cair,l, via Henry’s law [eqn (8)], by which the new equilibrium concentrations are calculated. The amount of air diffusing away from the vessel is calculated using eqn (7) by multiplying the flux by the time step, and the corresponding amount of air is dissolved in the water. Finally, the calculations are repeated for the new time step. This is continued until the volume fraction of air in the embolized vessel reaches a given small value (0·001 % of the vessel volume in the simulations). When the amount of gas remaining is small, the bubble collapses, its pressure increases greatly and the contribution of surface tension starts to be significant to the dynamics. We do not consider this final stage. The value of the time step should be chosen so that changing the value has no noticeable influence on results.
The numerical procedure does not account for the explicit time dependence, i. e. non‐stationarity, of the processes, and the refilling is simulated in a quasi‐stationary manner (see e.g. Vesala et al., 1997). This is applicable if even the slowest individual process proceeds more quickly than the refilling itself or changes in the boundary conditions. In this case, the slowest process is diffusion of air in water, and the characteristic time scale of diffusion is in the order of R2/D, where R is vessel size and D is diffusivity, yielding an order of magnitude estimation of (10 µm)2/10–9 m2 s–1 = 0·1 s, which is much shorter than the time scale of refilling (typically more than several hours) or changes in boundary conditions (diurnal).
We also consider briefly the case of the water vapour bubble, although the existence of pure vapour may be transitory due to diffusion of air into the bubble (see also Lewis et al., 1994). In this case, the diffusion equation [eqn (7)] is not needed and the bubble pressure Pg follows the equilibrium water vapour pressure, which is 3·5 kPa at 300 K.
Parameter values
In the simulations, temperature, air diffusivity, equilibrium air partial pressure for xylem, Henry’s law constant and initial gas pressure are kept constant: T = 300 K; Dair = 1·7 × 10–9 m2 s–1 (Yang and Tyree, 1992); Pair,x = 0·1 MPa; H = 7·75 × 10–6 mol m–3 Pa–1 (Liley et al., 1984); and, initially, Pg = 0·1 MPa. The effect of the curvature of the gas–liquid interface can be omitted here. Dair and H depend on temperature (discussed by Yang and Tyree, 1992), but an increase in temperature increases diffusivity and lowers solubility, and the effects on diffusive transport partly cancel each other out. In addition, any inaccuracy in Dair can be incorporated in the variations of the diffusion distance, ro [eqn (7)]. Zwieniecki et al. (2001) reported that the diffusion coefficient for the movement of gas from a pressurized air‐filled vessel was of the same order of magnitude as that for air diffusing through water (1·95 × 10–9 m2 s–1). The importance of the temperature dependence of H is discussed briefly later. The initial value for the water content of the vessel is 1 % of the vessel volume.
Vessel radius (and thus also water exudation area), water conductivity and diffusion distance have a significant influence on the refilling time, and their values are varied. However, they do not determine whether the refilling process starts or not. This is governed by factors contributing to the pressure (hydrostatic and the effective osmotic) difference between the adjacent cells and the vessel, i.e. the hydrostatic and osmotic potentials in the neighbouring living cells, the reflection coefficient and solute permeability. Also, the elastic modulus of living cells controlling turgor, and the availability of water and solutes from the source compartment (from water‐conducting xylem and in some cases from ray cells, respectively) affect whether refilling can occur.
RESULTS AND DISCUSSION
Dynamics of the refilling, pressure and osmotic potentials
For numerical simulations, appropriate values of the various quantities must be determined. Table 1 presents a set of values that forms the model input for a base case, i.e. appropriate values of the parameters used primarily in simulations. Some of these are quite well‐defined, but if a broad range of possible values exists then the value chosen for the base case is moderate. Parameters with a broad range of possible values include diameter of the refilling vessel, elastic modulus of living cells, diffusion distance and solute permeability of refilling/living cell interface, and values chosen are adopted from Pickard (1981), Nobel (1991) and Zwieniecki et al. (2001), respectively. The water conductivity coefficient for plant cells ranges from about 10–13 to 2 × 10–12 m s–1 Pa–1 (Nobel, 1991). Zwieniecki et al. (2001) measured the radial conductivity of Fraxinus americana and found it to be six orders of magnitude less than the longitudinal conductance. Furthermore, the value of conductivity is linked with the reflection coefficient by means of the relationship given by Nobel (1991). Generally, solute permeability decreases as the reflection coefficient increases. Note that the reflection coefficient, as well as the corresponding water conductivities, of the refilling/living cell interface (0·5) differs from that of the living cell/xylem interface. This means that two sides of the same living cell have different transport properties, which can be explained by asymmetrical aquapore opening. The initial osmotic potential of adjacent living cells is set at –1·5 MPa, which is not atypical for living cells. Finally, the ratio of the total volume of living cells to the volume of the refilling vessel is set to 0·8. This is based on simulation results: if the value was much smaller then embolism recovery would not occur (this issue will be discussed later). Table 2 presents the parameters used for simulations when solute transport via ray cells is allowed for.
Table 1.
Model input for the base case, with values of parameters used in simulations
| Parameter | Value and units | Description |
| r v | 15 µm | Diameter of refilling vessel |
| r l | 13·4 µm | Diameter of living cell |
| r o | 1 mm | Diffusion distance of air |
| E r | 100 MPa | Elastic modulus of living cells |
| Cs,lRT at t = 0 | 1·5 MPa | Initial osmotic pressure of living cells |
| P x | –0·5 MPa | Xylem hydrostatic pressure |
| L w,el | 2·5 × 10–13 m s–1 Pa–1 | Water conductivity of refilling/living cell interface |
| L s,el | 10–7 m s–1 | Solute permeability of refilling/living cell interface |
| σel | 0·5 | Reflection coefficient of refilling/living cell interface |
| L w,lx | 2·5 × 10–14 m s–1 Pa–1 | Water conductivity of living/xylem cell interface |
| L s,lx | 0 m s–1 | Solute permeability of living/xylem cell interface |
| σ | 1 | Reflection coefficient of living/xylem cell interface |
The diameter of the living cell corresponds to a ratio of living to refilling vessel volume with a value of 0·8 (assuming that the vessels have the same lengths). The interface between the refilling vessel and the adjacent living cell over which water is exchanged is assumed to be half of the cylindrical wall area. The turgor pressure of the living cells is initially the sum of their osmotic pressure, with the pressure in the xylem being 1 MPa, i.e. the cells are in equilibrium with the xylem.
Table 2.
Model inputs for solute transfer from phloem via ray cells
| Description | Value and unit |
| Osmotic pressure of phloem | 1·5 MPa |
| Initial osmotic pressure of ray cells | 1·5 MPa |
| Total solute permeability of ray cells | Variable (m s–1) |
All other base case parameters are given in Table 1. The area between ray cells over which solutes are exchanged is assumed to be the same as that for refilling vessel/living cells.
Using values presented in Table 1, recovery from embolism is possible and the refilling time is 0·95 h (99·999 % of the vessel volume filled). Figure 2A presents the change in the ratio of liquid water volume to that of the recovering vessel for vessels with different radii. A radius of 15 µm is the base case, with a radius of 8 µm corresponding to small and 100 µm to large vessels. Note that recovery time is insensitive to vessel length. The base case is calculated under two different assumptions: that the bubble is composed of pure water vapour and that (1) diffusion of air into the vessel is allowed for; and (2) that it is not. The presence of pure water vapour initially lowers the pressure in the refilling vessel and makes recovery easier, as illustrated in Fig. 2A (for more on the importance of water vapour, see below). Generally, the rate of water exudation is initially very rapid, and decreases over time. Figure 2B shows the gas pressure Pg in the vessel during recovery, corresponding to the simulations shown in Fig. 2A, excluding the cases of water vapour. The pressure remains less than 0·19 MPa. If air diffusion were more limiting the maximum pressure would be greater. This result can be compared with the maximum pressure difference that can exist between water in the refilling vessel and gas trapped in the border pit chamber without expansion of water into the bordered pit chamber. If this requirement was not fulfilled full recovery did not occur. According to Zwieniecki and Holbrook (2000), the maximum difference was calculated to be within the range of 0·07 to 0·30 MPa for six species. These authors also found that positive pressures up to 0·4 MPa could be confined inside of the vessels whilst still retaining hydraulic isolation. Assuming a pressure of 0·1 MPa for gas in the pit chamber, Fig. 3 corresponds to pressure differences of 0 to 0·09 MPa.
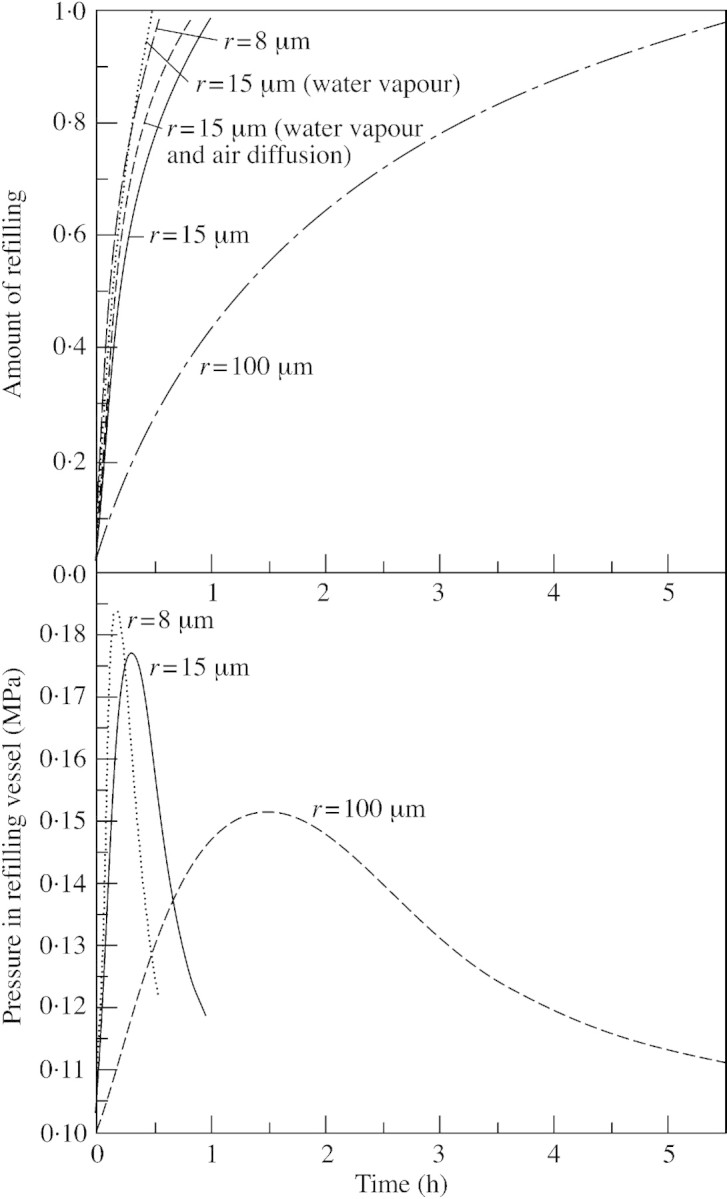
Fig. 2. Ratio of water volume to vessel volume as a function of time in the refilling vessel (A). Simulations are for three different vessel radii (r), and for a radius of 15 µm assuming a pure water vapour bubble and either allowing, or not, for the diffusion of air into the vessel. Other parameter values correspond to the base case (see Table 1). B, Pressure in refilling vessels with three different radii. Other parameter values correspond to the base case. Note that the hydrostatic pressure of free water at atmospheric pressure is set at 0·1 MPa, not at 0·0 MPa as used conventionally.
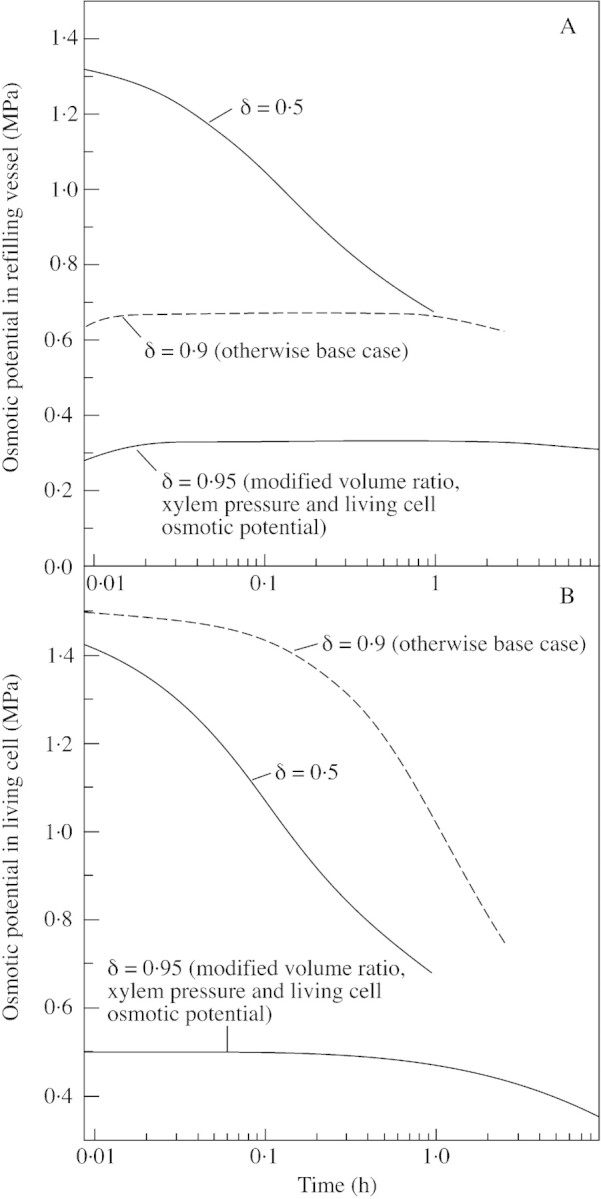
Fig. 3. Evolution of osmotic potential in the refilling vessel (A) and in the living cell (B). The simulations are calculated for the base case, for a reflection coefficient of 0·95 (otherwise the base case), and for a living cell to recovering vessel volume ratio of 2, a reflectivity coefficient of 0·95, a xylem pressure of –0·2 MPa and an initial living cell osmotic potential of –0·5 MPa (otherwise the base case).
Osmotic potentials in the vessel and in the living cell during refilling are shown in Fig. 3. For the base case, the osmotic potential in the refilling vessel remained very high (over 0·7 MPa) during the entire refilling; therefore, we repeated the simulations using modified input values. Increasing the reflection coefficient to 0·9 prolonged the refilling time and limited the osmotic potential to below, but close to, 0·7 MPa, which is still large. For this reason we also repeated the simulation using a living cell to recovering vessel volume ratio of 2, a reflectivity coefficient of 0·95, a xylem pressure of –0·2 MPa and an initial living cell osmotic potential of –0·5 MPa. In this case the osmotic pressure in the recovering vessel stayed close to –0·3 MPa, with a recovery time of about 9 h. In the living cell the osmotic potentials decreased from initial values.
Sensitivity analysis
Next we made a sensitivity analysis by varying one of the parameters in the base case; corresponding refilling times are presented.
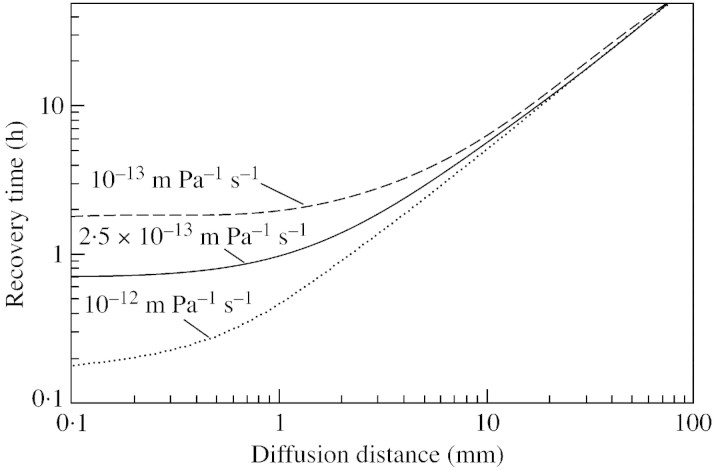
Figure 4 shows the sensitivity of diffusion distance with different values for water conductivity of the refilling/living cell interface. In the range of typical stem radii, refilling time is strongly limited by air diffusion. For a distance of 1 cm, the recovery time is over 5 h. However, ro can be much less than the order of the stem radius if the dissolved air in the stem corresponds to a pressure of 0·1 MPa. Under diffusion control, refilling time is also governed by the Henry’s law coefficient, which has a strong temperature dependence. When the temperature is reduced from 300 to 273 K, the coefficient increases by a factor of approx. 2 (e.g. Liley et al., 1984). If H is multiplied by a factor of 2, the recovery time (base case) is reduced from 0·96 to 0·77 h, and if H is multiplied by 0·5, the recovery time is 1·3 h. For diffusion distances less than 1 mm, any change in diffusion distance has an insignificant effect since the refilling time is limited by other factors, as also reported by Holbrook et al. (2001).
Fig. 4. Sensitivity of refilling time to the distance over which diffusion of dissolved air occurs for three values of the water conductivity of the refilling/living cell interface. Other parameters correspond to those of the base case.
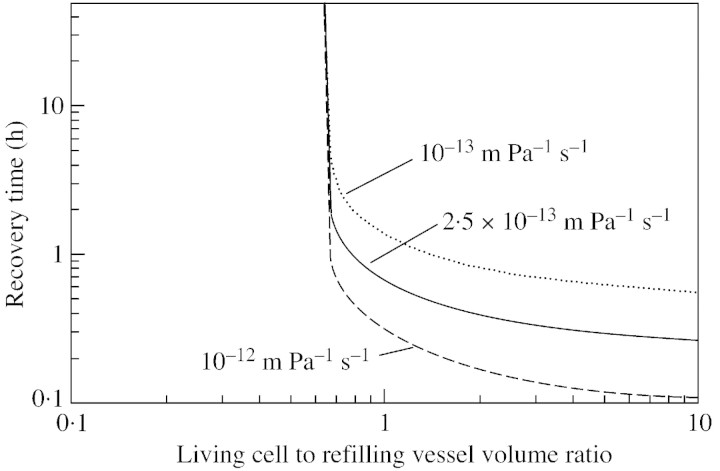
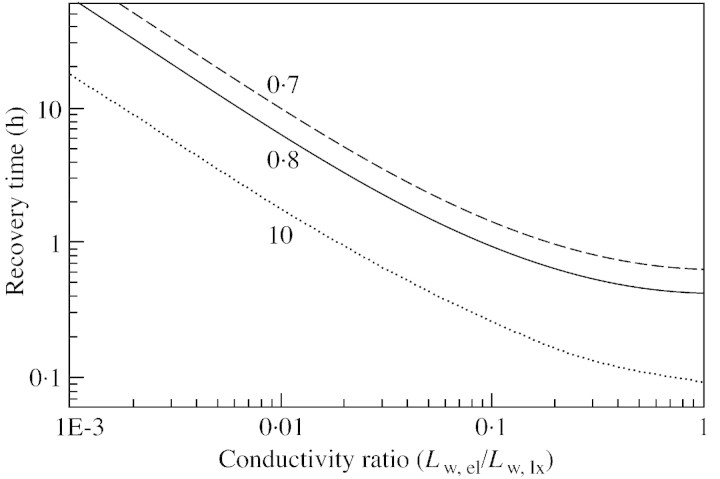
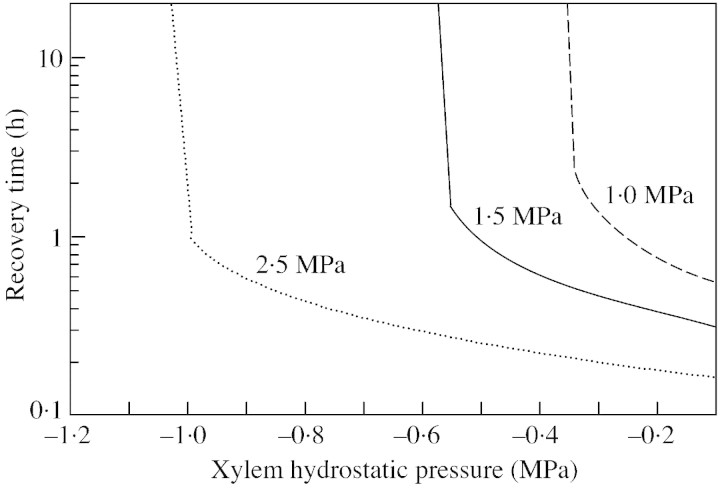
The sensitivity of recovery time to the ratio of the recovering vessel/living cell volume is shown in Fig. 5, with different values for water conductivity of the refilling/living cell interface. When the ratio is small (less than 0·7), recovery is hindered. For an elastic modulus of 100 MPa, a 1 MPa drop in the turgor pressure of the living cell would correspond to an approx. 1 % decrease in the volume of the cell [according to eqn (5)], hence 1 % of water would flow out of it. Thus, one of the factors limiting recovery is the total volume of parenchyma cells surrounding the refilling vessel, if the retrieval of water from xylem is limited. However, in Scots pine (Pinus sylvestris L.), for example, tracheids occupy 90 % of the total volume, and living cells 5–10 % (Tuuli Timonen, Botanical Museum, University of Helsinki, Finland, pers. comm.). This means that if the volume ratio is 0·7 as mentioned above, no more than about 10 % of the tracheids can simultaneously recover. However, the effect of the volume ratio depends on the conductivity of water between the living cells and the water‐conducting xylem vessels (Fig. 6). If the permeability ratio is larger, then the volume ratio is smaller, i.e. the total volume of living cells required to produce similar recovery times is also smaller. However, with the base case parameters, no recovery is achieved if the volume ratio is below 0·65. Figure 7 illustrates the importance for recovery of high solute concentrations in the living cells (the base case value of 1·5 MPa corresponds to an osmotic concentration of 0·6 mol l–1). However, the requirement for the osmotic potential depends on the overall water pressure in the xylem. If the xylem pressure is increased (i.e. tension released), the recovery time is shortened if the osmotic potential is fixed, or, from another point of view, the still reasonable (i. e. short) recovery times are obtained at lower osmotic pressures.
Fig. 5. Sensitivity of refilling time to the ratio of the living cell volume to that of the refilling vessel for three values of the water conductivity of the refilling/living cell interface. Other parameters correspond to those of the base case.
Fig. 6. Sensitivity of refilling time to the ratio of water conductivity across the refilling/living cell interface to that across the living/xylem interface, for three different values of the ratio of living to refilling vessel volume. Other parameters correspond to those of the base case.
Fig. 7. Sensitivity of refilling time to pressure in the water‐conducting xylem vessels for three different initial osmotic pressures of living cells. Other parameters correspond to those of the base case.
We also considered the sensitivity to the reflection coefficient of the embolized/living cell interface and elastic modulus of the living cell. The effect of reflection on recovery time is marginal when σel is varied from 0 to 0·9. When σel = 0·9, the recovery time is 2·5 h, and increases rapidly as σel tends towards unity. In these calculations, the relationship between solute permeability and reflection coefficient was given by Ls,el = exp[–(σel + 1·34)/0·113)] m s–1, which is the fitting based on the data given by Nobel (1991). Sensitivity to the elastic modulus is not very significant: the change in recovery time is rather small when the modulus differs from 100 MPa (0·8 h when the elastic modulus is 10 or 1000 MPa). The elasticity of living cells would be more important if they were isolated from the water‐conducting xylem and were the water source. In this case the elasticity would determine the amount of water that could be released before their turgor pressure dropped from its initial state to near the turgor loss point.
Simulations with xylem pressure changing diurnally
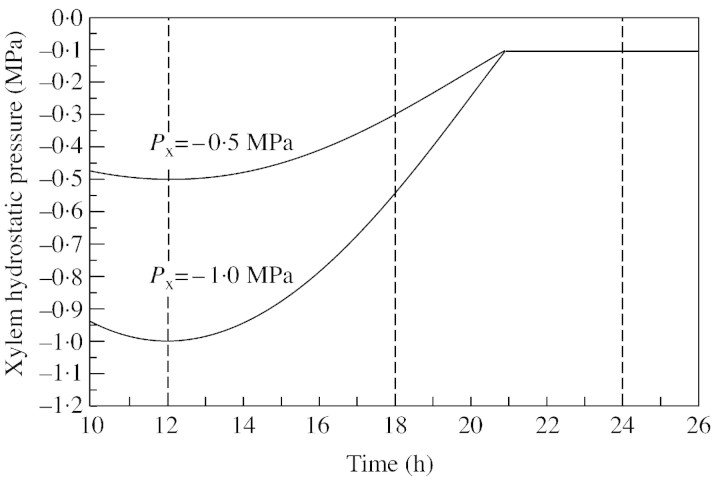
In the preceding simulations xylem pressure was assumed to be constant. However, in reality, it varies diurnally. We calculated rates of recovery using the schematic patterns (Fig. 8) based on the fact that under clear‐sky conditions the diurnal transpiration rate for a single tree, and hence xylem tension, typically resembles a sine wave during daytime and is near to zero at night. The value of the minimum xylem pressure (highest tension) was set at –1·0 and –0·5 MPa, and the greatest pressure of –0·1 MPa was reached at 2100 h in both cases, remaining constant thereafter. In simulations, the commencement of recovery was set at 1200, 1800 or 2400 h. The resulting recovery times are given in Table 3. The result for the case of –0·5 MPa and 1200 h corresponds to the base case. Recovery slowed towards the evening with the decreasing tension, and the effect of the highest tension value becomes insignificant if recovery occurs later.
Fig. 8. Simulation of the effects of diurnal changes in xylem hydrostatic pressure (Px) used for the analysis of the dependence of the recovery time for embolized vessels, for three times during the day when recovery started (1200, 1800 or 2400 h) (see Table 3).
Table 3.
Recovery time (h) for filling of an embolized xylem vessel, related to diurnal conditions, for three different commencement times using two minimum xylem hydrostatic pressures
| Minimum Px (MPa) | Commencement of recovery | ||
| 1200 h | 1800 h | 2400 h | |
| –0·5 | 0·95 | 0·45 | 0·32 |
| –1·0 | 6·32 | 0·84 | 0·32 |
Commencement times are shown by the dashed lines in Fig. 8.
Simulations allowing for the ray cell pathway
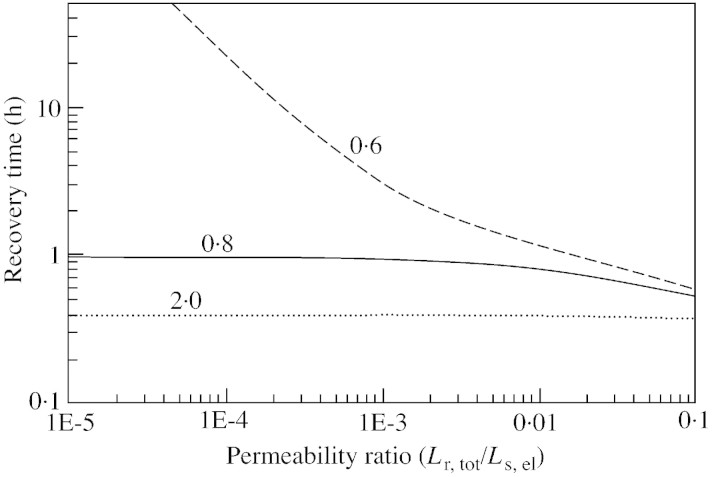
We considered the possible role of ray cells as transporters of solute from the phloem. In the base case, ray cells render recovery possible with a small total volume of living cells (volume ratio of 0·6 in Fig. 9), providing that ray cells are sufficiently permeable. In the simulations it was assumed that the initial osmotic potential in the ray cells, as well as in the living cells, was –1·5 MPa, but during the refilling process the solute concentration profile is dynamic between living cells and the phloem, where the osmotic potential remains –1·5 MPa. This value corresponds to a concentration of about 0·6 mol l–1. The concentration of sucrose in the phloem is generally 0·2 to 0·7 mol–1 (Nobel, 1991).
Fig. 9. Dependence of the refilling time on the ratio of total solute permeability of the ray cell pathway to that of the permeability between the living cell and refilling cell. Other parameters correspond to those of the base case (Tables 1 and 2).
Analysis of the role of water vapour and diffusion of air into the vessel
Finally, we considered the possible role of water vapour in the refilling process (see also Fig. 2A). The partial pressure of water vapour in the bubble is equal to the equilibrium vapour pressure, which is about 3 kPa and, in the case of the pure vapour bubble, the term Pg in eqn (2) is lowered, further decreasing the osmotic pressure difference threshold. However, although the embolus would initially be composed of water vapour, air would eventually diffuse into the vessel. Using eqn (7) with no air in the vessel initially, the air concentration can be shown to change according to , where Cair,∞ is the final concentration (at equilibrium with an ambient partial pressure of 0·1 MPa), Δx ≡ ro
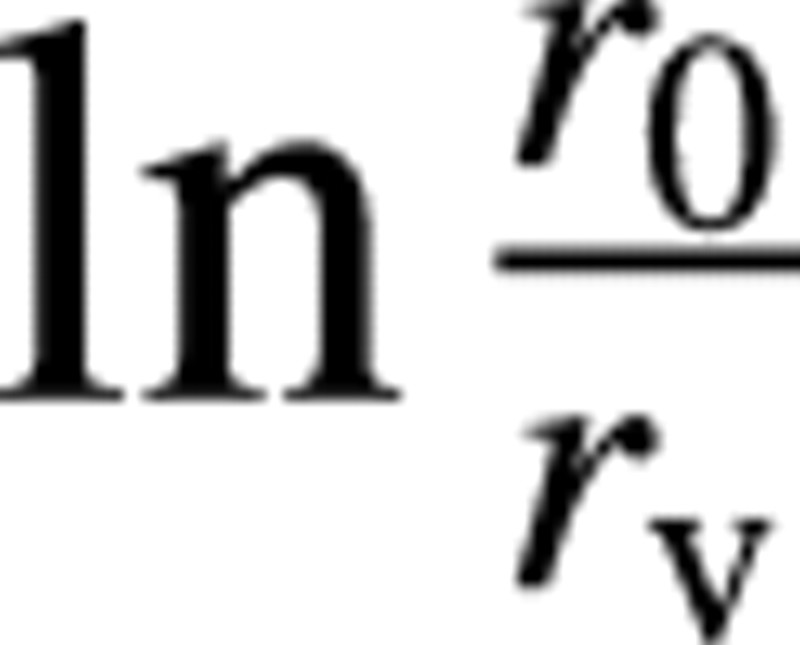 , V is the vessel volume and H* is Henry’s law coefficient (dimensionless), i.e. the ratio of the molar concentration of air to that dissolved in water at equilibrium (about 50 here). In the base case, to reach 0·99 of the final state requires 1·2 h. For a more detailed discussion of this see Lewis et al. (1994). However, the initial diffusion rate is large and the total gas pressure is 48 kPa after 10 min and 87 kPa after 0·5 h. Thus, in order that the pure water vapour case has any practical significance, rehydration must occur very quickly after embolus formation, which is unlikely.
GENERAL DISCUSSION AND CONCLUSIONS
Based on the hypotheses of Holbrook and Zwieniecki (1999), our analysis of the refilling process assumes that living cells act as solute sources and that they are able to transport water from the water‐conducting xylem vessels. It assumed that the water and solute permeabilities and reflection coefficient change differentially on two sides of the same living cell owing to the opening of aquapores. The basic simulations consist of the refilling time itself, the change in pressure and osmotic potential in the refilling vessel, and the osmotic potential in the living cell. Output from these simulations could be compared with available experimental results and used to evaluate model performance. Since, in reality, the various parameters have a range of possible values, and recovery can be facilitated by the diurnal behaviour of the xylem hydrostatic pressure (increasing as night approaches) and by solute transport via ray cells, sensitivity analyses were performed.
Borghetti et al. (1991) concluded that the refilling process must be purely physical or physico‐chemical (see also Grace, 1993). On the other hand, Salleo et al. (1996) hypothesized that refilling might be a result of an auxin‐induced increase in phloem loading with solutes, and this would cause radial transport of solutes to cavitated tracheids via the rays, thus decreasing their osmotic potential causing them to refill [for the possible role of phloem, see also Van Bel (1990) and Milburn (1999)]. Canny (1998) and McCully (1999) ruled out osmosis. Tyree et al. (1999) applied radiographic probe microanalysis to vessels in different states of refilling, but the amounts of dissolved solutes detected, with a limit of 0·34 MPa, were insufficient to account for osmotic water flow. For short recovery times (0·5 h), our model predicts osmotic potentials that were much higher than those observed. However, under the condition that xylem water tension is, at most, twice atmospheric pressure, the reflection coefficient remains close to one (0·95) and the ratio of the volume of the adjacent living cells to that of the embolized vessel is about 2, the osmotic potential in the refilling vessel stays below 0·4 MPa, but then the refilling time is in the order of 10 h.
To conclude, the study shows that the refilling process is physically possible under hydraulic isolation while water in surrounding vessels is under negative pressure, and the scheme by Holbrook and Zwieniecki (1999) may well explain the recovery process. To be sure of this, however, more experimental information on the evolution of osmotic potentials in both recovering vessels and living cells is desirable, preferably for various recovery times. In addition, it remains to be confirmed that two sides of the same living cell can have different transport properties, explained by asymmetrical aquapore opening.
ACKNOWLEDGEMENT
Financial support was provided by Technology Development Centre, Finland (project 40437/99).
APPENDIX
We list equations used to determine changes in the amount of liquid water and solutes in the refilling and living cell during the time step dt. According to eqns (1) and (2), change in the amount of water in the embolized, refilling vessel (in kg) is:

where ρw is the density of liquid water. Correspondingly, the amount of water in the living cell is governed by [see eqns (1) and (3)]:

The change of the amount of solute in the embolized, refilling vessel (in kg) is obtained from eqn (4):

where Ms is the molecular weight of the solute. The amount of solute in the living cell is obtained by:

where the exudation rate from the ray cells, Jr, is calculated by eqn (6). However, in most of the simulations Jr is set at zero.
The dynamics of turgor pressure, Pl, of the living cell are governed by eqn (5), where the living cell volume can be replaced by the amount of water:

The development of the gas pressure in the refilling vessel follows the ideal gas law:

where the flux of air, Jair, is given by eqn (7) and Vair is the difference between the vessel volume (Ve) and the liquid water:

Finally, the solute concentrations are naturally
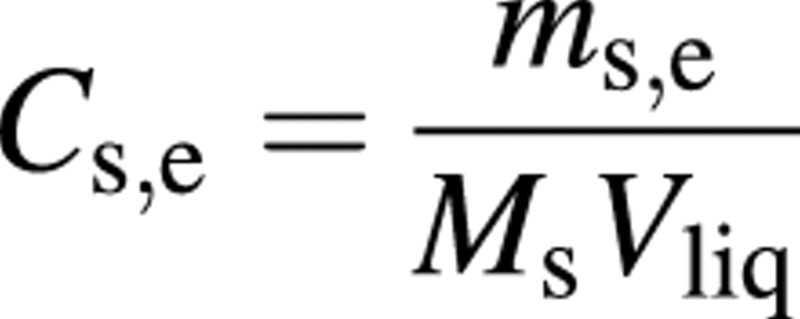
and

The above formulae form a full of set equations, together with the model inputs given in Tables 1 and 2.
Supplementary Material
Received: 18 April 2002; Returned for revision: 1 July 2002; Accepted: 8 October 2002 Published electronically: 16 January 2003
References
- BirdRB, Stewart WE, Lightfoot EN.1960. Transport phenomena. New York: John Wiley. [Google Scholar]
- BorghettiM, Edwards WRN, Grace J, Jarvis PG, Raschi A.1991. The refilling of embolised xylem in Pinus sylvestris L. Plant Cell and Environment 14: 357–369. [Google Scholar]
- CannyMJ.1998. Applications of the compensating pressure theory of water transport. American Journal of Botany 85: 897–909. [PubMed] [Google Scholar]
- DaintyJ.1963. Water relations of plant cells. Advances in Botanical Research 1: 279–236. [Google Scholar]
- DanielsF, Alberty RA.1966. Physical chemistry, 3rd edn. New York: John Wiley. [Google Scholar]
- GraceJ.1993. Refilling of embolized xylem. In: Borghetti M, Grace G, Raschi A, eds. Water transport in plants under climatic stress. Cambridge: Cambridge University Press. [Google Scholar]
- HolbrookNM, Zwieniecki MA.1999. Embolism repair and xylem tension: do we need a miracle? Plant Physiology 120: 7–10. [DOI] [PMC free article] [PubMed] [Google Scholar]
- LewisAM, Harnden VD, Tyree MT.1994. Collapse of water‐stress emboli in the tracheids of Thuja occidentalis L. Plant Physiology 106: 1639–1646 [DOI] [PMC free article] [PubMed] [Google Scholar]
- LileyPE, Reid RC, Buck E.1984. Physical and chemical data. In: Perry RH, Green D, eds. Perry’s chemical engineers’ handbook. 6th edn. New York: McGraw‐Hill. [Google Scholar]
- McCullyME.1999. Root xylem embolisms and refilling. Relation to water potentials of soil, roots and leaves, and osmotic potentials of root xylem sap. Plant Physiology 119: 1001–1008. [DOI] [PMC free article] [PubMed] [Google Scholar]
- MilburnJA.1996. Sap ascent on vascular plants: challengers to the cohesion theory ignore the significance of immature xylem and recycling of Münch water. Annals of Botany 78: 399–407. [Google Scholar]
- NobelPS.1991. Physicochemical and environmental plant physiology. 4th edn. San Diego: Academic Press. [Google Scholar]
- PickardWF.1981. The ascent of sap in plants. Progress in Biophysics and Molecular Biology 37: 181–229. [Google Scholar]
- SalleoS, Assunta Lo Gullo M, De Paoli D, Zippo M.1996. Xylem recovery from cavitation‐induced embolism in young plants of Laurus nobilis: a possible mechanism. New Phytologist 132: 47–56. [DOI] [PubMed] [Google Scholar]
- SeinfeldJH, Pandis SM.1998. Atmospheric chemistry and physics. New York: John Wiley. [Google Scholar]
- TaizL, Zeiger E.1998. Plant physiology. 2nd edn. Sunderland: Sinauer Associates. [Google Scholar]
- TyreeMT, Salleo S, Nardini A, Assunta Lo Gullo M, Mosca R.1999. Refilling of embolised vessels in young stems of laurel. Do we need a new paradigm? Plant Physiology 120: 11–21. [DOI] [PMC free article] [PubMed] [Google Scholar]
- VanBelAJE.1990. Xylem‐phloem exchange via the rays: the undervalued route of transport. Journal of Experimental Botany 41: 631–644. [Google Scholar]
- VesalaT, Kulmala M, Rudolf R, Vrtala A, Wagner PE.1997. Models for condensational growth and evaporation of binary aerosol particles. Journal of Aerosol Science 28: 565–598. [Google Scholar]
- YangS, Tyree MT.1992. A theoretical model of hydraulic conductivity recovery from embolism with comparison to experimental data on Acer saccharum Plant Cell and Environment 15: 633–643. [Google Scholar]
- ZwienieckiMA, Holbrook NM.2000. Bordered pit structure and vessel wall surface properties. Implications for embolism repair. Plant Physiology 123: 1015–1020. [DOI] [PMC free article] [PubMed] [Google Scholar]
- ZwienieckiMA, Melcher PJ, Holbrook N.2001. Hydraulic properties of individual xylem vessels of Fraxinus americana Journal of Experimental Botany 52: 257–264. [PubMed] [Google Scholar]
Associated Data
This section collects any data citations, data availability statements, or supplementary materials included in this article.


