

Abstract
Root flooding is damaging to the growth of crop plants such as soybean (Glycine max L.). Field flooding for 3 d often results in leaf chlorosis, defoliation, cessation of growth and plant death. These effects have been widely attributed solely to a lack of oxygen in the root‐zone. However, an additional damaging factor may be CO2, which attains levels of 30 % (v/v) of total dissolved gases. Accordingly, the effects of root‐zone CO2 on oxygen‐deficient soybean plants were investigated in hydroponic culture. Soybean plants are shown to be very tolerant of excess water and anaerobiosis. No oxygen (100 % N2 gas) and low oxygen (non‐aerated) treatments for 14 d had no effect on soybean survival or leaf greenness, but plants became severely chlorotic and stunted when the roots were exposed to no oxygen together with CO2 concentrations similar to those in flooded fields (equilibrium concentrations of 30 %). When root‐zone CO2 was increased to 50 %, a quarter of soybean plants died. Those plants that survived showed severe symptoms of chlorosis, necrosis and root death. In contrast, rice (Oryza sativa L.) plants were not affected by the combination of no oxygen and elevated root‐zone CO2. A concentration of 50 % CO2 did not affect rice plant survival or leaf colour. These results suggest that the high susceptibility of soybean to soil flooding, compared with that of rice, is an outcome of its greater sensitivity to CO2.
Key words: Anoxia, Glycine max (L.) Merr., hydroponics, hypoxia, Oryza sativa (L.), rice
INTRODUCTION
Field flooding causes premature senescence in soybean [Glycine max (L.) Merr.], which results in leaf chlorosis, necrosis, defoliation, cessation of growth and reduced seed yield (Stanley et al., 1980; Oosterhuis et al., 1990; VanToai et al., 1994; Linkemer et al., 1998). On‐farm research indicated that flooding for as little as 3 d at the early vegetative growth stages can kill soybean (Sullivan et al., 2001). Damage and death of flooded plants have been attributed to the lack of oxygen to support root respiration (Huck, 1970; Jackson and Kowalewska 1983; Kozlowski, 1984; Setter and Belford, 1990; Crawford, 1992). Although soybean is injured in flooded fields, it can thrive in stagnant, oxygen‐deficient water in the glasshouse (Boru et al., 1997). Therefore, soybean is much more tolerant to excess water and the lack of oxygen than previously expected (Grable, 1966; Sallam and Scott, 1987; Russell et al., 1990). Reasons underlying the dramatic differences between the responses to flooding in the glasshouse and flooding in the field are not known. In addition to the lack of O2, the concentration of CO2 in flooded soils may reach up to 50 % (v/v) of the total dissolved gases, and could be toxic to plants (Ponnamperuma, 1972). The actual concentration of soil CO2 depends on soil water content, soil type, amount of respirable substrate and activities of soil microorganisms (Duenas et al., 1995; Bouma et al., 1997b).
Conflicting results of the effects of elevated root‐zone CO2 on plant and root growth have been reported in the literature. Stolwijk and Thimann (1957) showed that a 2 % (v/v) concentration of CO2 inhibited growth of pea (Pisum sativum L.) roots by 80 %, whereas 6·5 % (v/v) CO2 did not affect root growth of oat (Avena sativa L.) or barley (Hordeum vulgare L.). In 1962, Glinka and Reinhold reported that soil CO2 inhibited the uptake of water in sunflower (Helianthus annuus L. ‘Jupiter’) roots. Nodule biomass and activities in Leucaena leucocephala were reduced significantly by flooding or fumigation with different concentrations of CO2 (Zhang et al., 1995). Contrary to these observations, Bouma et al., (1997a) reported that 2 % CO2 had no effect on shoot and root growth of field beans (Phaseolus vulgaris L.) and citrus (Citrus volkameriana Tan. & Pasq). Geisler (1967) also reported that 10 % CO2 stimulated root development of pea. These contradictory results could be due to the differences in plant species, levels of CO2 or treatment duration.
The objectives of this study were to determine the responses of soybean in hydroponic culture to elevated root‐zone CO2 and anaerobiosis similar to that found in flooded fields, and to compare the responses to those of rice (Oryza sativa L.), a flooding‐tolerant species.
MATERIALS AND METHODS
Plant materials and growth conditions
Seeds of soybean genotype ‘Williams’ and rice breeding line ‘271’ were germinated in moist sand at 25 ± 2 °C and 14 h light at a photosynthetically active radiation of 550 µmol photon m–2 s–1 for 10 d. Healthy, uniform seedlings were transferred to six 35 l plastic containers filled with nutrient solution as described by Imsande and Ralston (1981). The hydroponic containers were covered with 2‐cm‐thick styrofoam boards with 12 equally spaced holes through which six soybean and six rice seedlings were placed, one seedling per hole. Seedlings were fixed in an upright position using plugs of soft polyurethane and sealed with silicone grease. Styrofoam boards were sealed to the container using packing tape and silicone grease to prevent O2 absorption and CO2 loss during gas treatment. Seedlings were acclimatized to hydroponic conditions for 4 d before gas treatments were initiated.
Gas treatments
Gas treatment was imposed for 14 d by bubbling purified air (aeration), N2 gas (anaerobiosis), or 15, 30 or 50 % (v/v) CO2 balanced with N2 gas through the hydroponic solution. Flow rates for air, N2 and CO2 were 250, 280 and 300 ml min–1, respectively. Plants used for nutrient analysis were grown in hydroponic solution bubbled with 100 % CO2. No air or gas was bubbled through the solution in which plants in the non‐aerated treatment were grown. Different CO2 concentrations were generated by regulating the CO2 flow rate through capillary tubes of different diameter and length. CO2 concentrations were monitored and adjusted every other day by sampling at the inlet port into the hydroponic solution and analysing by gas chromatography (model 436 equipped with a 50 × 0·6 cm Porapak T column and a thermal conductivity detector; Packard Company, Downers Grove, IL, USA).
Measurements of the hydroponic solution
Dissolved oxygen in the hydroponic medium was monitored continuously using a dissolved oxygen meter (Model 58; YSI Corporate, Yellow Springs, OH, USA). The pH of the solution was determined every other day after the initiation of the gas treatment using a pH meter (Model 45; Beckman Coulter, Inc., Fullerton, CA, USA). A gas‐sampling device made of silicone rubber tubing (Jacinthe and Dick, 1996) was placed in each hydroponic solution. Gas samples (1 ml) were withdrawn from the device every other day to analyse for CO2 concentration using gas chromatography as described above.
Plant responses
Plant responses to gas treatments were determined by leaf greenness, measured using a portable chlorophyll meter (Model SPAD‐502; Minolta, Ramsey, NJ, USA) every 2 d. Three measurements were taken on each of the three uppermost fully expanded leaves; these measurements were averaged to give a value for the plant. At the end of the experiment, leaf area was measured using a leaf area meter (Model 3100; LI‐COR, Lincoln, NE, USA). Plant height, number of branches or tillers per plant, and the length of the longest root from the base of the stem were recorded. Root and shoot biomasses were recorded after samples had been dried at 80 °C until no further weight was lost. The root : shoot ratio (R : S) was calculated.
Mineral nutrient concentrations in harvested plant tissues (shoot and root combined) were determined by flame ionization (Association of Official Analytical Chemists, 1990) at the Service Testing and Research Laboratory, Ohio Agricultural Research and Development Center, Wooster, OH, USA.
Statistical analysis
The experiment was conducted twice, each time with six plants per treatment. All measurements were made on an individual plant basis. The treatment effects reported were determined from the two experiments on a total of 12 plants. Mineral nutrient analysis was performed on combined samples of six plants per replicate.
RESULTS
Effects of elevated root‐zone CO2 on hydroponic solution
Dissolved oxygen.
The equilibrium concentration of dissolved O2 was 8·0 mg l–1 in the aerated treatment and 1·5 mg l–1 in the non‐aerated treatment. Therefore, plants in the non‐aerated treatment experienced an oxygen‐deficient environment around their roots. Since dissolved oxygen was not detectable in the N2‐ and CO2‐bubbling treatments, these treatments were essentially anaerobic.
pH.
Hydroponic solutions were buffered with 1 mM MES and had an initial pH of 6·5. The pH gradually decreased to 5·7 by the end of the experiment regardless of the treatment (CO2, aeration or stagnation).
Dissolved CO2.
CO2 equilibrium concentrations of the aerated and non‐aerated solutions were 0·04 and 4 %, respectively. CO2 concentrations in the hydroponic solution collected by the gas‐sampling devices were consistent, with the supplied CO2 concentrations of 15, 30 and 50 % in the gas mixtures being passed through the hydroponic solution.
Effects of elevated root‐zone CO2 on soybean plants
Plant survival.
Survival of soybean plants was not affected by the anaerobic N2 gas treatment or by oxygen deficiency (1·5 mg l–1) in the non‐aerated treatment (Table 1). The 4 % CO2 of the non‐aerated treatment and the 15 % and 30 % CO2 in N2 treatments also had no detrimental effects on soybean survival. In the 50 % CO2 in N2 treatment, 25 % of soybean plants died.
Table 1.
Responses of soybean plants to 14 d of anaerobiosis, oxygen deficiency and elevated root‐zone CO2 treatments
| Number | ||||||||
| Plant | Plant | Leaf | of | Root | Dry weight (g per plant) | |||
| survival | height | area | branches | length* | R : S | |||
| Treatment | (%) | (cm) | (cm) | per plant | (cm) | Shoot | Root | ratio |
| Aeration with air | 100 | 39·7 ± 4·9 | 124 ± 15 | 3·4 ± 0·6 | 71·5 ± 12·0 | 3·9 ± 1·2 | 1·1 ± 0·2 | 0·28 |
| Non‐aeration | 100 | 41·3 ± 5·2 | 122 ± 13 | 2·3 ± 0·4 | 30·0 ± 7·1 | 3·5 ± 1·0 | 0·9 ± 0·2 | 0·26 |
| 100 % N2 gas | 100 | 31·2 ± 4·5 | 99 ± 11 | 2·2 ± 0·4 | 28·4 ± 6·2 | 3·4 ± 1·1 | 0·9 ± 0·2 | 0·26 |
| 15 % CO2 gas + 85 % N2 gas | 100 | 24·1 ± 3·1 | 46 ± 04 | 2·0 ± 0·7 | 15·4 ± 3·4 | 1·9 ± 0·6 | 0·4 ± 0·1 | 0·21 |
| 30 % CO2 gas + 70 % N2 gas | 100 | 16·7 ± 3·8 | 35 ± 07 | 1·2 ± 0·3 | 07·6 ± 2·3 | 1·1 ± 0·2 | 0·2 ± 0·1 | 0·18 |
| 50 % CO2 gas + 50 % N2 gas | 75 ± 10 | 10·2 ± 2·6 | 18 ± 05 | 0·0 | 04·0 ± 1·4 | 1·0 ± 0·2 | 0·1 ± 0·1 | 0·10 |
All values are expressed as means ± s.d. of two experiments on a total of 12 plants.
* Determined as the length of the longest root from the base of the stem.
Plant height, leaf area and number of branches.
At the end of the 2‐week experiment, the average height of plants in the aerated treatment (39·7 cm) was not significantly different from that of plants in the non‐aerated treatments (41·3 cm) (Table 1). While the average height of plants in the N2 treatment was reduced to 31·2 cm, that of plants in the 15, 30 and 50 % CO2 in N2 treatments was only 24·1, 16·7 and 10·2 cm, respectively. Similarly, the leaf area of plants in the aerated and non‐aerated treatments was also the largest (124 and 122 cm2, respectively), followed by that of plants in the N2 treatment (99 cm2). As CO2 concentrations in the anaerobic root‐zone increased from 15 to 30 and 50 %, leaf area was reduced to 46, 35 and 18 cm2, respectively.
Plants in the aerated treatment had the most branches (3·4 branches per plant). Plants in the non‐aerated, N2 gas and 15 % CO2 in N2 treatments had a similar number of branches (2·0–2·3 branches per plant). The number of branches was reduced to 1·2 per plant in plants in the 30 % CO2 in N2 treatment, while no branches formed on plants given 50 % CO2 in N2.
Root length, plant biomass and R : S ratio.
Roots were longest (71·5 cm) in the aerated treatment and were reduced to 30·0 cm in plants in the non‐aerated treatment and 28·4 cm in those treated with N2 (Table 1; Fig. 1). Root growth was even more severely inhibited in plants treated with elevated CO2. As compared with the N2 gas treatment, root length of plants treated with 15, 30, and 50 % CO2 in N2 was reduced by 46, 73 and 86 %, respectively. The majority of roots in the non‐aerated, N2 and elevated CO2 in N2 treatments are newly formed adventitious roots that grew from the base of the stem (Figs 1 and 2).
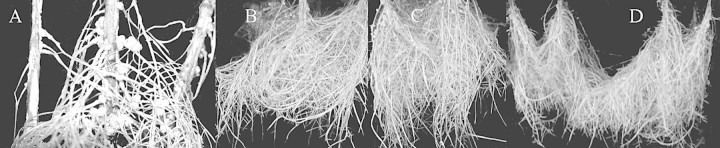
Fig. 1. Soybean roots after treatments lasting 14 d. A, Roots of plants treated with N2, showing stem hypertrophy, adventitious roots and root nodules. Roots of plants in the aerated treatment (B), non‐aerated treatment (C) and N2 treatment (D).
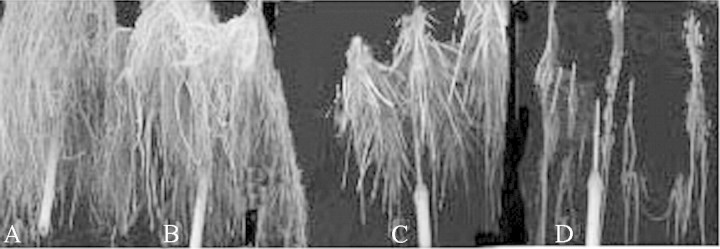
Fig. 2. Soybean roots after treatments lasting 14 d. Roots of plants in the aerated treatment (A), N2 treatment (B), 15 % CO2 in N2 treatment (C) and 30 % CO2 in N2 treatment (D).
Significant differences (P < 0·05) in root and shoot biomass were observed among the treatments (Table 1). Plants in the aerated treatment had the heaviest shoot (3·9 g) and root biomass (1·1 g), followed by plants in the non‐aerated treatment (3·5 g shoot, 0·9 g root biomass). As the concentration of anaerobic root‐zone CO2 increased from 15 to 30 and 50 %, shoot and root biomasses were reduced substantially. Plants treated with 15 % CO2 in N2 produced 1·9 g shoot tissue and 0·4 g root tissue, while those treated with 30 % CO2 in N2 produced 1·1 g shoot tissue and 0·2 g root tissue. Plants subjected to 50 % CO2 in N2 were the smallest, with a shoot biomass of 1·0 g and a root biomass of 0·1 g.
The R : S ratio of 0·28 in the aerated treatment was reduced to 0·26 in plants in the non‐aerated and N2 gas treatments. Elevated root‐zone CO2 depressed root growth much more severely than shoot growth, resulting in further reductions of R : S ratio to 0·21, 0·18 and 0·10 in plants treated with 15, 30 and 50 % CO2 in N2, respectively.
Leaf greenness.
The time course of the changes in leaf greenness during the 2‐week experiment, as determined by SPAD readings, indicated that leaf chlorophyll content declined gradually in plants in the aerated as well as in the non‐aerated and N2 gas treatments (Table 2). While soybean plants in the non‐aerated and the N2 gas treatments had no symptoms of chlorosis during the entire experimental period, leaves of plants treated with elevated CO2 were yellower after only 2 d. By 12 d, leaves of plants treated with 30 % CO2 in N2 were more yellow than those of plants treated with 15 % CO2 in N2. Leaves of plants treated with 50 % CO2 in N2 were the most chlorotic after 6 d (12·2 SPAD units). However, plants surviving this treatment were able to produce adventitious roots that grew into the soft polyurethane plugs. As a result, the leaves re‐greened by day 10 (15·1 SPAD units). Nevertheless, at the end of the experiment, leaves of plants treated with 50 % CO2 in N2 still contained the least chlorophyll (19·3 SPAD units) compared with those of the other treatments.
Table 2.
Time course of the changes in leaf greenness of soybean plants in response to anaerobiosis, oxygen deficiency and elevated root‐zone CO2 treatments
| Treatment duration (d) | |||||||
| Treatment | 2 | 4 | 6 | 8 | 10 | 12 | 14 |
| SPAD unit | |||||||
| Aeration with air | 38·2 ± 4·0* | 37·3 ± 4·4 | 36·0 ±4·2 | 36·9 ± 4·6 | 35·8 ± 4·9 | 33·4 ± 4·9 | 32·7 ± 5·3 |
| Non‐aerated | 38·9 ± 3·8 | 36·0 ± 4·0 | 35·1 ± 3·9 | 35·6 ± 4·1 | 35·6 ± 4·8 | 33·7 ± 5·1 | 31·8 ± 4·8 |
| 100 % N2 gas | 34·1 ± 3·6 | 33·1 ± 3·8 | 35·7 ± 4·0 | 36·8 ± 4·5 | 36·0 ± 5·2 | 32·7 ± 4·6 | 30·5 ± 4·0 |
| 15 % CO2 gas + 85 % N2 gas | 32·3 ± 3·5 | 30·2 ± 3·0 | 29·5 ± 3·5 | 28·0 ± 3·7 | 26·2 ± 4·1 | 26·5 ± 4·5 | 27·2 ± 3·6 |
| 30 % CO2 gas + 70 % N2 gas | 30·8 ± 3·2 | 28·8 ± 3·2 | 27·3 ± 3·1 | 25·7 ± 3·0 | 25·5 ± 3·7 | 24·0 ± 4·2 | 23·8 ± 3·3 |
| 50 % CO2 gas + 50 % N2 gas | 28·6 ± 3·0 | 25·0 ± 3·2 | 12·2 ± 2·2 | 13·3 ± 2·9 | 15·1 ± 3·0 | 18·2 ± 3·5 | 19·3 ± 3·1 |
Three measurements were taken on each of the three uppermost fully expanded leaves and averaged to give individual plant readings. Mean values of each experiment were calculated from six plants. Values presented are means ± s.d. of two experiments on a total of 12 plants.
* Three measurements were taken on each of the three uppermost fully expanded leaves and averaged to give the plant reading.
Nutrient uptake.
The concentration of minerals (mg g–1 d. wt) in shoots and roots was analysed to evaluate the effect of gas treatments on nutrient uptake. Plants treated with CO2 contained higher levels of P, Ca, Fe, Mg, Mn, Na and Zn than plants in other treatments. Levels of K, Cu and B did not differ among plants of different treatments (Table 3).
Table 3.
Nutrient content in soybean root and shoot tissues after treatments lasting 14 d
| Nutrient content (µg g–1 dry mass) | ||||||||||
| Treatment | P | K | Ca | Fe | Mg | Na | Mn | Zn | Cu | B |
| Aeration with air | 1062 ± 150 | 25 863 ± 2800 | 6470 ± 751 | 293 ± 30 | 2063 ± 324 | 187 ± 21 | 21 ± 4 | 18 ± 2 | 16 ± 3 | 10 ± 2 |
| Non‐aerated | 1981 ± 310 | 20 585 ± 1760 | 3770 ± 467 | 459 ± 36 | 1528 ± 389 | 235 ± 25 | 13 ± 2 | 15 ± 2 | 10 ± 2 | 12 ± 2 |
| 100 % N2 gas | 2289 ± 280 | 27 005 ± 3450 | 4847 ± 512 | 525 ± 55 | 1966 ± 312 | 204 ± 19 | 18 ± 2 | 19 ± 2 | 13 ± 2 | 13 ± 2 |
| 100 % CO2 gas | 4287 ± 450 | 23 756 ± 2490 | 9981 ± 988 | 987 ± 78 | 4499 ± 550 | 305 ± 37 | 25 ± 3 | 27 ± 4 | 13 ± 2 | 15 ± 3 |
All values are expressed as means ± s.d. of two experiments, each with combined samples of six plants.
Effects of elevated root‐zone CO2 on rice plants.
Contrary to the results obtained for soybean plants, rice plants in the non‐aerated, 100 % N2 gas, and 15 and 30 % CO2 in N2 treatments grew as well as aerated plants, as determined by leaf greenness, plant height, number of tillers, shoot biomass and R : S ratio (Table 4). Differences (P < 0·05) in root length, however, were detected among the treatments. Root length was greatest in the aerated treatment (17·8 cm), followed by the non‐aerated (15·9 cm) and N2 gas (15·8 cm) treatments. Treatment with 15 and 30 % CO2 in N2 reduced root length by 13·3 % as compared with N2 gas alone, while root length of plants exposed to 50 % CO2 in N2 was reduced by 25 %. Since the elevated CO2 treatments did not lead to a reduction in root mass, plants of these treatments actually produced a larger number of adventitious roots that were shorter and closer to the base of the stem than roots of the N2 treatment (Fig. 3).
Table 4.
Responses of rice plants to 14 d of anaerobiosis, oxygen deficiency and elevated root‐zone CO2 treatments
| Leaf | Plant | Root | Dry weight (g per plant) | ||||
| greenness | height | Number of | length* | ||||
| Treatment | (SPAD unit) | (cm) | tillers per plant | (cm) | Shoot | Root | R : S ratio |
| Aeration with air | 48·5 ± 5·3 | 39·5 ± 4·2 | 5·2 ± 0·5 | 17·8 ± 2·8 | 0·45 ± 0·18 | 0·11 ± 0·01 | 0·24 |
| Non‐aerated | 48·1 ± 5·7 | 37·9 ± 3·8 | 5·0 ± 0·4 | 15·9 ± 2·2 | 0·49 ± 0·15 | 0·12 ± 0·02 | 0·24 |
| 100 % N2 gas | 46·5 ± 5·2 | 38·2 ± 4·0 | 5·0 ± 0·4 | 15·8 ± 2·4 | 0·48 ± 0·18 | 0·12 ± 0·02 | 0·24 |
| 15 % CO2 gas + 85 % N2 gas | 48·8 ± 5·0 | 38·4 ± 4·3 | 5·0 ± 0·5 | 13·7 ± 1·7 | 0·50 ± 0·21 | 0·12 ± 0·02 | 0·24 |
| 30 % CO2 gas + 70 % N2 gas | 47·1 ± 4·7 | 40·5 ± 5·1 | 4·9 ± 0·5 | 13·8 ± 1·5 | 0·49 ± 0·20 | 0·11 ± 0·02 | 0·24 |
| 50 % CO2 gas + 50 % N2 gas | 47·6 ± 4·9 | 37·2 ± 3·2 | 4·8 ± 0·5 | 11·8 ± 1·3 | 0·47 ± 0·17 | 0·09 ± 0·01 | 0·19 |
All values are expressed as means ± s.d. of two experiments on a total of 12 plants.
* Determined as the length of the longest root from the base of the shoot.
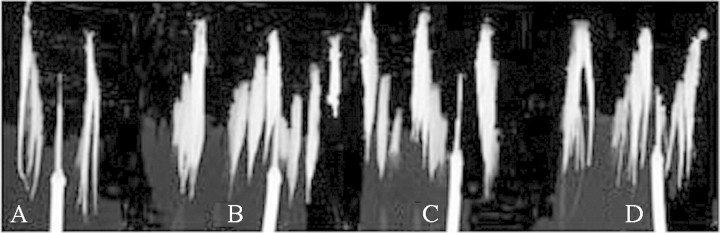
Fig. 3. Rice roots after treatments lasting 14 d. Roots of plants in the aerated treatment (A), N2 treatment (B), 15 % CO2 in N2 treatment (C) and 30 % CO2 in N2 treatment (D).
DISCUSSION
Soybean, one of the world’s major crops, is considered to be sensitive to flooding stress (Stanley et al., 1980; Oosterhuis et al., 1990; VanToai et al., 1994; Linkemer et al., 1998). Field flooding of soybean for as little as 3 d often results in leaf chlorosis, defoliation, cessation of growth and plant death (Sullivan et al., 2001). A lack of oxygen has been proposed to be the main problem associated with flooding (Armstrong, 1979; Jackson and Drew, 1984; Kozlowski, 1984). However, in the present hydroponic study, treatments involving 2 weeks without oxygen (100 % N2 gas) or 80 % oxygen reduction (non‐aerated) had no effect on soybean survival (Table 1). Plants adapted to the prolonged low oxygen and no oxygen conditions by producing adventitious roots, undergoing stem hypertrophy and developing aerenchyma for transportation of oxygen to the roots (Fig. 1A). Similar results were reported in soybean flooded for 21 d (Bacanamwo and Purcell, 1999). These adaptive mechanisms allow the plants to produce functional nodules (Fig. 1A) and probably explain the absence of leaf chlorosis (Table 2).
In addition to oxygen deficiency, the concentration of CO2 in flooded soils can reach up to 50 % (v/v) of the total dissolved gases and could be toxic to plants (Ponnamperuma, 1972). Actual CO2 concentrations depend upon many factors including soil water content, soil type, organic matter content and microbial activity (Duenas et al., 1995; Bouma et al. 1997b). To determine soil CO2 concentrations in flooded soybean fields in Ohio, USA, silicone rubber gas sampling devices were placed 25 cm deep in the field. Gas samples were taken every other day during flooding and these were analysed by gas chromatography. The soil CO2 concentration of non‐flooded soybean fields was about 1 % (v/v); this increased to 30–35 % (v/v) after 2 weeks of flooding.
In the hydroponic study, soybean plants did not die after 2 weeks exposure to 30 % CO2 in N2, a concentration similar to that of flooded fields. However, the plants were chlorotic, stunted, and produced fewer shoots and roots than plants in the no oxygen (nitrogen gas) or low oxygen (non‐aerated) treatments (Tables 1 and 2; Fig. 2D). When anaerobic root‐zone CO2 was increased to 50 %, a quarter of the plants died. Those plants that survived showed severe symptoms of chlorosis, necrosis and root death. In contrast, 50 % root‐zone CO2 did not affect survival of rice plants (Table 4), nor did the plants become chlorotic.
The cellular toxicity of CO2 is well documented (Fox, 1932). Sea water saturated with CO2 halts protoplasmic streaming and increases its viscosity in Nitella clavata (Fox, 1933). Kramer and Jackson (1954) reported that field soil saturated with CO2 inhibited water uptake by reducing the permeability of tobacco cell membranes. Treatments consisting of bubbling with 100 % CO2 for 10 min h–1 for 36 h reduced water uptake of wheat (Triticum aestivum), maize (Zea mays) and rice roots by 14 to 50 % (Chang and Loomis, 1945). In this hydroponic study, soybean plants that died in the 50 % CO2 in N2 treatment showed chlorosis, necrosis and wilting prior to death. No wilting symptoms were observed in rice plants. In addition to the reduction of water absorption and transport, CO2 treatments reduced absorption of K, N, P, Ca and Mg by roots of wheat, maize and rice and also led to Fe and P deficiency in sorghum plants (Chang and Loomis, 1945; Matocha and Mostaghimi, 1988). In the present hydroponic study, soybean plants exposed to elevated CO2 treatments contained similar levels of K, Mn, Cu and B to those in the aerated treatment, while concentrations of P, Ca, Fe, Mg, Na and Zn were 50 to 300 % higher (Table 3). Nutrient deficiency (except for N, which was not measured) was unlikely to be the cause of injuries observed in soybean exposed to elevated root‐zone CO2.
Concentrations of root‐zone CO2 >2 % were shown to inhibit ethylene binding and action in sunflower and potato plants (Govindarajan and Poovaiah, 1982; Finlayson and Reid, 1996; Scott and David, 1996). Ethylene is known to be necessary for the formation of adventitious roots and aerenchyma in the acclimation responses to flooding (Jackson et al., 1985; Justin and Armstrong, 1991). Soybean plants treated with elevated CO2 produced fewer adventitious roots than did plants in the N2 bubbling and non‐aerated treatments (Fig. 2). Thus, some of the injurious effects of high root‐zone CO2 in soybean might be caused indirectly by the lack of ethylene action. In rice, treatment with 30 % CO2 in N2 had no adverse effect on the number of adventitious roots (Table 3; Fig. 3). In many plant species, CO2 absorbed by the root is transported to the shoot through the transpiration stream at a very low concentration (Enoch and Olesen, 1993). A second transport route is present in rice plants: in this species, CO2 can be transported in the gaseous phase via an extensive network of lysigenous gas spaces at concentrations three‐ to four‐fold higher than in other species (Higuchi et al., 1984).
Due to the buffering capacity of 1 mm MES in the hydroponic solution, the elevated CO2 treatments in this study did not acidify the hydroponic solution more than did the aerated, non‐aerated and N2 bubbling treatments. However, CO2 is known to penetrate the cytoplasmic membrane readily, resulting in toxic cellular acidification (Jacobs, 1920). While the extent to which the internal pH of rice and soybean root cells was changed by CO2 is not known, it is conceivable that the tolerance of rice to elevated root‐zone CO2 is attributable to its ability to regulate cellular acidosis.
CONCLUSIONS
Soybean plants are very tolerant of excess water and anaerobiosis, but are injured under anaerobic conditions when root‐zone CO2 concentrations increase to those found in flooded soybean fields (30 %). Rice, a flooding‐tolerant species, is much more tolerant of elevated root‐zone CO2 levels than is soybean. Results suggest that CO2 toxicity is a factor affecting soybean tolerance to flooded soils.
ACKNOWLEDGEMENTS
We wish to thank Ms Virginia Roberts for laboratory assistance and helpful comments and Ms Elizabeth Parsons for help with CO2 analysis by gas chromatography. This research was funded in part by a grant from the United Soybean Board and the Ohio Soybean Council. Joint contribution of the USDA‐ARS and the Ohio State University. Partial salaries and research support provided by state and federal funds appropriated to the Ohio Agricultural Research and Development Center, the Ohio State University. Manuscript number HCS02‐16.
Supplementary Material
Received: 6 August 2001; Returned for revision: 16 October 2001; Accepted: 14 November 2002 Published electronically: 23 January 2003
References
- Association of Official Analytical Chemists.1990. Method 985.01. Metals and other elements in plants. In: Official methods of analysis. Arlington, VA: Association of Official Analytical Chemists, Inc. [Google Scholar]
- ArmstrongW.1979. Aeration in higher plants. Advances in Botany Research 7: 226–332. [Google Scholar]
- BacanamwoM, Purcell LC.1999. Soybean root morphological and anatomical traits associated with acclimation to flooding. Crop Science 39: 143–149. [Google Scholar]
- BoruG, VanToai TT, Alves JD.1997. Flooding injuries in soybean are caused by elevated carbon dioxide levels in the root‐zone. Proceedings of the Fifth National Symposium on Stand Establishment, Columbus, OH, USA, 205–209. [Google Scholar]
- BoumaTJ, Nielson KL, Eissenstat DM, Lynch JP.1997a Soil CO2 concentration does not affect growth or root respiration in beans or citrus. Plant Cell and Environment 20: 1495–1505. [Google Scholar]
- BoumaTJ, Nielson KL, Eissenstat DM, Lynch JP.1997b Estimating respiration of roots in soil: interaction with soil CO2, soil temperature and soil water. Plant and Soil 195: 221–232. [Google Scholar]
- ChangHT, Loomis WE.1945. Effects of carbon dioxide on absorption of water and nutrients by roots. Plant Physiology 20: 221–232. [DOI] [PMC free article] [PubMed] [Google Scholar]
- CrawfordRMM.1992. Oxygen availability as an ecological limit to plant distribution. Advances in Ecological Research 23: 93–185. [Google Scholar]
- DuenasC, Fernandez MC, Carreter T, Liger E, Perez M.1995. Emission of CO2 from soils. Chemosphere 30: 1875–1889. [Google Scholar]
- EnochHZ, Olesen JM 1993. Plant response to irrigation with water enriched with carbon dioxide. New Phytologist 125: 249–258. [DOI] [PubMed] [Google Scholar]
- FinlaysonSA, Reid DM.1996. The effect of CO2 on ethylene evolution and elongation rate in roots of sunflower (Helianthus annuus) seedlings. Physiologia Plantarum 98: 875–881. [Google Scholar]
- FoxDL.1932. Some historical and scientific aspects of narcosis, with special reference to carbon dioxide as a narcotic. Medical Research Review 38: 515–542. [Google Scholar]
- FoxDL.1933. Carbon dioxide narcosis. Journal of Cell Physiology 3: 75–100. [Google Scholar]
- GeislerG.1967. The interactive effect of CO2 and O2 in soil on root and top growth of barley and peas. Plant Physiology 42: 305–307. [DOI] [PMC free article] [PubMed] [Google Scholar]
- GlinkaZ, Reinhold L.1962. Rapid changes in permeability of cell membranes to water brought about by carbon dioxide and oxygen. Plant Physiology 37: 481–486. [DOI] [PMC free article] [PubMed] [Google Scholar]
- GovindarajanAG, Poovaiah BW.1982. Effect of root‐zone carbon dioxide enrichment on ethylene inhibition of carbon assimilation in potato plants. Physiologia Plantarum 55: 465–469. [Google Scholar]
- GrableAR.1966. Soil aeration and plant growth. Advances in Agronomy 18: 57–106. [Google Scholar]
- HiguchiT, Yoda K, Tensho K 1984. Further evidence for gaseous CO2 in rice plants. Soil Science and Plant Nutrition 30: 125–136. [Google Scholar]
- HuckMG.1970. Variation in taproot elongation rate as influenced by composition of the soil air. Agronomy Journal 62: 815–818. [Google Scholar]
- ImsandeJ, Ralston EJ.1981. Hydroponic growth and the nondestructive assay for dinitrogen fixation. Plant Physiology 68: 1380–1384. [DOI] [PMC free article] [PubMed] [Google Scholar]
- JacinthePA, Dick WA.1996. Use of silicone tubing to sample nitrous oxide in the soil atmosphere. Soil Biology and Biochemistry 28: 721–726. [Google Scholar]
- JacksonMB, Drew MC.1984. Effects of flooding on growth and metabolism of herbaceous plants. In: Kozlowski TT, ed. Flooding and plant growth New York: Academic Press, 47–128. [Google Scholar]
- JacksonMB, Kowalewska AKB.1983. Positive and negative message from roots induce foliar desiccation and stomatal closure in flooded pea plants. Journal of Experimental Botany 34: 493–506. [Google Scholar]
- JacksonMB, Fenning TM, Drew MC, Saker LR.1985. Stimulation of ethylene production and gas‐space (aerenchyma) formation in adventitious roots of Zea mays L. by small partial pressures of oxygen. Planta 165: 482–492. [DOI] [PubMed] [Google Scholar]
- JacobsMH.1920. The production of intracellular acidity by neutral and alkaline solutions containing carbon dioxide. American Journal of Physiology 53: 457–463. [Google Scholar]
- JustinSHF, Armstrong W.1991. Evidence of the involvement of ethane in aerenchyma formation in adventitious roots of rice (Ozyza sativa L.). New Phytologist 118: 49–62. [Google Scholar]
- KozlowskiTT.1984. Extent, causes, and impacts of flooding. In: Kozlowski TT, ed. Flooding and plant growth New York: Academic Press, 1–7. [Google Scholar]
- KramerPJ, Jackson WT.1954. Causes of injury to flooded tobacco plants. Plant Physiology 29: 241–245. [DOI] [PMC free article] [PubMed] [Google Scholar]
- LinkemerG, Board JE, Musgrave ME.1998. Waterlogging effect on growth and yield components of late‐planted soybean. Crop Science 38: 1576–1584. [DOI] [PubMed] [Google Scholar]
- MatochaJE, Mostoghimi S.1988. Effects of carbon dioxide and iron enrichment of a calcareous soil on Fe‐chlorosis, root and shoot development of grain sorghum. Journal of Plant Nutrition 11: 1503–1515. [Google Scholar]
- OosterhuisDM, Scott HD, Hampton RE, Wullschleger SD.1990. Physiological response of two soybean [Glycine max L. Merr] cultivars to short‐term flooding. Environmental and Experimental Botany 30: 85–92. [Google Scholar]
- PonnamperumaFN.1972. The chemistry of submerged soils. Advances in Agronomy 24: 29–95. [Google Scholar]
- RussellDA, Wong DML, Sachs MM.1990. The anaerobic response of soybean. Plant Physiology 92: 401–407. [DOI] [PMC free article] [PubMed] [Google Scholar]
- SallamA, Scott HD.1987. Effects of prolonged flooding on soybeans during early vegetative growth. Soil Science 144: 61–66. [Google Scholar]
- ScottAF, David MR.1996. The effect of CO2 on ethylene evolution and elongation rate in roots of sunflower (Helanthus annuus) seedlings. Physiologia Plantarum 98: 875–881. [Google Scholar]
- SetterT, Belford B.1990. Waterlogging: how it reduces plant growth and how plants overcome its effects. Western Australia Journal of Agriculture 31: 51–57. [Google Scholar]
- StanleyCD, Kaspar TC, Taylor HM.1980. Soybean top and root response to temporary water tables imposed at three different stages of growth. Agronomy Journal 72: 341–346. [Google Scholar]
- StolwijkJAJ, Thimann KV.1957. On the uptake of carbon dioxide and bicarbonate by roots, and its influence on growth. Plant Physiology 32: 13–20. [DOI] [PMC free article] [PubMed] [Google Scholar]
- SullivanM, VanToai TT, Fausey N, Beuerlein J, Parkinson R, Soboyejo A.2001. Evaluating on‐farm flooding impacts on soybean. Crop Science 41: 93–100. [Google Scholar]
- VanToaiTT, Beuerlein JE, Schmitthenner AF, St. Martin SK.1994. Genetic variability for flooding tolerance in soybeans. Crop Science 34: 1112–1115. [Google Scholar]
- ZhangJ, Liang J, Wong MH.1995. The effect of high CO2 and low O2 concentration in simulated landfill gas on the growth and nodule activity of Leucaena leucocephala Plant and Cell Physiology 36: 1431–1438. [Google Scholar]
Associated Data
This section collects any data citations, data availability statements, or supplementary materials included in this article.