Abstract
Branching patterns of the growth units of monocyclic or bicyclic annual shoots on the main axis of 5‐year‐old red oaks were studied in a plantation in south‐western France. For each growth unit, the production of axillary structures associated with each node was described in the form of a sequence. For a given category of growth units, homogeneous zones (i.e. zones in which composition in terms of type of axillary production does not change substantially) were identified on such sequences using a dedicated statistical model called a hidden semi‐Markov chain. For instance, on the first growth unit of bicyclic annual shoots, a zone with 1‐year‐delayed branches was found systematically below a zone with buds and one‐cycle‐delayed branches. Branching patterns shown by the growth unit of monocyclic annual shoots and on the second growth unit of bicyclic annual shoots were very similar. Branches with a 1‐year delay in development tended to be polycyclic at the top of the growth unit and monocyclic lower down. The number of nodes shown by the branched zone of the growth unit of monocyclic annual shoots was stable, irrespective of the total number of nodes of the growth unit. In contrast, the second growth unit of bicyclic annual shoots exhibited a correlation between the number of nodes in the branching zone and the total number of nodes. The contribution made by this method to understanding plant functioning is discussed.
Key words: Branching sequences, hidden semi‐Markov chain, morphology, polycyclism, Quercus rubra
INTRODUCTION
The northern red oak (Quercus rubra L.) is a species that shows rhythmic, polycyclic growth (Dickson, 1994). Yearly growth occurs in one or more bouts of elongation during which growth units (GU) are formed. Growth units in red oaks (Dickson, 1994; Collin et al., 1996; Guérard et al., 2001) and in Quercus robur L. and Quercus petraea (Matt.) Liebl. (Chaar et al., 1997; Collet et al., 1997; Heuret et al., 2000; Nicolini et al., 2000) possess different properties depending on their position on the annual shoot and whether the shoot is mono‐ or polycyclic. These studies investigated branching on the basis of global indicators (mean number of branches, number of branches per linear metre, etc.). Moreover, although different types of branching have been identified (sylleptic branching, proleptic branching with a one cycle or a 1‐year delay in development, etc.; Bell, 1991; Caraglio and Barthélémy, 1997), these types were not differentiated in these studies. Little is known about the branching pattern within individual growth units. This is often described in terms of acrotony, with the majority of branches generally being grouped towards the tip of the growth unit.
Recent studies in fruit trees (Costes and Guédon, 1997, 2002; Guédon and Costes, 1999; Seleznyova et al., 2002) and forest trees (Guédon et al., 1999) have shown that branching of growth units is often organized as a succession of homogeneous zones (i.e. zones in which composition properties, in terms of type of axillary production, do not change substantially; for a recent review, see Guédon et al., 2001). This type of structure was revealed by describing growth units as sequences of events, taking into account the succession of types of axillary production node by node. The generic problem of analysing successions of homogeneous zones in discrete sequences is currently addressed in both computational molecular biology and computational plant architecture. Hidden semi‐Markov chains emerged independently in these two scientific communities as the reference class of statistical models [see Burge and Karlin (1997) and Lukashin and Borodovsky (1998) for applications in gene finding]. Statistical methods for building hidden semi‐Markov chains from samples of discrete sequences have been developped (Guédon, 1999, 2003) and integrated in the AMAPmod software (see http://amap‐e‐learning.cirad.fr/ or http://amap.cirad.fr/amapmod/refermanual15/accueil.html; Godin et al., 1997, 1999).
The aim of this study was to analyse the branching pattern along different types of growth units in red oak, by describing the production of axillary structures associated with each node in the form of sequences. Branching patterns on growth units of monocyclic and bicyclic annual shoots were compared, distinguishing several categories of branches. The merits of this method are discussed in relation to more commonly used global indicators (mean number of branches, branching density, etc.) for understanding plant functioning.
MATERIALS AND METHODS
Plants and study site
Trees were grown from acorns collected from a stand in the Nabas forest (Pyrénées atlantiques, south‐western France). They spent a year in the nursery before being planted out in February 1992 at an experimental site in south‐western France (for a detailed description see Guérard et al., 2001). This study focuses on the branching pattern of growth units formed in 1994 on the main axis of the 4‐year‐old trees. One hundred and twenty trees from four plots planted at the same density (2 m spacing between trees) were used. The site was weeded regularly. Half of the trees were treated with fertilizer in the year they were transplanted, whereas the other half were not given any treatment. Preliminary studies based on a method of model comparison (Guédon and Costes, 1999) showed no marked difference between fertilized and non‐fertilized trees in terms of the branching patterns of growth units formed in 1994. This is consistent with other studies at the same experimental site which showed that fertilization did not have any significant effect on tree growth, mean number of branches borne or nutritional status since the trees were growing on rich agricultural soil (Guérard et al., 2001). Thus, in this study, results for all trees were analysed together.
Experimental protocol
Protocol and parameters measured.
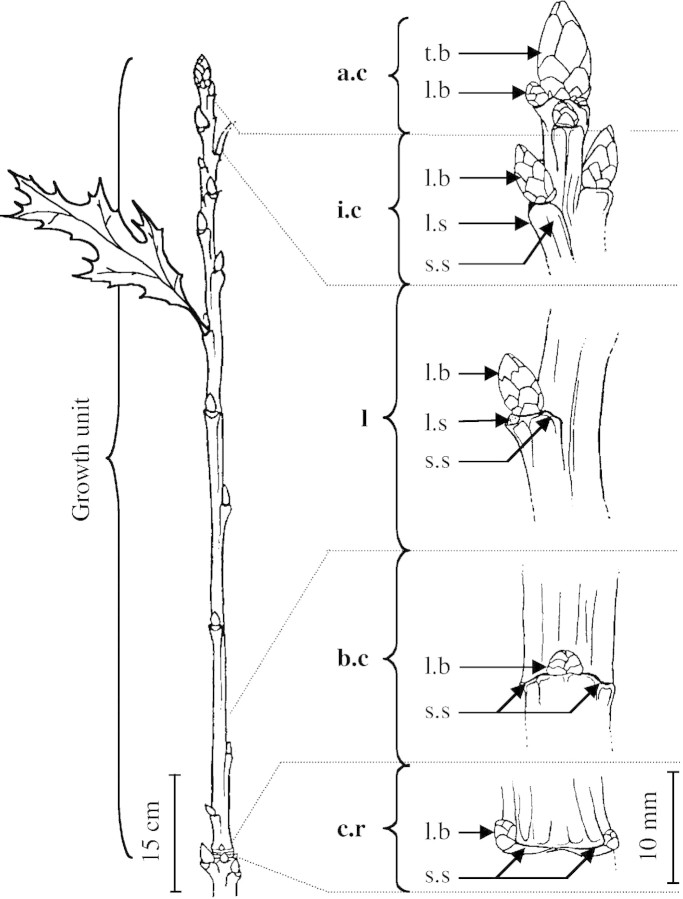
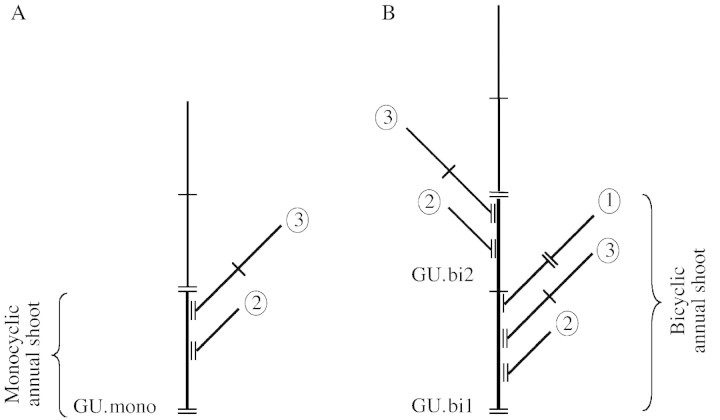
In red oak, a growth unit (i.e. the portion of the axis that develops during an elongation period) is formed by a succession of nodes separated by internodes and successively associated from the proximal to the distal part by: a series of cataphylls; a series of foliage leaves; and a series of cataphylls or foliage leaves with a small limb. Each of these organs bears a lateral bud (Fig. 1). During the winter of 1995/96, growth units of the annual shoots on the main axis formed in 1994 were measured. These a posteriori observations were made possible by the recognition of morphological markers resulting from tree growth (cataphyll scars in rings at the point at which growth halted, leaf scars, etc.). Annual shoots that elongate in a single growth stage during the course of a growth season are monocyclic and comprise a single growth unit, designated here by GU.mono (Fig. 2A). If growth takes place in two stages in a year, then the annual shoot is said to be bicyclic, and comprises a spring growth unit designated GU.bi1 and a summer growth unit designated GU.bi2 (Fig. 2B) (Heuret et al., 2000; Guérard et al., 2001). The end point of growth units in polycyclic annual shoots (intra‐annual interruption of growth) are distinguished from those of annual shoots (interannual interruption of growth) by a smaller number of cataphyll scars. A distinction is also made between different types of branches from the number of cataphyll scars at the point of insertion with the main axis. In most cases, after a growth unit is established a lateral bud forms which, after a period of dormancy, produces a branch known as a proleptic branch (Bell, 1991). Proleptic branches are either produced in the same year (one‐cycle‐delayed branches) or the following year (1‐year‐delayed branches). Lateral branches may sometimes develop directly from a lateral meristem without latent lateral bud formation (sylleptic branches; Bell, 1991). Sylleptic branches lack cataphyll scars at the point of insertion on the bearing axis. One‐year‐delayed branches differ from one‐cycle‐delayed branches as they possess many more cataphyll scars at the point of insertion. GU.mono generally bear only 1‐year‐delayed branches, while GU.bi1 bear one‐cycle‐delayed and/or 1‐year‐delayed branches, and GU.bi2 bear 1‐year‐delayed branches and/or sylleptic branches (Fig. 2) (Nicolini et al., 2000; Guérard et al., 2001).
Fig. 1. Structure of a red oak growth unit and description of the different scars. a.c, Apical cataphylls; i.c, intermediate cataphylls; l, leaves; b.c, basal cataphylls; c.r, cataphylls in ring; t.b, terminal bud; l.b, lateral bud; l.s, leaf (or leaf scar); s.s, stipule (or stipule scar).
Fig. 2. Different types of branches were considered in the construction of branching sequences for growth units of monocyclic annual shoots (GU.mono; A), and first (GU.bi1) and second (GU.bi2) growth units of bicyclic annual shoots (B). One‐cycle‐delayed branches (1) were found solely on GU.bi1, while 1‐year‐delayed mono‐ (2) or polycyclic (3) branches were found on all types of GU. Short line represents intra‐annual interruption of growth; two short lines represent interannual interruption of growth.
The following were recorded for each growth unit: (1) length from the first cataphyll at the base of the growth unit to the first cataphyll of the next growth unit (to the nearest 0·5 cm); (2) total number of nodes (associated with internodes more than 1 mm long); (3) type of leaf organ (cataphyll/foliage leaf) associated with each node; (4) type of axillary production associated with each node, (a) bud (a distinction was made between buds that had fallen off or were damaged—considered to be dead buds—and those that were still present and visibly alive), (b) sylleptic branch, (c) one‐cycle‐delayed branch, (d) 1‐year‐delayed branch whose 1995 annual shoot was monocyclic and (e) 1‐year‐delayed branch whose 1995 annual shoot was polycyclic. In red oaks, polycyclism corresponds to an increase in the size of annual shoots (Dickson, 1994; Guérard et al., 2001). This differentiation between 1‐year‐delayed monocyclic and polycyclic branches was made to identify the most vigorous branches on the bearing annual shoot; (5) whether the apex was alive or dead. Additional parameters deduced from the above were: (6) the total number of branches per growth unit, regardless of type; and (7) mean length of internodes on each growth unit (calculated by dividing the length of the growth unit by the number of nodes).
Because the branching pattern may be affected by whether the apex is alive or dead (Ward, 1964; Harmer, 1993; Harmer and Baker, 1995; Chaar et al., 1997; Nicolini et al., 2000), growth units with a necrotic apex were excluded from the analysis. Only six GU.bi2 in our sample showed sylleptic branches; as this sample was too small to be analysed, these growth units were also excluded from the analysis. From the initial sample of 28 GU.mono and 86 GU.bi1/bi2, 24 GU.mono, 68 GU.bi1 and 55 GU.bi2 were included in the analysis.
Sequence construction.
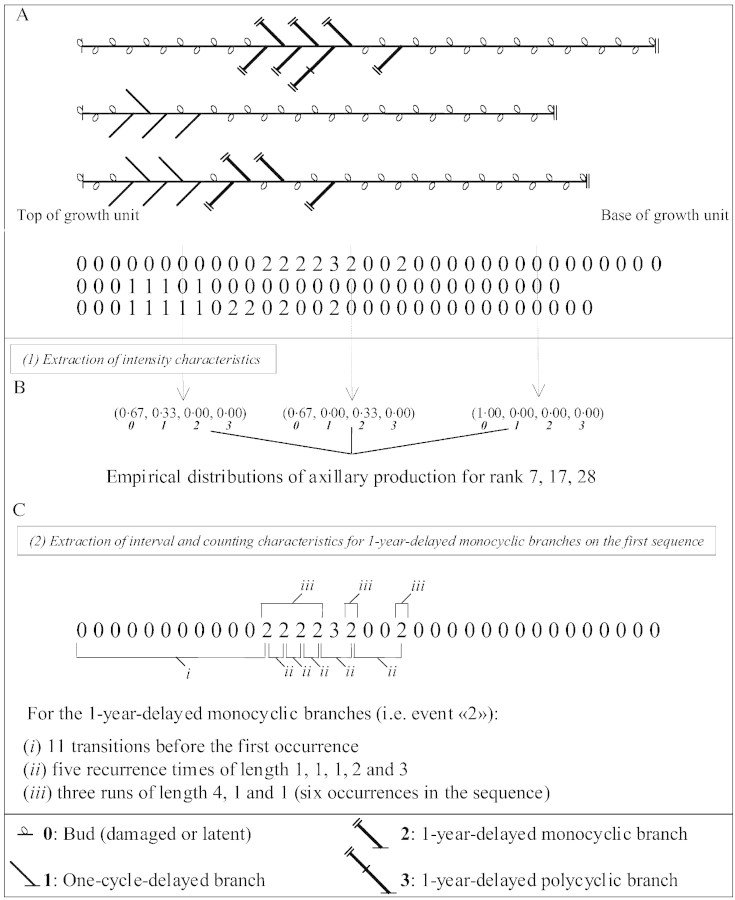
Since both one‐cycle‐delayed and 1‐year‐delayed branches are organized from the top of the growth unit, the growth units studied were described node by node from the top to the base. For each node, the type of axillary production was recorded as: damaged or latent bud (0), one‐cycle‐delayed branch (1), 1‐year‐delayed monocyclic branch (2) and 1‐year‐delayed polycyclic branch (3) (see Fig. 3 based on an example of three sequences measured on GU.bi1). Henceforth, the different types of axillary production will be termed ‘event’.
Fig. 3. A, Descriptions of axillary production distributions on three growth units (measured on GU.bi1 in this example) in the form of sequences of events. Coded elements include: bud (0); one‐cycle‐delayed branch (1); 1‐year‐delayed monocyclic (2) and 1‐year‐delayed polycyclic branch (3). Values are indexed according to the rank of the node bearing the branch, taken from the tip to the base of the growth unit. B, ‘Intensity’: the frequency of different events (i.e. bud, one‐cycle‐delayed branches or 1‐year‐delayed monocyclic and polycylic branches) is extracted for the different positions (node rank) along the growth unit from the apex. C, ‘Interval’ (time until the first occurrence, recurrence time, sojourn time) and ‘Counts’ (number of occurrences or number of runs per sequence) can be extracted for specific events.
Methods of analysis
Exploratory analysis of the branching sequences.
The frequency distribution of a numerical variable can be characterized by measures of location (mean, median, mode), dispersion (variance, standard deviation, mean absolute deviation) or shape (coefficient of skewness, coefficient of kurtosis). The characteristics of a sample of sequences are not numerical values, such as for a frequency distribution, but instead take the form of families of frequency distributions (Guédon et al., 2001). These characteristics can be divided into the three following categories (Fig. 3): (1) intensity, the empirical event distribution is extracted for each successive node rank from a sample of sequences. Changes in distribution of events as a function of the node rank make it possible to evaluate the dynamics of the phenomenon studied, such as the locations of the main transient phases between homogeneous zones; (2) interval, for each possible event, the three following types of interval can be extracted from a sample of sequences, (a) time up to the first occurrence of an event (or first passage time in an event), i.e. the number of transitions (or internodes) before the first occurrence of this event, (b) recurrence time (i.e. the number of internodes starting from a given event until its subsequent occurrence) and (c) sojourn time (= ‘run length’ of an event, i.e. the number of successive occurrences of a given event); and (3) counts—the number of occurrences of a given pattern are extracted for each sequence. Thus, the two patterns of interest correspond to the occurrence of a given event as well as the ‘run’ (or clump) of a given event, as defined above.
Families of characteristic distributions can play different roles in this kind of analysis. The empirical probabilities of the events as a function of the node rank (intensity) give an overview of process ‘dynamics’. This overview is complemented for the initial transient phases by the distributions of the time up to the first occurrence of an event. Local patterns in the succession of events are expressed in (a) recurrence time distributions, (b) sojourn time distributions and (c) the distributions of the number of runs of an event per sequence. These three types of characteristic distribution can help to highlight otherwise scattered or aggregate distributions of a given event along sequences.
Presentation of hidden semi‐Markov chains.
Branching sequences observed in red oak may be viewed as a succession of homogeneous zones or segments in which composition properties (in terms of types of axillary production) do not change substantially within each zone but do change between zones. The composition of each zone may be defined by a single type of axillary production, but more often combines different types of axillary production.
The statistical model used here is the hidden semi‐Markov chain and its structure expresses very directly this structuring of the branching sequences. A first level represents both the succession of zones and the length of each zone (three sequences measured on GU.bi1 and divided into zones are presented in Fig. 4A). Each zone is represented by a mathematical object called a state. The different states are connected by transitions with associated probabilities that sum to one for the transitions leaving a given state (probabilities of moving from state i at rank n – 1 to state j at rank n). Initial probabilities are also needed to select the initial states (probabilities of being in a given state at the beginning of the sequence). An occupancy distribution, which represents the length of the corresponding zone in terms of number of nodes, is associated with each state, except the final absorbing state. The particular case of the final absorbing state (a state such that after entering it, the process stays there forever) requires a particular convention since the time spent in this state (which is infinite) cannot be represented by an explicit state occupancy distribution. The introduction of absorbing states is a requirement for a correct specification of semi‐Markov chains as true generalizations of Markov chains. This point, which is beyond the scope of this paper, is discussed in detail in Guédon (2003). A second level consists of associating with each state a discrete distribution representing the axillary productions observed within the zone.
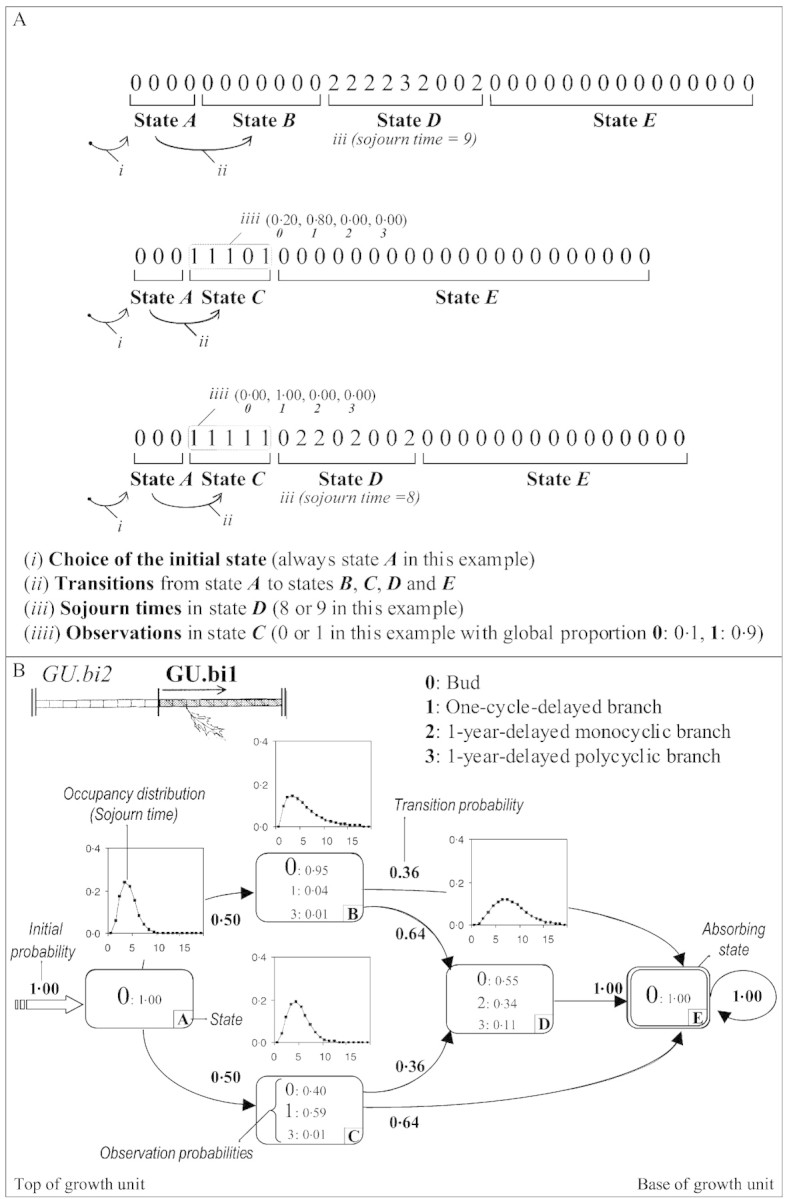
Fig. 4. A, Example of three sequences (measured on GU.bi1 in this example) divided into zones on the basis of a hidden semi‐Markov chain. The different model parameters are shown (initial probabilities, transition probabilities, sojourn time distribution, observation probabilities). B, Hidden semi‐Markov chain estimated from GU.bi1.
The following convention was used to represent the estimated hidden semi‐Markov chains (the model estimated from the branching sequences of GU.bi1 is presented in Fig. 4B): each state is represented by a box which is labelled with an upper‐case letter in its lower right‐hand corner. Boxes representing transient states have a single line border, whereas those corresponding to the final absorbing state have a double line border. The possible transitions between states are represented by arcs, with their probabilities noted alongside. Thick arcs entering states indicate initial states. The attached initial probabilities are noted nearby. The occupancy distributions are shown above the corresponding boxes. The possible axillary productions observed in each zone are indicated inside the boxes, with font sizes being roughly proportional to the observation probabilities.
Model building.
The core of the proposed data analysis methodology consists of iterating an elementary loop of model building until a satisfactory result is obtained. This elementary loop decomposes into the three following stages. (1) Model specification. This stage consists mainly of determining the number of states of the embedded semi‐Markov chain, i.e. the number of homogeneous zones, and making hypotheses on their possible succession along growth units on the basis of characteristic distributions extracted from the sample of sequences (especially intensity characteristics). Such structural constraints are expressed by prohibiting transitions, i.e. by setting the corresponding probabilities to zero. Using the same principle, constraints can also be expressed on the initial probabilities and the observation probabilities. For instance, the unbranched character of the initial state and final absorbing state is the result of an initial hypothesis. (2) Model inference. The maximum likelihood estimation of parameters of a hidden semi‐Markov chain requires iterative optimization techniques which are applications of the Expectation–Maximization (EM) algorithm (Guédon, 2003). (3) Model assessment. The accuracy of the estimated model is mainly evaluated by the fit of characteristic distributions computed from model parameters to the corresponding empirical characteristic distributions extracted from the observed sequences (Guédon, 1999, 2003). Assessment may also rely on the optimal segmentation of the observed sequences in successive zones using the estimated model (see below).
Segmentation of the observed sequences.
For the biological interpretation of the statistical modelling results, it is often useful to determine the optimal segmentation of the observed sequences in successive zones (Fig. 4A). This optimal segmentation can be obtained by using a dynamic programming method usually referred to as the Viterbi algorithm (Guédon, 2003).
RESULTS
Main characteristics of growth units
Growth units of monocyclic annual shoots (GU.mono) were generally longer than the first growth units of bicyclic annual shoot (GU.bi1), with second growth units of bicyclic annual shoot (GU.bi2) falling somewhere in between (Table 1). GU.bi2 had fewer nodes than GU.mono or GU.bi1, which were not significantly different from each other. Internodes were generally shortest on GU.bi1, intermediate on GU.mono and longer on GU.bi2. GU.bi1 had fewer branches than GU.mono and GU.bi2, which were not significantly different from one another.
Table 1.
Mean length, mean internode length and mean number of nodes and branches for different growth units (GU)
| GU.mono (n = 24) | GU.bi1 (n = 68) | GU.bi2 (n = 55) | |
| GU length (cm) | 53·6a | 44·0b | 51·3ab |
| No. of nodes | 29·9a | 28·9a | 21·1b |
| Internode length (cm) | 1·79a | 1·49b | 2·34c |
| No. of branches | 9·4a | 3·2b | 10·0a |
Comparisons (Mann–Whitney–Wilcoxon test) of distributions on which the means are based are represented by superscripts. For a given characteristic, different superscripts correspond to distributions that are significantly different at the 95 % threshold.
Correlations between length, number of nodes and number of branches on growth units
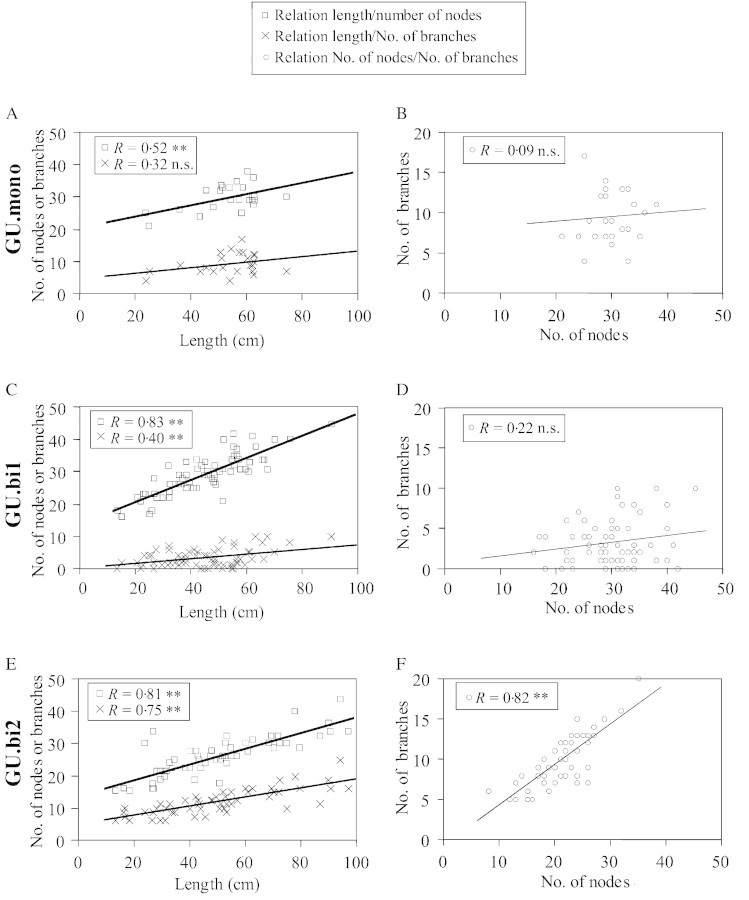
The length of a growth unit and its number of nodes were positively correlated, irrespective of type (Fig. 5A, C and E). No other significant correlations were noted between the variables measured for GU.mono. In GU.bi1 and GU.bi2, a positive correlation was noted between the number of branches and the length of the growth unit (Fig. 5C and E). GU.bi2 also showed a significant positive correlation between the number of nodes and the number of branches (Fig. 5F).
Fig. 5. Correlation between the total number of nodes and the length (in cm) of the growth unit, the total number of branches borne by the growth unit and its length (in cm), and the total number of branches borne by the growth unit and its total number of nodes for GU.mono (A and B), GU.bi1 (C and D) and GU.bi2 (E and F).
Structure of the estimated hidden semi‐Markov chains
All the estimated models begin with an initial state, A, which covers four nodes on average and corresponds to buds associated with very short internodes at the tip of the growth unit. In addition, the models all end with an absorbing state, corresponding to an unbranched basal zone. The unbranched character of the initial and the final states corresponds to initial hypotheses (see ‘Model building’). The structure of the model between these two common initial and final states is described below.
Growth units of monocyclic annual shoots (GU.mono).
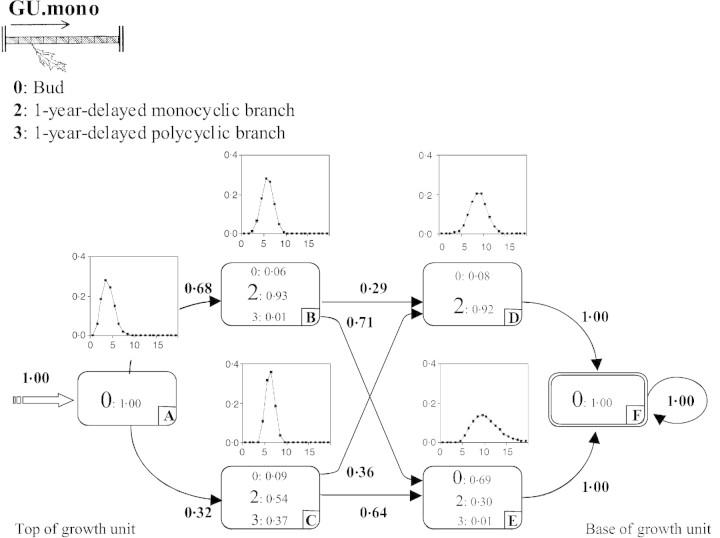
The model estimated from the branching sequences is composed of six states (Fig. 6). The initial state A is followed by two successive pairs of parallel states (B or C, then D or E). When two states occur in parallel, their estimated occupancy distributions are similar. They can thus be considered as two distinct modalities of a zone covering, on average, six nodes for states B and C, and nine nodes for states D and E. Growth units where the tip (generally covering six nodes) had only 1‐year‐delayed monocyclic branches (state B) were distinguished from those that had a high proportion of 1‐year‐delayed polycyclic branches (state C). Likewise, growth units where this systematically branched initial zone was followed by 1‐year‐delayed monocyclic branches (state D) were distinguished from growth units whose initial zone was followed by a majority of buds mixed with some 1‐year‐delayed monocyclic branches (state E). The estimated probabilities (p) of transition leading to state D were similar (pBD = 0·29 and pCD = 0·36), as were those leading to state E (pBE = 0·71 and pCE = 0·64). This suggests that the modalities reflected in states D and E are independent of those reflected in states B and C.
Fig. 6. Hidden semi‐Markov chain estimated from GU.mono branching sequences.
First growth units of bicyclic annual shoots (GU.bi1).
The model estimated from the branching sequences is composed of five states (Fig. 4B). The initial state A is followed by two parallel states, B and C, whose estimated occupancy distributions are similar. They constitute two distinct modalities of a zone covering, on average, six nodes, and distinguish growth units with one‐cycle‐delayed branches at their tip (state C) from those with an unbranched composed instead of buds (state B). One‐year‐delayed branches, which are primarily represented in state D, were situated below this first zone. They were not found systematically, and transitions from states B and C to the final unbranched absorbing state E are possible (pBE = 0·36 and pCE = 0·64). One‐year‐delayed polycyclic branches do not necessitate the introduction of a specific state since they are few in number and are mixed with monocyclic 1‐year‐delayed branches in state D.
A distinction can thus be made between four types of growth unit: (1) unbranched growth units; (2) growth units with only one‐cycle‐delayed branches; (3) growth units with only 1‐year‐delayed branches; and (4) growth units with both types of branch. The estimated transition probabilities leading to state D are quite different (pBD = 0·64 and pCD = 0·36), which suggests that if the growth unit develops one‐cycle‐delayed branches (state C, 50 % of cases), there is less chance that it will develop 1‐year‐delayed branches (state D) than if it does not develops one‐cycle‐delayed branches (state B).
Second growth units of bicyclic annual shoots (GU.bi2).
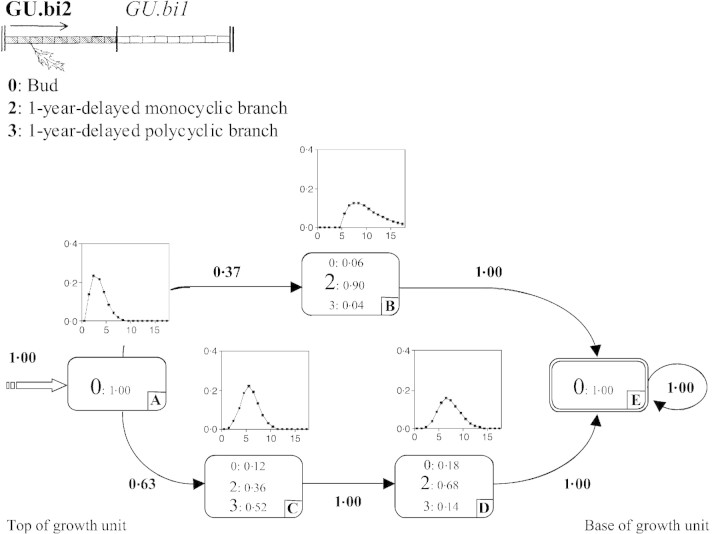
The model estimated from the branching sequences is composed of five states (Fig. 7). The initial state A is followed by either state B or the series of states C and D. State C corresponds to a zone covering an average of five nodes where a majority of 1‐year‐delayed polycyclic branches are observed. States B and D primarily contain 1‐year‐delayed monocyclic branches. The model thus reveals two categories of growth unit: (1) those that possess 1‐year‐delayed polycyclic branches towards the tip and 1‐year‐delayed monocyclic branches lower down (succession of states C and D, 63 % of cases); and (2) those that possess only 1‐year‐delayed monocyclic branches (state B, 37 % of cases).
Fig. 7. Hidden semi‐Markov chain estimated from GU.bi2 branching sequences.
Comparison of branching structures for the different types of growth units
Both model parameters and characteristic distributions can help to highlight similarities and differences between branching structures of different types of growth units.
Branches were more often found towards the tip, and this was true for all types of growth unit. The maximum probability of observing a branched node occurred at around the seventh node below the apex; this probability was zero after the 26th node (Fig. 8).
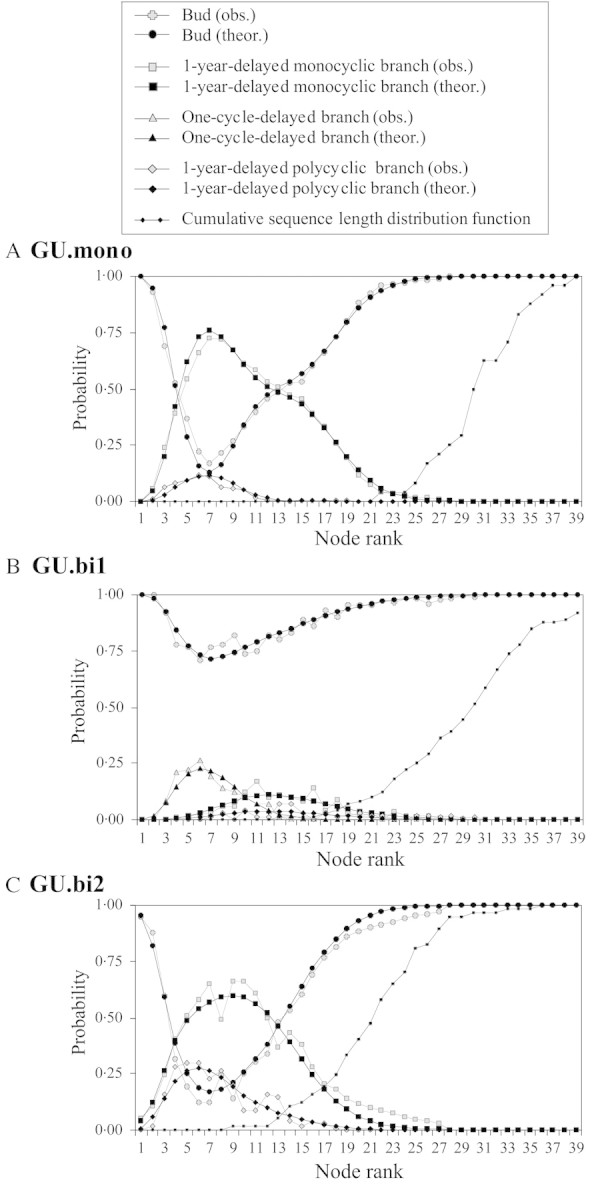
Fig. 8. Probability of the different types of axillary production in relation to node rank (‘intensity’) for GU.mono (A), GU.bi1 (B) and GU.bi2 (C). The cumulative distribution function of sequence length (directly deduced by summation of the frequency distribution) is shown as a dotted curve. obs., Observed; theor., theoretical.
GU.mono (Fig. 8A) and GU.bi2 (Fig. 8C) showed very similar profiles. One‐year‐delayed branches were mostly found on the apical part of the growth unit. Both types of growth unit showed a smaller proportion of 1‐year‐delayed polycyclic branches, and their distribution extended less towards high‐ranking nodes than for 1‐year‐delayed monocyclic branches. Such branches were more numerous and their distribution spread more towards nodes with a high rank on GU.bi2 than on GU.mono.
GU.bi1 (Fig. 8B) were far less branched than GU.mono or GU.bi2. One‐cycle‐delayed branches were preferentially found towards the tip, and 1‐year‐delayed branches were found below those delayed by one cycle. Few 1‐year‐delayed polycyclic branches were found, and these occupied the same zone as 1‐year‐delayed monocyclic branches.
GU.mono and GU.bi1 showed almost no node rank corresponding to a possible sequence length where a branch can be observed (see the cumulative distribution functions of sequence length in Fig. 8A and B). This was not the case for GU.bi2 where, for instance, 20 % of the sequences consisted of less than 17 nodes, while for this rank, in the sample as a whole, the probability of observing a branched node was 0·25.
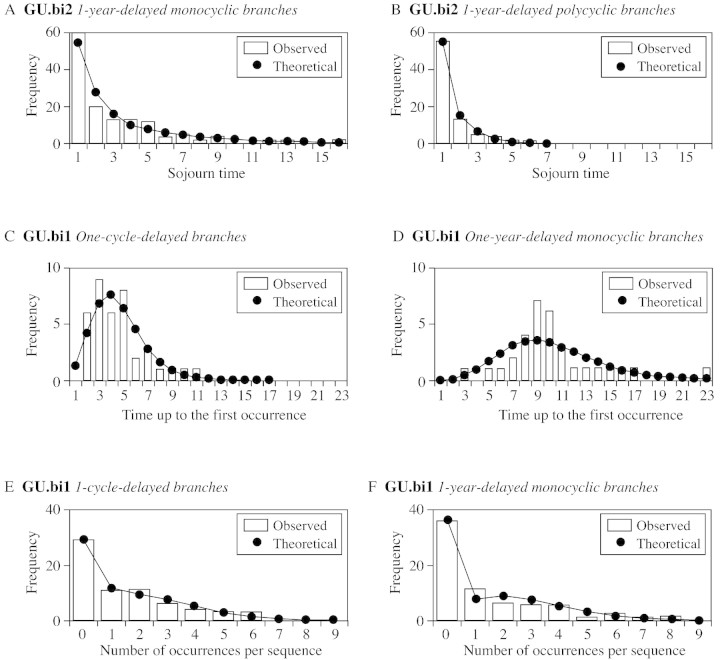
GU.bi2 generally showed numerous 1‐year‐delayed branches preceded and followed by a latent bud (run length = 1; Fig. 9A and B). Moreover, runs of 1‐year‐delayed polycyclic branches (Fig. 9B) were shorter than those of 1‐year‐delayed monocyclic branches (Fig. 9A). In GU.bi1, the first one‐cycle‐delayed branch is generally located, on average, at the fifth node below the apex, while the first one‐year‐delayed monocyclic branch is located, on average, at the tenth node below the apex (Fig. 9C and D). When considering the number of occurrences per sequence for the one‐cycle‐delayed and 1‐year‐delayed branches, the most frequent case was the absence of branches (Fig. 9E and F). The average number of one‐cycle‐delayed branches was smaller than the average number of 1‐year‐delayed branches (1·49 vs. 1·79, or 2·63 vs. 3·53 if the growth unit carrying at least one branch of the considered type is taken into account).
Fig. 9. Sojourn time distributions for 1‐year‐delayed monocyclic (A) and polycyclic (B) branches on GU.bi2; time until first occurrence for one‐cycle‐delayed (C) and 1‐year‐delayed (D) monocyclic branches on GU.bi1; number of occurrences per sequence distribution for one‐cycle‐delayed (E) and one‐year‐delayed (F) monocyclic branches on GU.bi1.
Proportion of cataphylls and dead buds associated with each model state
On the basis of the optimal state sequences computed from model parameters (see ‘Segmentation of the observed sequences’), it is possible to extract the empirical distribution for leaf type (with the two outcomes, cataphyll and foliage leaf) or the state of the buds (alive or dead) for each state of the model.
The initial state A was characterized by a majority of nodes associated with cataphylls (approx. 70 % on average) (Table 2). A high proportion of nodes were associated with cataphylls in the final state F (GU.mono, 34·8 %) or E (GU.bi1, 21·9 % and GU.bi2, 41·1 %). The intermediate states were characterized by nodes associated with foliage leaves.
Table 2.
Percentage of cataphylls and foliage leaves associated with different model states for each type of growth unit
| GU.mono | GU.bi1 | GU.bi2 | ||||
| % cataphylls | % foliage leaves | % cataphylls | % foliage leaves | % cataphylls | % foliage leaves | |
| State A | 68·6 | 31·4 | 77·3 | 22·7 | 61·1 | 38·9 |
| State B | 0·0 | 100 | 10·6 | 89·4 | 0·0 | 100 |
| State C | 0·0 | 100 | 0·7 | 99·3 | 0·0 | 100 |
| State D | 0·0 | 100 | 0·0 | 100 | 0·5 | 100 |
| State E | 0·0 | 100 | 21·9 | 78·1 | 41·1 | 58·9 |
| State F | 34·8 | 65·2 | – | – | – | – |
For the growth unit as a whole, buds associated with the intermediate states were generally damaged (mean = 93 %) at the time our study was conducted (Table 3). However, the proportion of damaged buds was smaller in the initial and final states than in the intermediate states. GU.bi1 differed in this respect, with 17·2 % damaged buds in state A compared with 40·6 and 52·7 % in GU.mono and GU.bi2, respectively. Moreover, GU.bi2 showed a slightly higher percentage of damaged buds associated with the final absorbing state than GU.mono and GU.bi1 (42·4 % compared with 27·7 and 24·5 %, respectively).
Table 3.
Percentage of damaged and latent buds for all the ‘bud: (0)’ observations associated with the different states of the models for the three types of growth units considered
| GU.mono | GU.bi1 | GU.bi2 | ||||
| Damaged buds (%) | Latent buds (%) | Damaged buds (%) | Latent buds (%) | Damaged buds (%) | Latent buds (%) | |
| State A | 40·6 | 49·4 | 17·2 | 82·8 | 52·7 | 47·3 |
| State B | 100·0 | 0·0 | 72·1 | 29·9 | 100·0 | 0·0 |
| State C | 100·0 | 0·0 | 85·3 | 14·7 | 92·9 | 7·1 |
| State D | 100·0 | 0·0 | 85·2 | 14·8 | 97·1 | 2·9 |
| State E | 100·0 | 0·0 | 24·5 | 75·5 | 42·4 | 57·6 |
| State F | 27·7 | – | – | – | – | – |
Length of branched zones in relation to the total number of nodes in the sequences
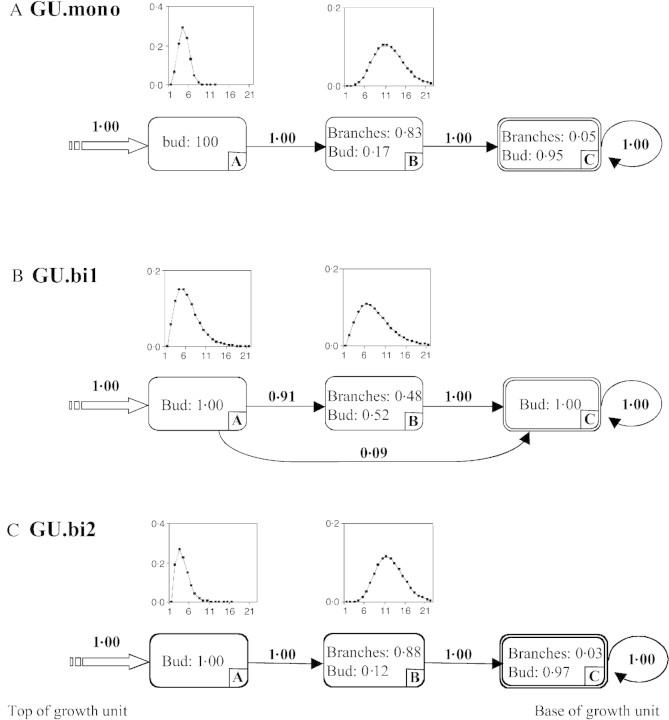
Three state hidden semi‐Markov chains were estimated for each sample of sequences. These simplified ‘left–right’ models are composed of an initial unbranched state, a median branched state and a final unbranched state (Fig. 0). The objective of the statistical modelling was not to correctly fit the data, as illustrated before, but simply to use the models as tools for optimal extraction of the basal and apical unbranched zones and the median branched zone (see ‘Segmentation of the observed sequences’). In this new context, no distinction was made between the different types of branch (1‐year‐delayed branches are regrouped with one‐cycle‐delayed branches).
Fig. 10. Hidden semi‐Markov chain estimated from the branching sequences of GU.mono (A), GU.bi1 (B) and GU.bi2 (C). The different types of branch are not differentiated, and only the branched/unbranched pattern is taken into account.
For GU.mono and GU.bi2, the two models were similar for both the occupancy distributions and the observation probabilities associated with the states. For GU.bi1, some of which were not branched (9 %), a transition is possible from initial state A to absorbing state C. In state B an equivalent proportion of buds and branches was observed.
The number of nodes for the segments corresponding to states A, B and C was compared with the total number of nodes in the sequence considered (Fig. 1). For all three types of growth unit, the total number of nodes of the growth unit was not correlated with the number of nodes in the unbranched apical zone, while a positive correlation was noted with the number of nodes in the unbranched basal zone (Fig. 1A–C). Moreover, a positive correlation was noted for GU.bi2 between the total number of nodes of the growth unit and the number of nodes in the branched zone. This was not the case for GU.mono and GU.bi1.
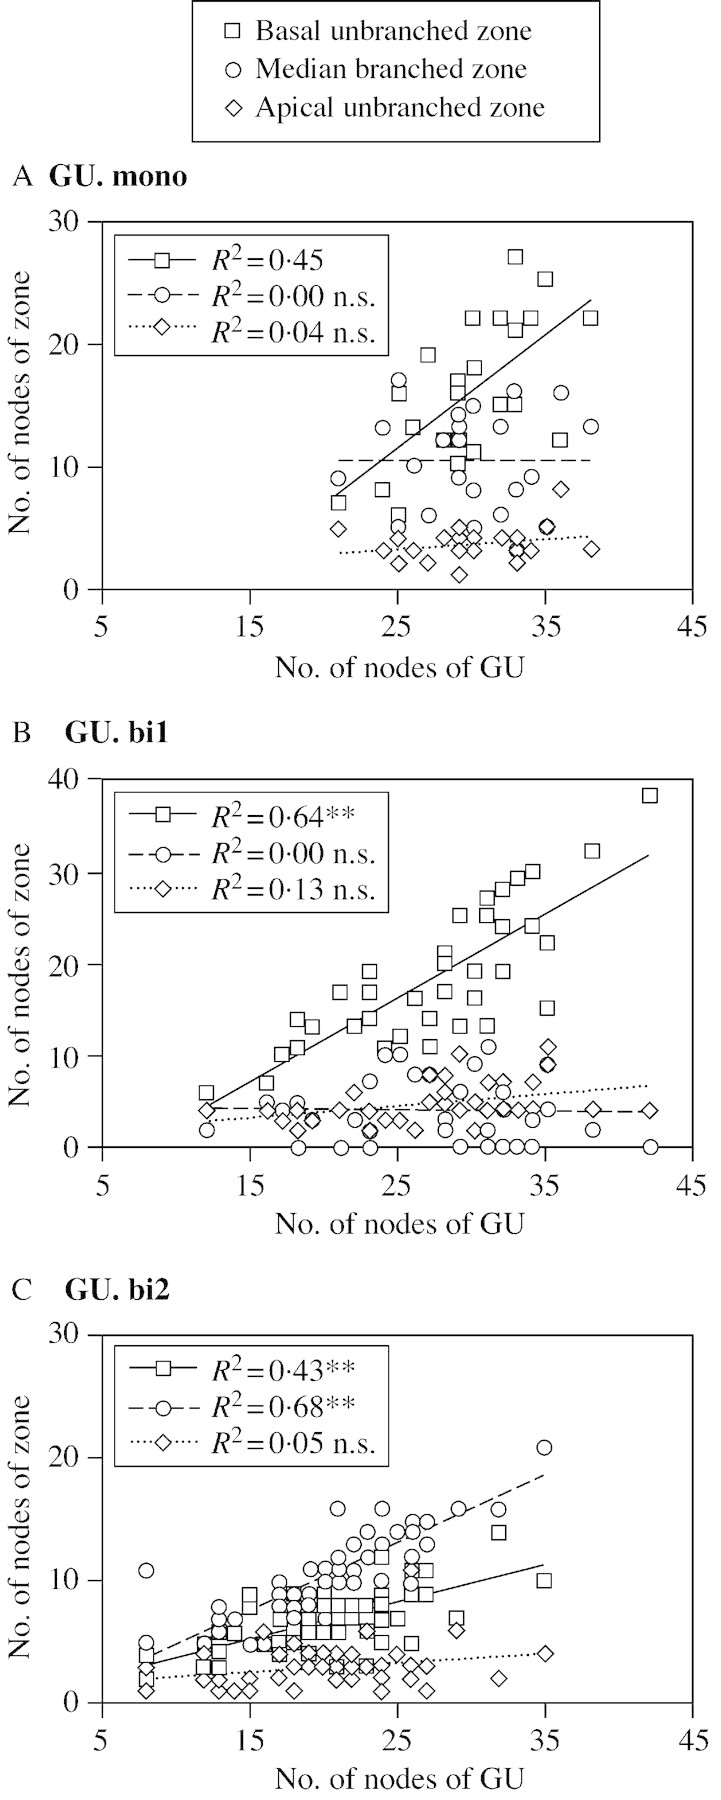
Fig. 11. Correlation between the number of nodes in segmented zones corresponding to states A (apical unbranched zone), B (median branched zone) and C (basal unbranched zone) of the models in Fig. 10, with the total number of nodes in the growth unit considered for GU.mono (A), GU.bi1 (B) and GU.bi2 (C).
DISCUSSION
As emphasized in previous studies conducted on various species of the genus Quercus (Dickson, 1994; Collin et al., 1996; Collet et al., 1997; Heuret et al., 2000; Nicolini et al., 2000; Guérard et al., 2001), mean values for the different variables measured show that spring growth units (GU.mono and GU.bi1) are similar in terms of growth variables (length, number of nodes), while growth units established later in the year (GU.mono and GU.bi2) are the most branched. This similarity between GU.mono and GU.bi2 is also seen when considering the frequency of the different types of branch as function of the node rank (see Fig. 7). However, the segmentation obtained from simplified models indicates a marked difference between GU.mono and GU.bi2 concerning the ability of the zones to scale up with the total number of nodes of the growth unit. In GU.mono, as in GU.bi1, the length of the branched zone is stable, irrespective of the total number of nodes in the growth unit. However, in GU.bi2, the longer the branched zone, the greater the number of nodes in the growth unit. This property of GU.bi2 is also suggested when comparing the overlap between the cumulative distribution function of sequence length and the probabilities of branching as a function of node rank (Fig. 8). If we consider that the probability of branching is independent of the total number of nodes in the growth unit, some GU.bi2 could be branched right down to the base; however, this is never observed. This disproves the independence hypothesis. Since some zones may scale up (or down) as a function of sequence length, while the lengths of other zones are unrelated to sequence length, it is difficult to interpret the variability of common indicators such as the average number of branches per linear metre or per node.
The mechanism(s) responsible for the difference outlined above between GU.mono and GU.bi2 is not yet fully understood, and here we shall simply underline some differences between these two types of growth unit to point to new areas of research. As for sessile oak (Fontaine et al., 1999), GU.bi2 can be made up of a preformed and a neoformed part, whereas the spring growth units (GU.mono and GU.bi1) are entirely preformed (Bettefort, pers. comm.). Furthermore, in other genera, such as Actinidia Lindl., it has been shown that the presence of neoformed organs may affect the branching pattern (Seleznyova et al., 2002). In addition, the different organs of the spring growth unit remain in the winter bud for several months, while the GU.bi2 organs remain in the summer transient bud for only a short time. During these periods, interactions between foliar primordia within the bud certainly have an effect on the morphology of the future growth unit (Champagnat et al., 1986). Breaking of the spring growth unit occurs over a period of about 15 d while breaking of GU.bi2 is possible over a 2‐month period, which may introduce more variability.
The preferential location of polycyclic branches towards the tip of certain GU.mono and GU.bi2 reflects an acropetal gradient of increasing vigour from the base to the tip of the growth unit, with polycyclism generally being associated with an increase in annual shoot size (Dickson, 1994; Guérard et al., 2001). This gradient is superimposed over the acrotony phenomenon characteristic of the Quercus genus (Caraglio and Barthélémy, 1997), with branching generally being concentrated at the tip of the growth unit.
For GU.bi1, several hypotheses have been put forward to explain the systematic location of 1‐year‐delayed branches below an initial zone of one‐cycle‐delayed branches or buds. During the summer, it is possible that all lateral buds in this first zone begin to swell, but a large number abort. In the following year, when the 1‐year‐delayed branches develop, the remaining viable meristems are inevitably below this first zone primarily comprising one‐cycle‐delayed branches (characterized by state C, Fig. 4B) or dead buds (characterized by state B, Fig. 4B). It is noteworthy that development of 1‐year‐delayed branches is favoured if the growth unit does not possess any one‐cycle‐delayed branches, and that contrary to GU.mono and GU.bi2, there is no distribution gradient between 1‐year‐delayed monocyclic and polycyclic branches. This first hypothesis fits well with observations made by Harmer (1991), who mentions a 50 % abortion rate for all buds that had begun to swell on the spring growth unit of Quercus petraea. At the time our study was conducted, in the winter of 1995/96, 72 % of buds associated with this zone were missing or damaged. We can assume that the remaining 28 % of the buds were dormant and still had the potential to develop (branches delayed by more than a year). However, this hypothesis seems unlikely since, in most broad‐leaved trees, this type of bud—which gives rise to suckers or epicormic branches—is seen in the axil of the cataphylls found at the points where growth stops (Gill, 1971; Harmer, 1991; Remphrey and Davidson, 1991). In our case, they apparently correspond to the buds associated with the initial and final states of the models. Monitoring growth and dissecting buds and/or using staining techniques to check the cellular activity of the meristems during the summer should confirm or disprove these hypotheses.
The analysis of branching sequences by hidden semi‐Markov chains provided new information about branching pattern and its variability. The main merits of this method are that it: (1) identifies homogeneous zones in the growth units as a whole and can be used to detect the aggregate nature of an event (for instance, 1‐year‐delayed polycyclic branches are grouped at the tip of GU.mono and GU.bi2); (2) detects zone‐scaling phenomena (for example, in GU.mono, the unbranched basal zone scales up with the total number of nodes, while the branched zone remains stable); (3) highlights patterns associated with a given zone (for example, in GU.bi1, an initial zone of six nodes may be made up of either one‐cycle‐delayed branches or buds); and (4) highlights exclusion, compensation or independence phenomena between the successive zones (for instance, 1‐year‐delayed branches in GU.bi1 develop more readily if there are no one‐cycle‐delayed branches present).
The identification of a branching structure provides the foundation for a study of the mechanisms underlying the establishment of such a structure. Zones in growth units must be considered if gradients are to be detected. Harmer (1991) and Buck‐Sorlin and Bell (2000a, b) made a distinction for growth units of Quercus petraea between buds grouped in whorls at the tip of the growth units (‘whorl’) and other buds on more proximal parts (‘inter‐whorl’), in order to evaluate the branching potentials of these two zones. Arbitrary separation into upper, median and lower thirds of the growth units is common when measuring the aptitude for dormancy of the lateral buds and levels of hormones, sugars and other substances assumed to affect growth (Brunel, 2001; Cook et al., 2001). Segmentation by hidden semi‐Markov chains can be used to locate zones with homogeneous morphological properties. Taking the dormancy potential of buds as an example, we believe that it is more relevant to measure this potential within identified zones, e.g. those in which one‐cycle‐delayed branches develop, rather than arbitrarily along the entire growth unit.
The method used shows that over and above the simple differences detected by global indicators, growth units differ in their organization and the types of branch they bear. Many morphological variations can be seen from one year to the next, and these reflect external constraints and the stage of development reached by the tree (Heuret et al., 2000; Guérard et al., 2001). Based on these results, analysing trees of various ages under different conditions should provide a better understanding of the flexibility of the branching process over time and in relation to the environment. Sampling different categories of axes within the overall architecture should also provide new information that will help to explain how the structure develops.
ACKNOWLEDGEMENTS
This work was conducted in the framework of EU project AIR3‐CT92‐0134. We thank Alain Cabanettes, Jérôme Willm and Pierre Trichet for their help in collecting field data, Sylvie Sabatier and Nick Rowe for constructive comments on the manuscript, and Helen Burford and Mark Jones for their assistance.
Supplementary Material
Received: 2 August 2002; Returned for revision: 21 October 2002; Accepted: 6 December 2002
References
- BellAD.1991. Plant form. An illustrated guide to flowering plant morphology. Oxford: Oxford University Press. [Google Scholar]
- BrunelN.2001. Étude du déterminisme de la préséance des bourgeons le long du rameau d’un an chez le pommier (Malus domestica (L.) Borkh.): approches morphologique, biochimique et moléculaire. PhD Thesis, University of Angers, France. [Google Scholar]
- Buck‐SorlinGH, Bell A.2000a Models of crown architecture in Quercus petraea and Q. robur: shoot lengths and bud numbers. Forestry 73: 1–19. [Google Scholar]
- Buck‐SorlinGH, Bell A.2000b Crown architecture in Quercus petraea and Q. robur, the fate of buds and shoots in relation to age, position and environmental perturbation. Forestry 73: 331–349. [Google Scholar]
- BurgeC, Karlin S.1997. Prediction of complete gene structures in human genomic DNA. Journal of Molecular Biology 268: 78–94. [DOI] [PubMed] [Google Scholar]
- CaraglioY, Barthélémy D.1997. Revue critique des termes relatifs à la croissance et à la ramification des tiges des végétaux vasculaires. In: Bouchon J, de Reffye P, Barthélémy D, eds. Modélisation et simulation de l’architecture des végétaux Science Update. Paris: INRA Editions, 11–87. [Google Scholar]
- ChaarH, Colin F, Leborgne G.1997. Artificial defoliation, decapitation of the terminal bud and removal of the apical tip of the shoot in sessile oak seedlings and consequences on subsequent growth. Canadian Journal of Forest Research 27: 1614–1621. [Google Scholar]
- ChampagnatP, Barnola P, Lavarenne S.1986. Quelques modalités de la croissance rythmique endogène des tiges chez les végétaux ligneux. In: Edelin C, ed. Naturalia Monspeliensia, Comptes rendus du Colloque International sur l’Arbre, Montpellier, 9–14 Septembre 1985, 279–302. [Google Scholar]
- ColletC, Colin F, Bernier F.1997. Height growth, shoot elongation and branch development of young Quercus petraea grown under different levels of resource availability. Annales des Sciences Forestières 54: 65–81. [Google Scholar]
- CollinP, Badot PM, Millet B.1996. Croissance rythmique et développement du chêne rouge d’Amérique, Quercus rubra L. cultivé en condition controlées. Annales des Sciences Forestières 53: 1059–1069. [Google Scholar]
- CookNC, Bellstedt DU, Jacobs G.2001. Endogenous cytokinin distribution patterns at budburst in Granny Smith and Braeburn apple shoots in relation to bud growth. Scientia Horticulturae 87: 53–63. [Google Scholar]
- CostesE, Guédon Y.1997. Modelling the sylleptic branching on one‐year‐old trunks of apple cultivars. Journal of the American Society for Horticultural Science 122: 53–62. [Google Scholar]
- CostesE, Guédon Y.2002. Modelling branching pattern on 1‐year‐old trunks of six apple cultivars. Annals of Botany 89: 513–524. [DOI] [PMC free article] [PubMed] [Google Scholar]
- DicksonRE.1994. Croissance en hauteur et polycyclisme chez le chêne rouge. In: Timbal J, Kremer A, Le Goff N, Nepveu G, eds. Le chêne rouge d’Amérique Paris: INRA Editions, 131–140. [Google Scholar]
- FontaineF, Chaar H, Colin F, Clément C, Burrus M, Druelle J‐L.1999. Preformation and neoformation of growth units on 3‐year‐old seedlings of Quercus petraeae Canadian Journal of Botany 77: 1623–1631. [Google Scholar]
- GillAM.1971. The formation, growth and fate of buds of Fraxinus americana L. in Central Mass. Harvard Forest Paper 20: 1–16. [Google Scholar]
- GodinC, Guédon Y, Costes E.1999. Exploration of plant architecture databases with the AMAPmod software illustrated on an apple‐tree hybrid family. Agronomie 19: 163–184. [Google Scholar]
- GodinC, Guédon Y, Costes E, Caraglio Y.1997. Measuring and analyzing plants with AMAP‐mod software. In: Michalewicz MT, ed. Plants to ecosystems—Advances computational life sciences, vol. I Collingwood: CSIRO Publishing, 53–84. [Google Scholar]
- GuédonY.1999. Computational methods for discrete hidden semi‐Markov chains. Applied Stochastic Models in Business and Industry 15: 195–224. [Google Scholar]
- GuédonY.2003. Estimating hidden semi‐Markov chains from discrete sequences. Journal of Computational and Graphical Statistics (in press). [Google Scholar]
- GuédonY, Costes E.1999. A statistical approach for analyzing sequences in fruit tree architecture. Acta Horticulturae 499: 281–288. [Google Scholar]
- GuédonY, Barthélémy D, Caraglio Y.1999. Analyzing spatial structures in forest tree architectures. In: Amaro A, Torné M, eds. Empirical and process‐based models for forest tree and stand growth simulation Lisbon: Ediçiões Salamandra, 23–42. [Google Scholar]
- GuédonY, Barthélémy D, Caraglio Y, Costes E.2001. Pattern analysis in branching and axillary flowering sequences. Journal of Theoretical Biology 212: 481–520. [DOI] [PubMed] [Google Scholar]
- GuérardN, Barthélémy D, Cabanettes A, Courdier F, Trichet P, Willm J.2001. Influence de la compétition herbacée sur la croissance et l’architecture de jeunes chênes rouges d’Amérique (Quercus rubra L. Fagaceae) en plantation. Annals of Forest Sciences 58: 395–410. [Google Scholar]
- HarmerR.1991. The effect of bud position on branch growth and bud abscission in Quercus petraea (Matt.) Liebl. Annals of Botany 67: 463–468. [Google Scholar]
- HarmerR.1993. Branching in young clonal oak. Annales des Sciences Forestières 50 (suppl. 1): 399–402. [Google Scholar]
- HarmerR. Baker C.1995. An evaluation of decapitation as a method for selecting clonal Quercus petraea (Matt) Liebl with different branching intensities. Annales des Sciences Forestières 52: 89–102. [Google Scholar]
- HeuretP, Barthélémy D, Nicolini E, Atger C.2000. Analyse des composantes de la croissance en hauteur et de la formation du tronc chez le chêne sessile (Quercus petraea (Matt.) Liebl. Fagaceae) en sylviculture dynamique. Canadian Journal of Botany 78: 361–373. [Google Scholar]
- LukashinAV, Borodovsky M.1998. GeneMark.hmm: new solution for gene finding. Nucleic Acids Research 26: 1107–1115. [DOI] [PMC free article] [PubMed] [Google Scholar]
- NicoliniE, Barthélémy D, Heuret P.2000. Le développement architectural de jeunes chênes sessiles, Quercus petraea (Matt.) Liebl. (Fagaceae) croissants sous des couverts forestiers de densité différentes. Canadian Journal of Botany 78: 1531–1544. [Google Scholar]
- RemphreyWR, Davidson CG.1991. Spatiotemporal distribution of epicormic shoots and their architecture in branches of Fraxinus pennsylvanica Canadian Journal of Forest Research 22: 336–340. [Google Scholar]
- SeleznyovaAN, Thorps TG, Barnett AM, Costes E.2002. Quantitative analysis of shoot development and branching patterns in Actinidia Annals of Botany 89: 471–482. [DOI] [PMC free article] [PubMed] [Google Scholar]
- WardWW.1964. Bud distribution and branching in red oak. Botanical Gazette 125: 217–220. [Google Scholar]
Associated Data
This section collects any data citations, data availability statements, or supplementary materials included in this article.


