

Abstract
Background and Purpose
Many disparate studies have reported the ambiguous role of hydrogen sulfide (H2S) in cell survival. The present study investigated the effect of H2S on the viability of cancer and non-cancer cells.
Experimental Approach
Cancer and non-cancer cells were exposed to H2S [using sodium hydrosulfide (NaHS) and GYY4137] and cell viability was examined by crystal violet assay. We then examined cancer cellular glycolysis by in vitro enzymatic assays and pH regulator activity. Lastly, intracellular pH (pHi) was determined by ratiometric pHi measurement using BCECF staining.
Key Results
Continuous, but not a single, exposure to H2S decreased cell survival more effectively in cancer cells, as compared to non-cancer cells. Slow H2S-releasing donor, GYY4137, significantly increased glycolysis, leading to overproduction of lactate. H2S also decreased anion exchanger and sodium/proton exchanger activity. The combination of increased metabolic acid production and defective pH regulation resulted in an uncontrolled intracellular acidification, leading to cancer cell death. In contrast, no significant intracellular acidification or cell death was observed in non-cancer cells.
Conclusions and Implications
Low and continuous exposure to H2S targets metabolic processes and pH homeostasis in cancer cells, potentially serving as a novel and selective anti-cancer strategy.
Introduction
Cancer cells harvest energy mainly through glycolysis rather than aerobic mitochondrial oxidative phosphorylation (Warburg, 1956; Gatenby and Gillies, 2004; Lunt and Vander Heiden, 2011). Cancer cells also exhibit enhanced glucose uptake and utilization. In order to recycle NAD+, which is used in the glycolysis pathway, the pyruvate which is generated is channelled into anaerobic respiration, hence resulting in high lactate production (Harris, 2004; Feron, 2009). As an organic acid, lactate accumulation triggers a decrease in intracellular pH (pHi). To compensate for this intracellular acidification, cancer cells overexpress a range of proteins, mostly transmembrane localized, that are involved in regulating pH, including monocarboxylate transporters (Halestrap and Price, 1999), proton-pump vacuolar ATPase (V-ATPase; Perez-Sayans et al., 2009), carbonic anhydrases (CAs; Pastorek et al., 1994), anion exchangers (AEs; Romero et al., 2004) and sodium/proton exchangers (NHEs; Orlowski and Grinstein, 2004). Multiple isoforms of these proteins are expressed in cancer cells forming a cooperative network and efficiently maintaining pH homeostasis. Among all of these pH regulators, AEs and NHEs work closely together to maintain a normal alkaline intracellular pH and this pH balance ensures cancer cell survival (see Alexander et al., 2013).
Through activation of these pH regulators, especially AEs and NHEs, cancer cells actively excrete intracellular acid into the surrounding environment. Increasingly, studies have suggested that an acidified tumour microenvironment facilitates angiogenesis (Fukumura et al., 2001; Xu et al., 2002), promotes cancer metastasis (Walenta and Mueller-Klieser, 2004; Gatenby et al., 2006; Rofstad et al., 2006), contributes to chemoresistance (Luciani et al., 2004; De Milito and Fais, 2005) and suppresses the ability of the host immune system to target cancer cells (Lardner, 2001; Walenta and Mueller-Klieser, 2004). Practical strategies to manipulate cancer cell pH could, in theory, be an effective way to trigger cancer cell death (McCarty and Whitaker, 2010; Webb et al., 2011). Several pH regulator inhibitors, such as sulphonamides (Monti et al., 2012; Supuran, 2012) and coumarin (Carta et al., 2012) derivatives, have been developed to inhibit tumour-associated CA9 and CA12 isoforms. 4,4′-Diisothiocyano-2,2′-stilbenedisulphonic acid (DIDS) (Jessen et al., 1986) and cariporide (Masereel et al., 2003) inhibit AE and NHE activities, respectively, and enhance nigericin-induced anti-tumour effect (Yamagata and Tannock, 1996; Harris and Fliegel, 1999). However, owing to the high toxicity of DIDS and cariporide, clinical development of these compounds has proved unsuccessful (Yamagata and Tannock, 1996; Theroux et al., 2000). Alternative approaches that target cancer cell pH would serve as a better anti-cancer strategy.
Hydrogen sulfide (H2S) is a gasotransmitter that is produced endogenously via the reverse-transsulfuration pathway in various organs and tissues in mammalian system (Wang, 2002; 2012; Kimura, 2011; Li et al., 2011). Studies over the past two decades have identified and characterized many important physiological and pathophysiological functions of this interesting gaseous molecule including acting as a vasodilator, neuromodulator and inflammatory signalling mediator (Li et al., 2011; Wang, 2012). In addition, a number of studies have described the role of H2S in regulating cell growth and survival. For instance, treatment with sodium hydrosulfide (NaHS) and overexpression of cystathionine-β synthase (CBS), an enzyme involved in endogenous H2S production from l-cysteine, has been shown to promote colon cancer cell proliferation (Cai et al., 2010; Szabo et al., 2013). On the contrary, other researchers have reported that H2S decreased cell survival rate and induced apoptosis in smooth muscle cells and colon epithelial cells (Yang et al., 2006; Cao et al., 2010; Wu et al., 2012). The conundrum of whether H2S is a pro- or anti-cell survival agent may be determined by the manner in which cells are exposed to H2S.
We have previously shown that prolonged exposure (3–5 days) of cancer cells to low levels of H2S (≤30 μM, sustained over 7 days) using the slow-releasing H2S donor GYY4137 (Li et al., 2008), results in cancer cell death in vitro by activating caspase activity and causing apoptosis (Lee et al., 2011). GYY4137 also caused a significant reduction in tumour volume in a mouse xenograft model with no apparent deleterious effects on physiological functions (Lee et al., 2011). Following our report, a recent study showed that H2S-releasing non-steroidal anti-inflammatory drugs inhibited cell growth of all eleven cancer cell lines which were tested (Chattopadhyay et al., 2012), providing further evidence of the potential for H2S as an anti-cancer agent. The commonly used sulfide salt NaHS, which releases large amounts of H2S instantaneously in aqueous solution (≤400 μM, detected first 1.5 h), causes only a minimal growth inhibitory effect in cancer cell lines. This led us to hypothesize that a continuous, low level and prolonged exposure of H2S is the key factor for effective anti-cancer cell survival activity of the gas molecule. Interestingly, the anti-survival effect of this H2S donor, which was observed in a broad range of cancer cell types, was minimal in normal lung fibroblasts tested. Based on these findings, we proposed that the anti-survival effect of H2S was selective, that is, it affected cancer but not normal cells. Given the glycolytic nature of cancer cells plus the long recognized ability of H2S to affect cell metabolism, we decided to examine the effect of H2S on glucose metabolism and pH homeostasis in both cancer and non-cancer cells.
Methods
Cell culture and compound treatments
Human breast epithelial MCF10A, human breast adenocarcinoma MCF7, normal human lung fibroblast WI38 and human hepatocellular carcinoma HepG2 cell lines were obtained from ATCC (Manassas, VA, USA). MCF7, WI38 and HepG2 were cultured using DMEM (Gibco, Carlsbad, CA, USA) supplemented with 10% FBS (HyClone, Logan, UT, USA). MCF10A cells were cultured using mammary epithelial basal medium (Lonza, Basel, Switzerland) supplemented with 10% (v v−1) FBS, 100 ng·mL−1 cholera toxin (Sigma, St. Louis, MO, USA) and SingleQuot Kit supplements and growth factors (Lonza). The cells were cultured in standard (25 mM) or low glucose (5 mM) DMEM (Gibco) for at least three passages before commencement of the experiment. Sodium hydrosulfide (NaHS; Sigma) was dissolved freshly in DMEM before every treatment. GYY4137 and ZYJ1122 (structural analogue of GYY4137, which does not release H2S and, therefore, was used as a negative control in this study) were synthesized chemically in house (Li et al., 2008; Lee et al., 2011) and dissolved at 80 mM stock concentration before dilution into the indicated concentrations in media. Rotenone (Rot) and antimycin A (Sigma) were prepared in 10 mM ethanol/water (1:1, v v−1) solution. 4,4′-diisothiocyano-2,2′-stilbenedisulphonic acid (DIDS; Sigma) and cariporide (Santa Cruz, Dallas, TX, USA) were dissolved in PBS to final concentrations of 10 mM and 10 mg·mL−1 respectively.
Cell viability assay
Cell viability was assessed using the crystal violet colorimetric assay (Bonnekoh et al., 1989). Adherent live cells fixed with methanol were stained with 5% (w v−1) crystal violet solution before solubilized with 1% (v v−1) SDS solution. Absorbance at 570 nm was read using a spectrophotometer (Tecan Ultra 384, Mannedorf, Switzerland).
Measurement of 3H
Glucose uptake rate and glucose utilization rate were determined using 3H-labelled 2-deoxyglucose (2-DG) and 3H-labelled glucose (PerkinElmer, Waltham, MA, USA) respectively (Alexander et al., 1981; Hom et al., 1984). For glucose uptake experiments, cells were harvested and lysed in RIPA lysis buffer [20 mM Tris–HCl (pH 7.4), 137 mM NaCl, 0.1% SDS, 0.5% (w v−1) deoxycholate, 1% (v v−1) Triton X-100, 2 mM EDTA] after 30 min of incubation with 2.5 μCi 3H-labelled 2-DG. For glucose utilization experiments, cells were incubated with 10 μCi 3H-labelled glucose for 1 h, then changed into normal fresh media and samples were collected at the indicated time points to assay 3H2O. The sample was then mixed with biodegradable scintillation liquid and the 3H count was detected using a liquid scintillation counter (Beckman Coulter, Brea, CA, USA). Antimycin A was used as a positive control since inhibition of mitochondrial function by antimycin A is known to boost glycolysis (Dickman and Mandel, 1990).
Glycolytic enzymatic assays
Cells treated with either 400 μM ZYJ1122 or GYY4137 for 5 days were lysed with passive lysis buffer (Promega, Fitchburg, WI, USA) and protein content was determined using the Bradford protein assay (Bio-Rad, Hercules, CA, USA). Then, 30 μg of total protein lysate was used for each glycolytic enzymatic assay. Hexokinase (HK) assay (Sols et al., 1958) was performed in 50 mM Tris–HCl buffer containing 13.3 mM MgCl2 (pH 8.0), with final concentrations of 80 mM glucose, 16.5 mM ATP (Sigma), 6.8 mM NAD and 300 U·mL−1 glucose-6-phosphate dehydrogenase (Sigma). Absorbance at 340 nm was recorded at 30 s intervals for up to 7 min. To assess phosphofructokinase (PFK) activity (Kamemoto and Mansour, 1986; Clark and Lai, 1989), protein lysate was added into 50 mM Tris–HCl reaction buffer containing 6 mM MgCl2, 2.5 mM DTT (pH 7.0), with final concentrations of 4 mM fructose-6-phosphate (Sigma), 1 mM ATP, 0.2 mM NADH (Sigma), 1 U·mL−1 aldolase (Sigma) and 2.5 U·mL−1 triose-glycerolphosphate dehydrogenase (Sigma). Absorbance at 340 nm was measured at 30 s intervals for up to 20 min. Pyruvate kinase (PK) activity was assessed using assay kit (Biovision, Milpitas, CA, USA). Enzyme activity was measured at 570 nm absorbance. For all the three assays, absorbance was measured with a spectrophotometer (Tecan Ultra 384) and enzyme activity was determined from initial linear portion of activity curve.
Lactate assay
Lactate was determined by a lactate dehydrogenase enzymatic assay (Clark and Lai, 1989). Media of cells treated for 5 days with 400 μM ZYJ1122 or GYY4137 were collected and frozen at −80°C to deproteinize. The enzyme reaction was performed in a final concentration of 0.4 M hydrazine (Sigma), 0.5 M glycine (Bio-Rad), pH 9.0 buffer; with 0.1 mM NAD (Sigma) and 2 U·mL−1 lactate dehydrogenase (Sigma). The reaction mixure was incubated at room temperature for 30 min and absorbance at 340 nm was recorded. At the end of the experiment, cells were lysed with RIPA lysis buffer and protein concentration was determined with the Bradford protein assay (Bio-Rad).
Mitochondrial function analysis
MCF7 and MCF10A cells were plated and treated with 400 μM ZYJ1122 or GYY4137 for 24 h on XF96-well plates. Preparation and analysis were performed with a XF96 extracellular flux analyzer with Mito Stress Test Kit (Seahorse Bioscience, North Billerica, MA, USA; Nicholls et al., 2010) according to the manufacturer's instructions. Three baseline oxygen consumption rate (OCR) measurements were carried out using a 3 min mix, 3 min measure cycle. OCR was then monitored continuously with challenges of oligomycin (1 μM), carbonyl cyanide-p-trifluoromethoxy-phenylhydrazone (FCCP, 1.5 μM) and Rot/antimycin A (1 μM) using the same 3 min measure cycle. Mitochondrial function parameters were analysed using XFe96 software (Seahorse Bioscience).
pHi measurement
Intracellular pH (pHi) of cells was measured by a ratiometric analysis method using confocal microscopy (Zeiss, Oberkochen, Germany; Rink et al., 1982; Wang and Kurtz, 1990). Cells were incubated with 2 μM BCECF probe (Invitrogen, Carlsbad, CA, USA) in mammalian Ringer's solution [2.2 mM CaCl2, 5.6 mM KCl, 154 mM NaCl, 2.4 mM NaHCO3, 2 mM Tris–HCl (pH 7.4)] for 10 min. After rinsing off excess dye, samples were incubated with mammalian Ringer's solution and excited at pH-insensitive 405 nm and pH-sensitive 488 nm wavelengths. Emission intensity was measured at 500 nm. The ratio of 488/405 nm corresponded to pHi. pHi of a cell was calculated from an in situ 3-point calibration curve of pH 6.5, pH 7.0 and pH 7.5 performed with addition of 10 μM nigericin (Sigma) in 125 mM KCl, 1 mM MgCl2, 1 mM CaCl2, 20 mM HEPES sodium-free buffer, pH adjusted with hydrochloric acid (HCl) or potassium hydroxide (KOH).
Assay of pH regulator activity
The pH regulator activity was assessed with either alkali load or acid load assay. Cells were plated in 35 mm fluorodishes (World Precision, Sarasota, FL, USA) and treated with 400 μM ZYJ1122 or GYY4137 for 5 days. Before the confocal microscopy analysis, cells were stained with BCECF as mentioned earlier. Resting pHi of cells was obtained in mammalian Ringer's solution with real-time monitoring mode. Cells were then challenged with either alkali (20 mM HEPES, 20 mM NH4Cl, 5 mM KCl, 2 mM CaCl2, 1 mM MgCl2, 10 mM glucose; Alonso et al., 1993) or acid [20 mM HEPES, 5 mM KCl, 2 mM CaCl2, 1 mM MgCl2, 10 mM glucose (pH 6.0); Furtado, 1987] loading buffer. Changes in pHi following challenges correspond to the activity of AEs and were monitored continuously. For the acid load assay, following the induction of intracellular acidification with acid loading HEPES buffer (pH 6.0), Na+ buffer (20 mM HEPES, 150 mM NaCl, 5 mM KCl, 2 mM CaCl2, 1 mM MgCl2, 10 mM glucose, pH 7.4) was reintroduced. The rate of pHi recovery was observed from slope of pHi recovery. The experiment was repeated at least three times.
Quantitative RT-PCR
Total RNA of MCF7 and HepG2 treated with 400 μM ZYJ1122 or GYY4137 for 5 days were extracted using TRIzol (Invitrogen). Relative mRNA expressions of AE2 and NHE1 were performed using KAPA SYBR FAST qPCR master mix (KAPABiosystems) with iQ5 Multicolor Real-time PCR detection system (Bio-Rad). Primer sequences: AE2 Forward, 5′-GAAGATTCCTGAGAATGCCG-3′, Reverse, 5′-GTCCATGTTGGCACTACTCG-3’; NHE1 Forward, 5′-CCAGCTCATTGCCTT CTACC-3′, Reverse, 5′-TGTGTCTGTTGTAGGACCGC-3′.
Statistical analysis
Data are shown as mean ± SD. Comparisons between non-treated (NT) and treatment groups were analysed using two-tailed, one-way anova followed by Dunnett's multiple comparison test (XLSTAT). P < 0.05 was considered significant.
Results
Continuous exposure to low concentration of H2S decreased cancer cell survival
We have previously shown that the slow H2S-releasing compound GYY4137 exhibited anti-cancer activity (Lee et al., 2011). To verify if it is indeed the low and prolonged exposure to H2S causes the inhibitory effect of cell survival, cancer MCF7 and non-cancer MCF10A cells were exposed to either single or continuous exposure regimens of NaHS. For continuous H2S exposure, NaHS was replaced every 2 h for 5 days due to the volatility of H2S. Single exposure to H2S had no apparent or minimal (at very high concentrations) effect on cell survival of both MCF7 and MCF10A cell lines, regardless of whether they were cancer or non-cancer cell types (Figure 1A). Interestingly, continuous exposure to H2S significantly decreased cell viability but had a more profound effect on cancer compared with non-cancer cell lines. At a concentration of 5 μM NaHS (log2 = 2.32), cell viability of MCF7 was reduced to 68%, whereas MCF10A was maintained at 91% survival. The effect was apparent after continuous exposure to 10 and 20 μM of NaHS (log2 = 3.32 and 4.32) where cell viability of MCF7 was reduced to 45 and 31%, whereas MCF10A maintained 87 and 71% survival respectively. Taken together, these data suggest that the anti-cancer activity of H2S, within a range of 5–20 μM (log2 = 2.32–4.32, region shaded orange in Figure 1A), is much more profound in cancer than in non-cancer cells. It is noteworthy that at concentrations greater than 80 μM (log2 = 6.32), the continuous exposure to H2S drastically killed all the cells. We also observed the similar selectivity of NaHS in cancer cell line HepG2 and normal human lung fibroblast WI38 (Figure 1B). Continuous NaHS exposure within 5–20 μM (region shaded orange) affected HepG2 cell survival but was tolerated by WI38, an observation similar to in MCF7 and MCF10A cells.
Figure 1.
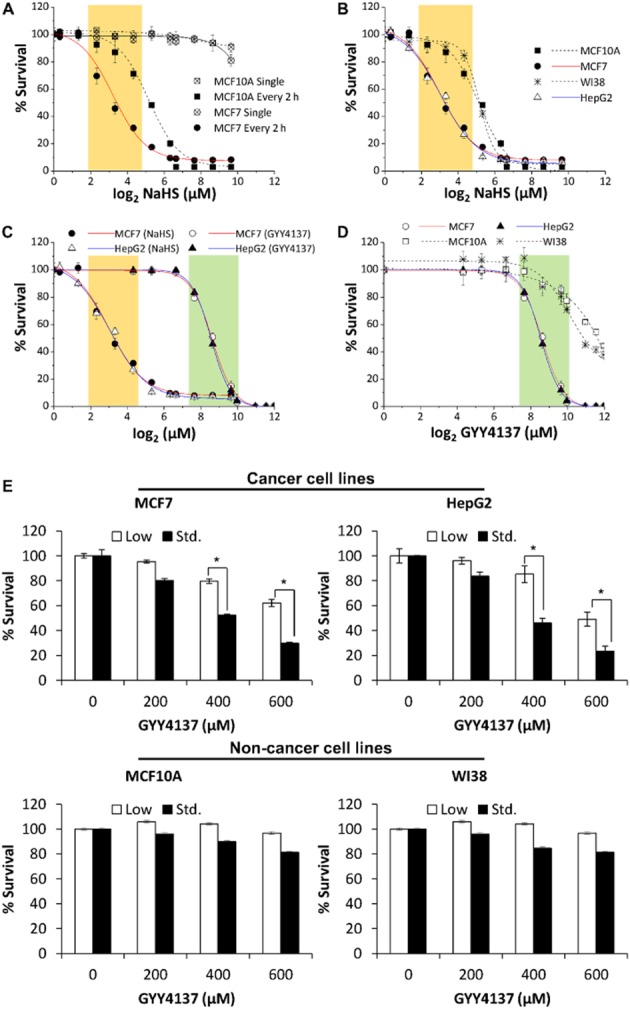
H2S effect on survival of cancer and non-cancer cell lines. (A) Continuous but not single exposure to NaHS decreased cell survival and the effects were stronger in the MCF7 cancer cell as compared to MCF10A non-cancer cell line. The effective concentration window for selective anti-cancer survival (i.e. non-cancer cell ≥75% cell survival) was shaded in orange (log2 2.32, 3.32, 4.32; corresponding to 5, 10 and 20 μM NaHS). (B) An additional cancer cell line HepG2 and non-cancer cell line WI38 showed similar concentration-responses to NaHS as that of MCF7 and MCF10A. (C) Comparison of effective concentration windows of NaHS and the slow H2S-releasing donor GYY4137 in MCF7 and HepG2. GYY4137 showed a right shift in its effective concentration window as compared to NaHS (region shaded green as compared to orange). (D) GYY4137 exhibited high selectivity on cancer cell lines within its effective concentration window (log2 7.64, 8.64, 9.64; corresponding to 200, 400 and 800 μM GYY4137). (E) Anti-survival effect of H2S was more prominent when cancer cells were cultured under standard glucose DMEM (Std., 25 mM) as compared to low glucose DMEM (5 mM). Minimal effect of GYY4137 (200–600 μM) was detected in non-cancer cells MCF10A and WI38 (bottom panel) as compared to cancer cells. (n = 3), *P < 0.05. Results are mean ± SD.
In contrast, the slow H2S-releasing donor, GYY4137 required higher working concentrations (region shaded green in Figure 1C; log2 7.64, 8.64, 9.64; corresponding to 200, 400, 800 μM GYY4137) to exhibit anti-survival activity in both MCF7 and HepG2 cancer cell lines. In addition, 400 μM of GYY4137 treatment significantly reduced cancer cell survival to nearly 50%, an extent comparable to what we observed in continuous exposure to 10–20 μM NaHS. Nonetheless, non-cancer cell lines tolerated GYY4137 well within its effective concentration window (Figure 1D). Taken together, the data suggested that continuous and low exposure to H2S selectively target cancer cells. We therefore carried out our subsequent mechanistic studies using 400 μM concentration of GYY4137 as a substitute of the continuous and low amount (10–20 μM) of H2S exposure.
The anti-cancer effect of H2S is glucose-mediated
As cancer cells are highly dependent for metabolic energy on the availability of glucose, we hypothesized that H2S interferes with glucose metabolism and hence results in cancer cell death. To examine this possibility, cancer (MCF7, HepG2) and non-cancer cells (MCF10A, WI38) were cultured using DMEM containing either 5 or 25 mM glucose and incubated with GYY4137 over a period of 5 days. Surprisingly, HepG2 and MCF7 exposed to H2S survived better in low glucose condition (Figure 1E). In the presence of 400 μM GYY4137, at least 80% of the MCF7 and HepG2 cells survived in low glucose medium, but only about 50% of cells survived in the presence of standard glucose concentration. At a higher concentration of GYY4137 (600 μM), 50–60% survival was observed in low glucose conditions, whereas less than 30% survived in standard glucose medium. Minimal differences were observed in the non-cancer cell lines WI38 and MCF10A, in which survival was maintained at about 80% across the range of 200–600 μM of GYY4137, under both standard and low glucose conditions. The different extent of cell survival in the presence of standard and low glucose media suggests that the anti-proliferative effect of H2S on cancer cells is likely to be glucose-mediated.
Prolonged exposure to low levels of H2S enhances glucose uptake and increases glycolytic rate and lactate production in cancer cells
Since cancer cells use mainly glycolysis to generate the energy required for survival, we next examined whether H2S affected glucose transport into cells by measuring the uptake of 3H-labelled 2-DG. We observed 41.3% enhancement of glucose uptake within 30 min of [3H]-2-DG incubation in cells exposed to GYY4137 as compared either with non-treated (NT) or ZYJ1122-treated cells (Figure 2A). ZYJ1122 is a structural analogue of GYY4137 lacking a sulfur atom, hence does not produce H2S (Lee et al., 2011). To examine if an increase in glucose uptake up-regulated the rate of glycolysis, we incubated MCF7 cancer cells with 3H-labelled glucose and measured 3H2O produced over time. As expected, cells treated with mitochondrial inhibitor, antimycin A, had the highest glycolytic rate among all samples, followed by cells treated with GYY4137, which exhibited enhanced glycolysis as compared to NT or ZYJ1122-treated cells (Figure 2B). Using in vitro enzymatic assays, we also observed significantly higher activities of the three main glycolytic enzymes, that is, HK, PFK and PK in GYY4137-treated cells (Figure 2C). Taken together, these results suggest that glycolysis is increased in H2S-exposed cancer cells. Next, we proceeded to measure the release of lactate, the end product of glycolysis, in cells treated with H2S. Exposure of MCF7 and HepG2 to GYY4137 dramatically increased lactate production under standard DMEM conditions but to a lesser extent in low glucose DMEM (Figure 2D). ZYJ1122 did not change lactate production. Monitoring the amount of lactate over 5 days also revealed an increase in lactate production rate (Figure 2E). In contrast to cancer cells, the non-cancer cells MCF10A and WI38 exposed to H2S displayed no significant difference in lactate production even when cultured using standard DMEM conditions (Supporting Information Fig. S1).
Figure 2.
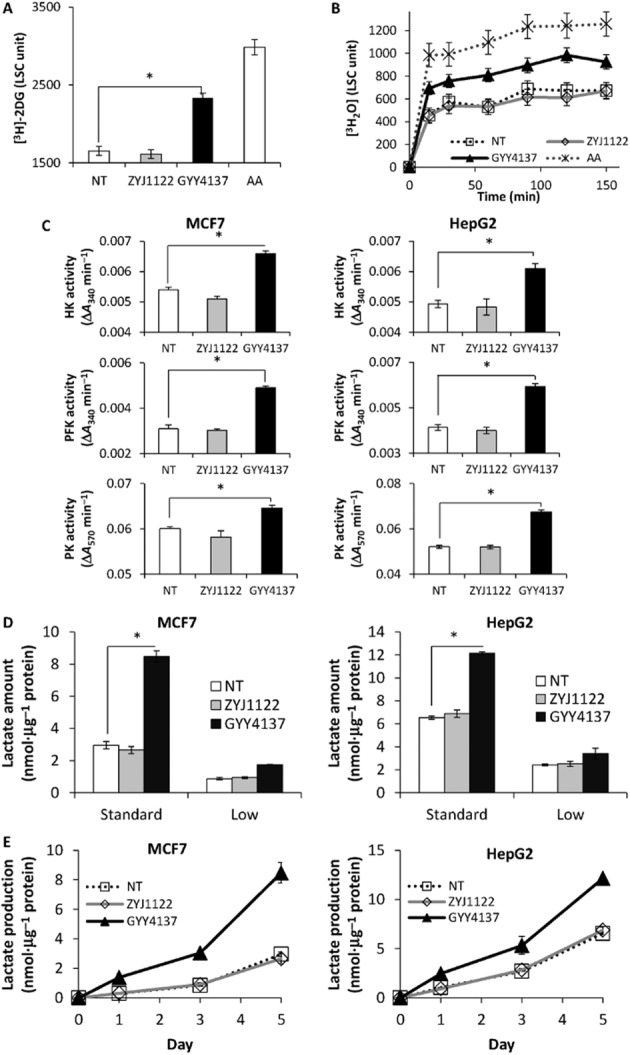
H2S increases glycolysis in cancer cells. An increase in (A) glucose uptake and (B) glucose consumption was observed in MCF7 cancer cells incubated with GYY4137. Antimycin A (AA, 2 μM) was included as a positive control. LSC, liquid scintillation count. (C) Significantly higher glycolytic enzymes reaction rate in both GYY4137-treated HepG2 (left) and MCF7 (right) cancer cells. HK, hexokinase; PFK, phosphofructokinase; PK, pyruvate kinase. (D) A large increase of lactate amount and (E) enhanced lactate production rate in both MCF7 and HepG2 cancer cells upon H2S incubation. NT, non-treated. ZYJ1122 and GYY4137, 400 μM. (n = 3), *P < 0.05. Results are mean ± SD.
In view of the fact that inhibition of mitochondrial function may boost glycolysis, and H2S is known to inhibit mitochondrial cytochrome c oxidase activity (Khan et al., 1990), we carried out a mitochondrial function analysis by measuring OCR in MCF7 and MCF10A cells incubated with GYY4137 or ZYJ1122 for 24 h using XF96 extracellular flux analyzer. No significant differences were observed between NT, ZYJ1122 and GYY4137 samples in several mitochondrial function parameters, including basal respiration, ATP production, spare respiratory capacity and proton leak (Figure 3). This suggests that the H2S released by GYY4137 had little or minimal effect on cellular mitochondrial functionality and that the increase in glycolytic rate observed was not likely to be due to inhibition of mitochondrial oxidative phosphorylation.
Figure 3.
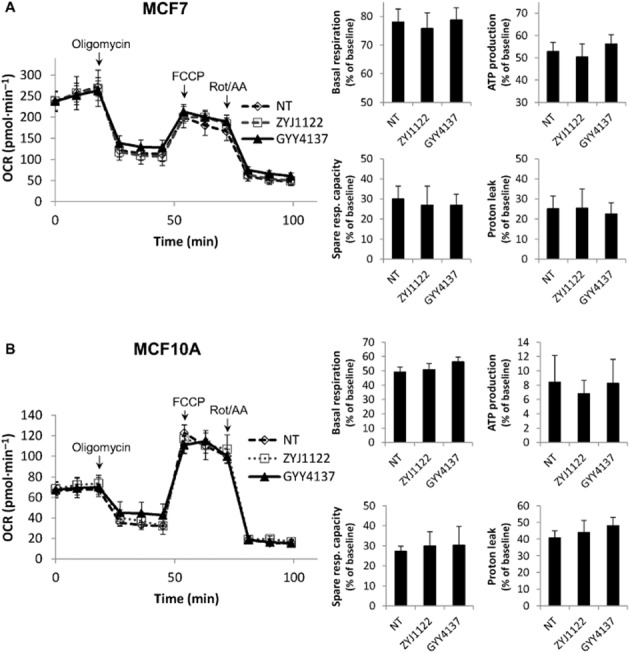
GYY4137 treatment did not affect mitochondrial functions. No significant differences in basal respiration, ATP production, spare respiratory capacity and proton leak were observed in (A) MCF7 and (B) MCF10A treated with GYY4137 for 24 h. OCR, oxygen consumption rate. Oligomycin, 1 μM; carbonyl cyanide-p-trifluoromethoxyphenylhydrazone (FCCP), 1.5 μM; rotenone (Rot)/antimycin A (AA), 1 μM; NT, non-treated; ZYJ1122 and GYY4137, 400 μM (n = 8). Results are mean ± SD.
Prolonged exposure to a low level of H2S causes intracellular acidification in cancer cells
Since GYY4137 increases glycolysis and lactate production in cancer cells, we next asked whether this enhancement of cellular metabolic acid production contributes to the decrease in intracellular pH (pHi). To examine this possibility, we performed ratiometric pHi measurement with BCECF dye using confocal microscopy imaging. A neutral cell would appear as green in colour, whereas an acidic cell would appear to be yellowish. Visually, GYY4137-treated cells were more acidic than NT or ZYJ1122 negative controls (Figure 4A). MCF7 and HepG2 cancer cells showed significantly decreased pHi following H2S incubation. From a resting state value of pH 7.21, the pHi of HepG2 treated with H2S decreased sharply to pH 6.58. Similarly, H2S exposure reduced the pHi of MCF7 cells from pH 7.43 to pH 6.59. In contrast, very little or no change in pHi was seen in either MCF10A or WI38 cells exposed to either ZYJ1122 or GYY4137 (Figure 4B). The decline in pHi was specific to H2S and was not secondary to cell death, since MCF7 cells incubated with three commonly used cytotoxic agents (taxol, etoposide and camptothecin) did not show intracellular acidification (Supporting Information Fig. S2). Thus, we concluded that H2S released from GYY4137 causes significant intracellular acidification in cancer, but not non-cancer cells. The fall in pHi observed may result from an increase in metabolic acid due to enhanced glycolysis.
Figure 4.
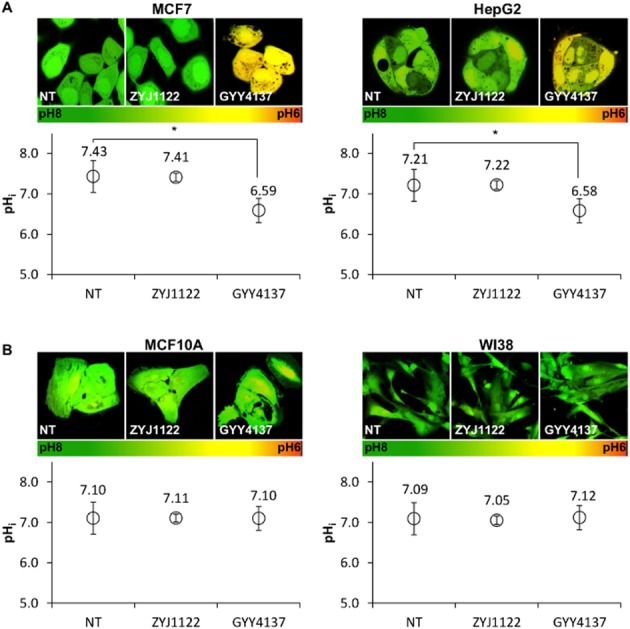
H2S triggers intracellular acidification in cancer but not non-cancer cells. (A) pH measurements of MCF7 and HepG2 using ratiometric confocal microscopy showed a significant decrease in intracellular pH (pHi) in GYY4137-treated samples, both visually with microscope (pictures on top) and quantitatively (graph below). (B) No significant change in pHi in different treatments was observed in normal cells MCF10A and WI38. NT, non-treated. ZYJ1122 and GYY4137, 400 μM. (n ≥ 50 cells per group), *P < 0.05. Results are mean ± SD.
H2S impairs pH regulator activity in cancer but not non-cancer cells
Since cancer cells are well equipped with functional and efficient intracellular pH regulating mechanisms, it is surprising that H2S can trigger such a drastic decrease in pHi in these cells. We hence hypothesized that H2S may, additionally, affect the ability of the cell to regulate its own intracellular pH. To examine the effect of H2S on pH regulatory activity, cancer cells treated with GYY4137 were subjected to either alkali or acid challenge so as to assess the activity of AEs and NHEs respectively. NT or ZYJ1122-treated cells responded efficiently to an alkali load, with a signature alkali response (indicated by arrows) following NH4Cl introduction. In contrast, such an alkali response was much reduced in GYY4137-treated HepG2 and MCF7 cells (Figure 5A), suggestive of defective AE activity in these cancer cells after exposure to H2S. In separate experiments, cells were challenged with acid loading HEPES buffer to induce intracellular acidification and then reintroduced to Na+ buffer to activate NHEs (indicated by the inset  ). This was indeed the case in NT and in cells exposed to ZYJ1122 where they responded effectively to Na+ buffer. However, GYY4137-treated cells showed a much slower pHi recovery response rate in acid challenge (Figure 5B), showing that H2S reduces the activity of NHEs. No significant difference was observed between NT, ZYJ1122- and GYY4137-treated MCF10A or WI38 cells (Supporting Information Fig. S3), suggesting that there is no H2S-induced defect in either AE or NHE activity in non-cancer cells. Moreover, the expression levels of AE2 and NHE1 (the most widely expressed isoforms in each family, see Alexander et al., 2013) was not affected by GYY4137 (Figure 5C). This suggests that it is the activity and not the expression of the pH regulator that is affected by H2S.
Figure 5.
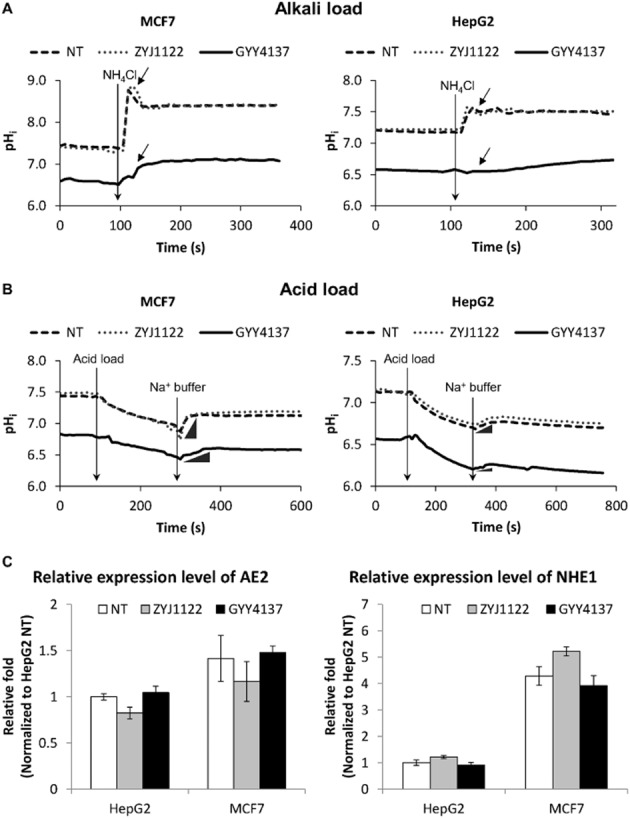
Reduced pH response capacity in cancer cells upon H2S exposure. (A) Alkali response and (B) acid response curves of MCF7 and HepG2. GYY4137-treated cancer cells showed reduced responses of the signature alkali peak (indicated by arrow) as observed in NT and ZYJ1122 negative control. GYY4137-treated samples showed slow and minimal recovery of pHi (indicated by the inset  ) upon re-introduction of sodium (Na+) buffer as compared to NT and ZYJ1122-treated cells. (C) H2S treatment did not affect the expression levels of pH regulators. No significant differences in transcript level of AE2 and NHE1 pH regulators in HepG2 and MCF7 upon exposure of H2S. NT, non-treated. ZYJ1122 and GYY4137, 400 μM (n = 3). Results are mean ± SD.
Combination of increased glycolysis rate and defective pH homeostasis selectively kills cancer cells
We have shown that H2S selectively kills cancer cells but has minimal effect on non-cancer cells, possibly through an increased metabolic acid production via enhanced glycolysis and/or impairment in pH regulation capability. To study the interplay between these two components, we first determined whether an increase in glycolytic rate alone in MCF7 cells was sufficient to reduce pHi. We used the mitochondrial inhibitors, Rot and antimycin A, to boost glycolysis to its maximum. MCF7 treated with Rot and/or antimycin A produced approximately three times more lactate (i.e. higher glycolysis) as compared to NT cells (Figure 6A, left panel). However, Rot and/or antimycin A did not significantly change pHi as was observed in cells exposed to H2S (Figure 6A, right panel). We then asked whether inhibition of pH regulator activity alone might be sufficient to cause cancer cell death. MCF7 and HepG2 cells were treated with the commonly used AE inhibitor, DIDS, and/or NHE inhibitor, cariporide. Although either DIDS (50 μM) or cariporide (0.05 mg·mL−1) is sufficient to inhibit pH regulator responses following alkali or acid challenge (Supporting Information Fig. S4), there were no observable anti-proliferative effects of DIDS and/or cariporide on MCF7 and HepG2 cells (Figure 6B), even at concentrations up to 125 μM (DIDS) and 0.125 mg·mL−1 (cariporide). Furthermore, DIDS and/or cariporide inhibition did not cause the same dramatic decrease in pHi (≥0.5 pH units), which was apparent in GYY4137-treated cells (Figure 6C). In conclusion, these data suggested a combination of both high metabolic acid influx due to glycolysis coupled with an inefficient pH response capacity was necessary for H2S-induced intracellular acidification, leading, in turn, to death of cancer cells.
Figure 6.
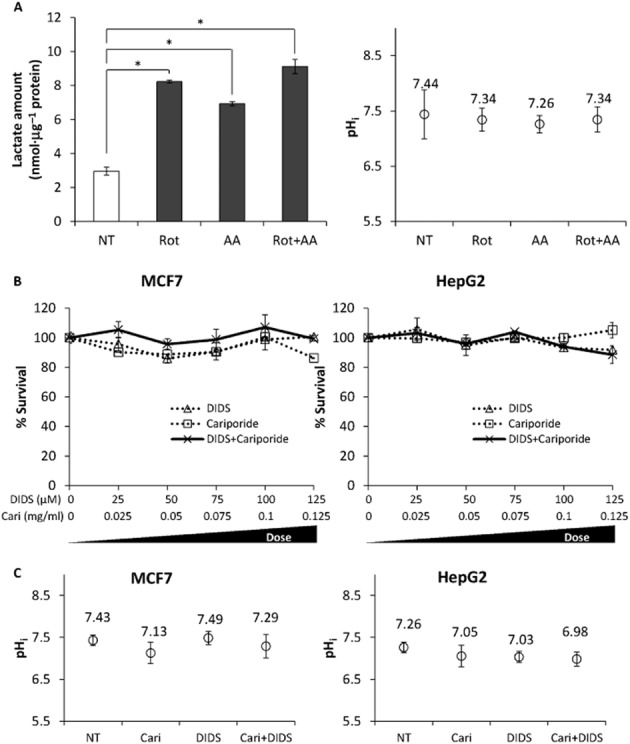
An increase in lactate production or inhibition of pH regulator(s) alone was insufficient to cause intracellular acidification and cancer cell death. (A) High lactate production (left) induced by the mitochondrial inhibitors, rotenone (Rot, 2 μM) and/or antimycin A (AA, 2 μM) did not cause a significant decrease in pHi (right). *P < 0.05. (B) No significant effects on MCF7 and HepG2 cancer cell survival were observed even with increasing concentrations of DIDS and/or cariporide (Cari) inhibition of pH regulator(s). (C) pH regulator inhibition resulted in less substantial pHi changes as compared to GYY4137-treated cells. NT, non-treated. DIDS, 50 μM; cariporide (Cari), 0.05 mg·mL−1 (n ≥ 50 cells per group). Results are mean ± SD.
Acid accumulation induced by H2S drives cancer cell death
Next, we inhibited glycolysis using 2-DG to determine whether a reduction in lactate production, which contributed to intracellular acidification, could reverse GYY4137-induced cancer cell death. The cancer cells were co-treated with 2-DG and GYY4137 for 5 days and cell survival was assessed with crystal violet assay. Co-treatment of cells with 2-DG (0.5 mM) and GYY4137 successfully increased survival of MCF7 cells from about 58 to 90% survival (Figure 7A). For HepG2 cells, 2-DG (1 mM) significantly restored cancer cell survival, from nearly 41% increase to 78% survival (Figure 7A). Furthermore, we treated cancer cells with GYY4137 for 72 h allowing acid accumulation to occur, followed by co-incubation with ionophore nigericin for another 48 h. Nigericin is an ionophore that allows free transport of protons across the membrane (Shavit et al., 1968). We anticipated that nigericin could restore acidic pHi caused by GYY4137 and rescue anti-cancer effect of H2S. Indeed, increasing concentrations of nigericin restored the acidic pHi of MCF7 and HepG2 closer to non-treatment pHi coupled with an increase in cell survival (Figure 7B). These results show that intracellular acidification is the driving force triggering cancer cell death by H2S.
Figure 7.
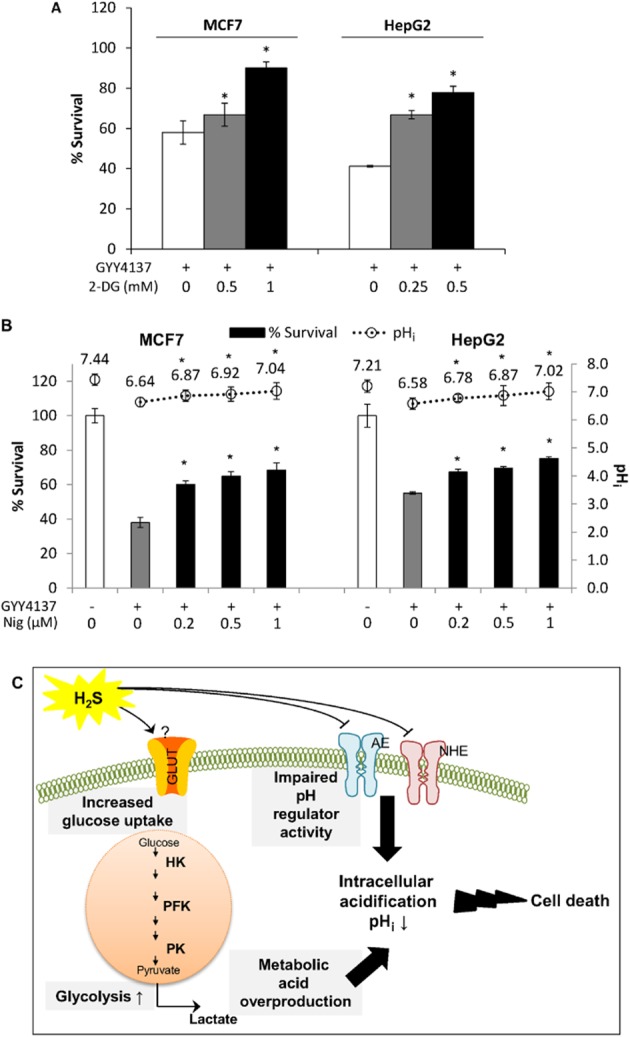
Acid accumulation in cells drives cancer cell death. (A) Partial inhibition of glycolysis with 2-deoxyglucose (2-DG) was able to reverse GYY4137 (400 μM)-induced cancer cell death in MCF7 and HepG2 cells. (B) Reversal of pHi acidification using nigericin ionophore (Nig) resulted in increasing MCF7 and HepG2 cancer cell survival (left axis, bar chart) coupled with increasing pHi (right axis, dot graph) (n = 3 for cell survival, n ≥ 30 cells per group for pHi measurement). Results are mean ± SD. *P < 0.05 as compared to GYY4137-treated alone group. (C) Schematic diagram illustrating the potential of H2S to alter glycolysis, impair pH balance and thence provoke cancer cell death. H2S promotes an influx of glucose and triggers enhanced glycolysis. Overproduction of lactate, coupled with impaired activity of pH regulators results in accumulation of acid and reduction of pHi. pHi then serves as a stimulus to induce cancer cell death. AE, anion exchanger; GLUT, glucose transporter; HK, hexokinase; NHE, sodium/proton exchanger; PFK, phosphofructokinase; PK, pyruvate kinase.
Discussion and conclusions
In this study, we demonstrated that prolonged exposure to low concentration range of H2S but not single exposure, exhibited selective anti-cancer effects. Further mechanistic studies demonstrated that the H2S selectivity in cancer (cf. non-cancer) cells is largely due to the fact that H2S increases metabolic acid–lactate production, and impairs the pH regulatory system, which is much more prominent in cancer cells. Accumulation of metabolic acid inside the cells causes intense intracellular acidification, hence serves as a damaging stimulus and triggers cancer cell death (Figure 7C). This study highlights a great potential of H2S as a novel selective anti-cancer agent. Furthermore, the anti-cancer activity of H2S had been previously reported by our group and others to be effective in a wide range of cancer cell lines (Lee et al., 2011; Chattopadhyay et al., 2012), potentially applicable in targeting various cancer types.
Several studies have suggested that the endogenous H2S plays a role in regulating cell survival. Yang et al. (2004) showed that overexpression of cystathionine γ lyase (CSE), one of the enzymes that is responsible for endogenous H2S production, inhibited HEK293 cell proliferation. In contrast, Szabo et al. (2013) recently reported that gene silencing of CBS, but not CSE or 3-mercaptopyruvate sulfurtransferase, decreased colon cancer cell proliferation and migration. It might be difficult to reconcile the anti-survival effects of the endogenous H2S among these studies as these H2S-producing enzymes also play pivotal roles in sulfur metabolism and cysteine biosynthetic process. For example, CBS is important in eliminating homocysteine, a toxic metabolite, via reverse-transsulfuration pathway. Therefore, whether the changes in the expression of endogenous H2S enzymes only reflect the role of H2S needs to be further explored. In addition, it may be difficult to compare the anti-cancer effects of endogenous with exogenous H2S. In colon epithelial cells, exogenous H2S was reported to increase cell proliferation (200 μM, HCT116 cell line; Cai et al., 2010) but also decrease cell survival (50–200 μM, WiDr cell line; Cao et al., 2010). Findings from these studies are difficult to interpret and the variations may largely be caused by the different doses and modes of H2S exposure, and maybe cell line specific.
Nonetheless, no one has ever examined the effect of continuous exposure to exogenous H2S. In this study, the continuous exposure to low concentrations of H2S (either using NaHS or GYY4137) showed the consistent anti-cancer effect and we thus proposed that prolonged exposure to a low dose of exogenous H2S is a potential selective anti-cancer therapeutic strategy. In contrast, continuous exposure to high concentrations of H2S (NaHS ≥ 80 μM; GYY4137 ≥ 2 mM) drastically affected cell survival of both cancer and non-cancer cells, possibly due to an inhibitory effect on mitochondrial cytochrome oxidase (Khan et al., 1990; Goubern et al., 2007). GYY4137 releases H2S in a slow manner, thus requiring a higher working concentration (a right shift of effective window, region shaded green in Figure 1C) to exhibit a similar degree of anti-cancer activity as NaHS. Based on the concentration-response curves of NaHS and GYY4137, we speculated that although with its higher working concentration, the concentration of effective compound, H2S, released by 400 μM GYY4137 might only correspond to nearly 10 μM of H2S. This estimation was lower than our previous study (≤30 μM; Lee et al., 2011) where a conventional methylene blue assay was used to measure the H2S level. The overestimation of H2S level may be caused by an acidic assay condition where the H2S release was maximized (Li et al., 2008; Olson, 2009).
Cancer cells have long been known to exhibit different metabolic behaviours from normal cells. Cancer cells are often regarded as ‘addicted’ to glucose and harvest energy via glycolysis process (Gatenby and Gillies, 2004; Harris, 2004). Although this observation was made a few decades ago, little or no progress in terms of cancer therapy has been made in exploiting this fundamental difference in metabolism, which exists between normal and cancer cells (Zhao et al., 2013). Increasing glycolysis as a strategy to kill cancer cells is perhaps counterintuitive as this is the main source of energy in such cells. However, cancer cells are not immune to the deleterious effects of excessive intracellular acidification and have evolved different pH regulatory mechanisms to counter the high production of metabolic acid generated by glucose metabolism. Conceptually, effective cancer therapy could therefore be achieved by disrupting pH homeostasis in cancer cells. However, from the present work, it is clear that neither increased metabolic acid production nor pH regulator inhibition alone is sufficient to bring about cancer cell death. Induction of high lactate production in cancer cells using mitochondrial inhibitors did not result in a significant reduction in pHi. Moreover, inhibition of AE or NHE activity was also insufficient to trigger intracellular acidification and cancer cell death. In this study, we demonstrated, for the first time, that H2S-mediated anti-cancer activity is due to the combined effect of increased metabolic acid production and defective pH regulation resulting in intracellular acidification. Although theoretically applicable, intracellular acidification would not be possible simply by using mitochondrial inhibitors (which would stimulate glycolysis) and pH regulator inhibitors (which would impair pH homeostasis), as these two inhibitors alone, and presumably also in combination, possess high toxicity (Knobeloch et al., 1990; Yamagata and Tannock, 1996; Theroux et al., 2000; Swarnkar et al., 2013). In fact, mitochondrial inhibitor alone causes acute cell death regardless of whether cells are cancer or non-cancer. Therefore, an agent like H2S that induces intracellular acidification selectively in cancer but not non-cancer cells is useful in cancer therapy.
H2S is the latest member of the gasotransmitter family. However, unlike NO or CO, H2S is able to move through lipid membrane freely without facilitation of membrane channels (Mathai et al., 2009). This lipophilic property adds to the difficulty in identifying the exact molecular targets of H2S. Cai et al. (2010) reported that NaHS increased Akt and ERK phosphorylation, contributing to an increased proliferation of HCT116 colon cancer cells. Similarly using colon epithelial cells, another study demonstrated that NaHS activated AMPK phosphorylation, decreased mTOR signalling and induced autophagy in the cells (Wu et al., 2012). To add to the complexity, NaHS was shown to suppress Rot-induced p38 and JNK phosphorylation in a neuroblastoma model, protecting the cells from apoptosis (Hu et al., 2009). Combining the findings from these studies, the role of H2S in cell signalling remains obscure and appears to be specific for cell lines, tissues and systems. However, a recent study by Cuevasanta et al. (2012) reported that H2S had higher permeability and solubility in lipid as compared to aqueous buffer, proposing that H2S may accumulate within the plasma membrane bilayer. Our data revealed that GYY4137 increased glucose uptake and impaired pH regulator activity; both the glucose transporter and pH regulators are located in the membrane. Hence, H2S may affect the activity of these membrane-bound proteins, possibly via post-translational modification of sulfhydration (Paul and Snyder, 2012), and this deserves further investigation.
In conclusion, we propose a new approach to cancer therapy, which involves exploiting the natural differences in the metabolism of cancer vis-à-vis non-cancer cells. H2S overdrives cancer glycolysis, resulting in high metabolic acid production, coupled with impaired pH homeostasis, to bring about an intense intracellular acidification. As both of these mechanistic components exist largely in cancer, but not normal cells, H2S may therefore serve as a specific and effective cancer therapy strategy.
Acknowledgments
This work was supported by NUS research grants to L-W. D. (R-183-000-312-515; R-183-000-313-305) and P. K. M. (R-711-000-020-133). Z-W. L. was supported by a research scholarship from the Yong Loo Lin School of Medicine, NUS. The authors thank Yee-Liu Chua, Dr Jinsong Bian, Dr Theresa May-Chin Tan and Research Instruments for the technical assistance and sharing of reagents.
Glossary
- AE
anion exchanger
- CA
carbonic anhydrase
- CBS
cystathionine-β synthase
- CSE
cystathionine γ lyase
- DIDS
4,4′-diisothiocyano-2,2′-stilbenedisulphonic acid
- H2S
hydrogen sulfide
- NaHS
sodium hydrosulfide
- NHE
sodium/proton exchanger
- OCR
oxygen consumption rate
- pHi
intracellular pH
- Rot
rotenone
- 2-DG
2-deoxyglucose
Author contributions
L-W. D. and P. K. M. conceived the project. C-H. T. provided ZYJ1122 and GYY4137. T. H. contributed to glycolysis and mitochondrial study. L-W. D. supervised the experimental work and interpretation of data. E. Y-W. T., X-Y. T. and Z-W. L. carried out the experiments described. Z-W. L. analysed the data and wrote the paper along with L-W. D. and P. K. M. All authors discussed and edited the contents of this paper.
Conflict of interest
The authors have declared that there are no competing interests.
Supporting information
Additional Supporting Information may be found in the online version of this article at the publisher's web-site:
http://dx.doi.org/10.1111/bph.12773
Figure S1 Lactate production of normal cells. Normal cells WI38 and MCF10A cultured under standard DMEM (25 mM glucose) condition for 5 days did not exhibit any significant difference of lactate production upon exposure of H2S. NT, non-treated. ZYJ1122 and GYY4137, 400 μM (n = 3 experiments). Results are mean ± SD.
Figure S2 Intracellular acidification was observed only in H2S donor treatment but not other commonly used cytotoxic agents. No dramatic decreases in pHi were observed in MCF7 cancer cells treated with commonly used cytotoxic agents including taxol (10 μg·mL−1), etoposide (200 μM) and camptothecin (CPT, 20 μM) at pharmacological concentrations. NT, non-treated. GYY4137, 400 μM (n ≥ 50 cells per group). Results are mean ± SD.
Figure S3 pH response curves of normal cells upon alkali and acid load. No significant difference in pH responses between different treatments of normal cells WI38 (left) and MCF10A (right) either upon (A) alkali or (B) acid load. NT, non-treated. ZYJ1122 and GYY4137, 400 μM.
Figure S4 Typical pH response curves with pH regulator inhibition. A dosage of 50 μM of DIDS (top) or 0.05 mg·mL−1 of cariporide (bottom) effectively inhibited cellular pHi responses towards alkali or acid challenges (indicated by black arrow pointer). NT, non-treated (n ≥ 50 cells per group).
References
- Alexander SPH, Benson HE, Faccenda E, Pawson AJ, Sharman JL, Spedding M, Peters JA, Harmar AJ, CGTP Collaborators The Concise Guide to PHARMACOLOGY 2013/14: Transporters. Br J Pharmacol. 2013;170:1706–1796. doi: 10.1111/bph.12450. [DOI] [PMC free article] [PubMed] [Google Scholar]
- Alexander GM, Schwartzman RJ, Bell RD, Yu J, Renthal A. Quantitative measurement of local cerebral metabolic rate for glucose utilizing tritiated 2-deoxyglucose. Brain Res. 1981;223:59–67. doi: 10.1016/0006-8993(81)90806-4. [DOI] [PubMed] [Google Scholar]
- Alonso A, Arrazola A, Garciandia A, Esparza N, Gomez-Alamillo C, Diez J. Erythrocyte anion exchanger activity and intracellular pH in essential hypertension. Hypertension. 1993;22:348–356. doi: 10.1161/01.hyp.22.3.348. [DOI] [PubMed] [Google Scholar]
- Bonnekoh B, Wevers A, Jugert F, Merk H, Mahrle G. Colorimetric growth assay for epidermal cell cultures by their crystal violet binding capacity. Arch Dermatol Res. 1989;281:487–490. doi: 10.1007/BF00510085. [DOI] [PubMed] [Google Scholar]
- Cai WJ, Wang MJ, Ju LH, Wang C, Zhu YC. Hydrogen sulfide induces human colon cancer cell proliferation: role of Akt, ERK and p21. Cell Biol Int. 2010;34:565–572. doi: 10.1042/CBI20090368. [DOI] [PubMed] [Google Scholar]
- Cao Q, Zhang L, Yang G, Xu C, Wang R. Butyrate-stimulated H2S production in colon cancer cells. Antioxid Redox Signal. 2010;12:1101–1109. doi: 10.1089/ars.2009.2915. [DOI] [PubMed] [Google Scholar]
- Carta F, Maresca A, Scozzafava A, Supuran CT. Novel coumarins and 2-thioxo-coumarins as inhibitors of the tumor-associated carbonic anhydrases IX and XII. Bioorg Med Chem. 2012;20:2266–2273. doi: 10.1016/j.bmc.2012.02.014. [DOI] [PubMed] [Google Scholar]
- Chattopadhyay M, Kodela R, Nath N, Dastagirzada YM, Velazquez-Martinez CA, Boring D, et al. Hydrogen sulfide-releasing NSAIDs inhibit the growth of human cancer cells: a general property and evidence of a tissue type-independent effect. Biochem Pharmacol. 2012;83:715–722. doi: 10.1016/j.bcp.2011.12.018. [DOI] [PubMed] [Google Scholar]
- Clark J, Lai JK. Glycolytic, tricarboxylic acid cycle and related enzymes in brain. In: Boulton A, Baker G, Butterworth R, editors. Carbohydrates and Energy Metabolism. Vol. 11. Clifton, New Jersey: Humana Press; 1989. pp. 233–281. [Google Scholar]
- Cuevasanta E, Denicola A, Alvarez B, Moller MN. Solubility and permeation of hydrogen sulfide in lipid membranes. PLoS ONE. 2012;7:e34562. doi: 10.1371/journal.pone.0034562. [DOI] [PMC free article] [PubMed] [Google Scholar]
- De Milito A, Fais S. Tumor acidity, chemoresistance and proton pump inhibitors. Future Oncol. 2005;1:779–786. doi: 10.2217/14796694.1.6.779. [DOI] [PubMed] [Google Scholar]
- Dickman KG, Mandel LJ. Differential effects of respiratory inhibitors on glycolysis in proximal tubules. Am J Physiol. 1990;258((6 Pt 2)):F1608–F1615. doi: 10.1152/ajprenal.1990.258.6.F1608. [DOI] [PubMed] [Google Scholar]
- Feron O. Pyruvate into lactate and back: from the Warburg effect to symbiotic energy fuel exchange in cancer cells. Radiother Oncol. 2009;92:329–333. doi: 10.1016/j.radonc.2009.06.025. [DOI] [PubMed] [Google Scholar]
- Fukumura D, Xu L, Chen Y, Gohongi T, Seed B, Jain RK. Hypoxia and acidosis independently up-regulate vascular endothelial growth factor transcription in brain tumors in vivo. Cancer Res. 2001;61:6020–6024. [PubMed] [Google Scholar]
- Furtado MR. Effect of NH4Cl on the contractility of isolated vascular smooth muscle. Life Sci. 1987;41:95–102. doi: 10.1016/0024-3205(87)90561-3. [DOI] [PubMed] [Google Scholar]
- Gatenby RA, Gillies RJ. Why do cancers have high aerobic glycolysis? Nat Rev Cancer. 2004;4:891–899. doi: 10.1038/nrc1478. [DOI] [PubMed] [Google Scholar]
- Gatenby RA, Gawlinski ET, Gmitro AF, Kaylor B, Gillies RJ. Acid-mediated tumor invasion: a multidisciplinary study. Cancer Res. 2006;66:5216–5223. doi: 10.1158/0008-5472.CAN-05-4193. [DOI] [PubMed] [Google Scholar]
- Goubern M, Andriamihaja M, Nubel T, Blachier F, Bouillaud F. Sulfide, the first inorganic substrate for human cells. FASEB J. 2007;21:1699–1706. doi: 10.1096/fj.06-7407com. [DOI] [PubMed] [Google Scholar]
- Halestrap AP, Price NT. The proton-linked monocarboxylate transporter (MCT) family: structure, function and regulation. Biochem J. 1999;343((Pt 2)):281–299. [PMC free article] [PubMed] [Google Scholar]
- Harris C, Fliegel L. Amiloride and the Na(+)/H(+) exchanger protein: mechanism and significance of inhibition of the Na(+)/H(+) exchanger. Int J Mol Med. 1999;3:315–321. doi: 10.3892/ijmm.3.3.315. [DOI] [PubMed] [Google Scholar]
- Harris RA. Glycolysis, overview. In: William JL, Lane MD, editors. Encyclopedia of Biological Chemistry. New York: Elsevier; 2004. pp. 266–271. [Google Scholar]
- Hom FG, Goodner CJ, Berrie MA. A (3H)2-deoxyglucose method for comparing rates of glucose metabolism and insulin responses among rat tissues in vivo: validation of the model and the absence of an insulin effect on brain. Diabetes. 1984;33:141–152. doi: 10.2337/diab.33.2.141. [DOI] [PubMed] [Google Scholar]
- Hu L-F, Lu M, Wu Z-Y, Wong PT-H, Bian J-S. Hydrogen sulfide inhibits rotenone-induced apoptosis via preservation of mitochondrial function. Mol Pharmacol. 2009;75:27–34. doi: 10.1124/mol.108.047985. [DOI] [PubMed] [Google Scholar]
- Jessen F, Sjoholm C, Hoffmann EK. Identification of the anion exchange protein of Ehrlich cells: a kinetic analysis of the inhibitory effects of 4,4'-diisothiocyano-2,2'-stilbene-disulfonic acid (DIDS) and labeling of membrane proteins with 3H-DIDS. J Membr Biol. 1986;92:195–205. doi: 10.1007/BF01869388. [DOI] [PubMed] [Google Scholar]
- Kamemoto ES, Mansour TE. Phosphofructokinase in the liver fluke Fasciola hepatica. Purification and kinetic changes by phosphorylation. J Biol Chem. 1986;261:4346–4351. [PubMed] [Google Scholar]
- Khan AA, Schuler MM, Prior MG, Yong S, Coppock RW, Florence LZ, et al. Effects of hydrogen sulfide exposure on lung mitochondrial respiratory chain enzymes in rats. Toxicol Appl Pharmacol. 1990;103:482–490. doi: 10.1016/0041-008x(90)90321-k. [DOI] [PubMed] [Google Scholar]
- Kimura H. Hydrogen sulfide: its production, release and functions. Amino Acids. 2011;41:113–121. doi: 10.1007/s00726-010-0510-x. [DOI] [PubMed] [Google Scholar]
- Knobeloch LM, Blondin GA, Read HW, Harkin JM. Assessment of chemical toxicity using mammalian mitochondrial electron transport particles. Arch Environ Contam Toxicol. 1990;19:828–835. doi: 10.1007/BF01055047. [DOI] [PubMed] [Google Scholar]
- Lardner A. The effects of extracellular pH on immune function. J Leukoc Biol. 2001;69:522–530. [PubMed] [Google Scholar]
- Lee ZW, Zhou J, Chen CS, Zhao Y, Tan CH, Li L, et al. The slow-releasing hydrogen sulfide donor, GYY4137, exhibits novel anti-cancer effects in vitro and in vivo. PLoS ONE. 2011;6:e21077. doi: 10.1371/journal.pone.0021077. [DOI] [PMC free article] [PubMed] [Google Scholar]
- Li L, Whiteman M, Guan YY, Neo KL, Cheng Y, Lee SW, et al. Characterization of a novel, water-soluble hydrogen sulfide-releasing molecule (GYY4137): new insights into the biology of hydrogen sulfide. Circulation. 2008;117:2351–2360. doi: 10.1161/CIRCULATIONAHA.107.753467. [DOI] [PubMed] [Google Scholar]
- Li L, Rose P, Moore PK. Hydrogen sulfide and cell signaling. Annu Rev Pharmacol Toxicol. 2011;51:169–187. doi: 10.1146/annurev-pharmtox-010510-100505. [DOI] [PubMed] [Google Scholar]
- Luciani F, Spada M, De Milito A, Molinari A, Rivoltini L, Montinaro A, et al. Effect of proton pump inhibitor pretreatment on resistance of solid tumors to cytotoxic drugs. J Natl Cancer Inst. 2004;96:1702–1713. doi: 10.1093/jnci/djh305. [DOI] [PubMed] [Google Scholar]
- Lunt SY, Vander Heiden MG. Aerobic glycolysis: meeting the metabolic requirements of cell proliferation. Annu Rev Cell Dev Biol. 2011;27:441–464. doi: 10.1146/annurev-cellbio-092910-154237. [DOI] [PubMed] [Google Scholar]
- Masereel B, Pochet L, Laeckmann D. An overview of inhibitors of Na(+)/H(+) exchanger. Eur J Med Chem. 2003;38:547–554. doi: 10.1016/s0223-5234(03)00100-4. [DOI] [PubMed] [Google Scholar]
- Mathai JC, Missner A, Kügler P, Saparov SM, Zeidel ML, Lee JK, et al. No facilitator required for membrane transport of hydrogen sulfide. PNAS. 2009;106:16633–16638. doi: 10.1073/pnas.0902952106. [DOI] [PMC free article] [PubMed] [Google Scholar]
- McCarty MF, Whitaker J. Manipulating tumor acidification as a cancer treatment strategy. Altern Med Rev. 2010;15:264–272. [PubMed] [Google Scholar]
- Monti SM, Supuran CT, De Simone G. Carbonic anhydrase IX as a target for designing novel anticancer drugs. Curr Med Chem. 2012;19:821–830. doi: 10.2174/092986712799034851. [DOI] [PubMed] [Google Scholar]
- Nicholls DG, Darley-Usmar VM, Wu M, Jensen PB, Rogers GW, Ferrick DA. Bioenergetic profile experiment using C2C12 myoblast cells. J Vis Exp. 2010;46:e2511. doi: 10.3791/2511. [DOI] [PMC free article] [PubMed] [Google Scholar]
- Olson KR. Is hydrogen sulfide a circulating ‘gasotransmitter’ in vertebrate blood? Biochim Biophys Acta. 2009;1787:856–863. doi: 10.1016/j.bbabio.2009.03.019. [DOI] [PubMed] [Google Scholar]
- Orlowski J, Grinstein S. Diversity of the mammalian sodium/proton exchanger SLC9 gene family. Pflugers Arch. 2004;447:549–565. doi: 10.1007/s00424-003-1110-3. [DOI] [PubMed] [Google Scholar]
- Pastorek J, Pastorekova S, Callebaut I, Mornon JP, Zelnik V, Opavsky R, et al. Cloning and characterization of MN, a human tumor-associated protein with a domain homologous to carbonic anhydrase and a putative helix-loop-helix DNA binding segment. Oncogene. 1994;9:2877–2888. [PubMed] [Google Scholar]
- Paul BD, Snyder SH. H2S signalling through protein sulfhydration and beyond. Nat Rev Mol Cell Biol. 2012;13:499–507. doi: 10.1038/nrm3391. [DOI] [PubMed] [Google Scholar]
- Perez-Sayans M, Somoza-Martin JM, Barros-Angueira F, Rey JM, Garcia-Garcia A. V-ATPase inhibitors and implication in cancer treatment. Cancer Treat Rev. 2009;35:707–713. doi: 10.1016/j.ctrv.2009.08.003. [DOI] [PubMed] [Google Scholar]
- Rink TJ, Tsien RY, Pozzan T. Cytoplasmic pH and free Mg2+ in lymphocytes. J Cell Biol. 1982;95:189–196. doi: 10.1083/jcb.95.1.189. [DOI] [PMC free article] [PubMed] [Google Scholar]
- Rofstad EK, Mathiesen B, Kindem K, Galappathi K. Acidic extracellular pH promotes experimental metastasis of human melanoma cells in athymic nude mice. Cancer Res. 2006;66:6699–6707. doi: 10.1158/0008-5472.CAN-06-0983. [DOI] [PubMed] [Google Scholar]
- Romero MF, Fulton CM, Boron WF. The SLC4 family of HCO3- transporters. Pflugers Arch. 2004;447:495–509. doi: 10.1007/s00424-003-1180-2. [DOI] [PubMed] [Google Scholar]
- Shavit N, Dilley RA, San Pietro A. Ion translocation in isolated chloroplasts. Uncoupling of photophosphorylation and translocation of K and H ions induced by nigericin. Biochemistry. 1968;7:2356–2363. doi: 10.1021/bi00846a043. [DOI] [PubMed] [Google Scholar]
- Sols A, De La Fuente G, Villarpalasi C, Asensio C. Substrate specificity and some other properties of baker's yeast hexokinase. Biochim Biophys Acta. 1958;30:92–101. doi: 10.1016/0006-3002(58)90245-2. [DOI] [PubMed] [Google Scholar]
- Supuran CT. Inhibition of carbonic anhydrase IX as a novel anticancer mechanism. World J Clin Oncol. 2012;3:98–103. doi: 10.5306/wjco.v3.i7.98. [DOI] [PMC free article] [PubMed] [Google Scholar]
- Swarnkar S, Goswami P, Kamat PK, Patro IK, Singh S, Nath C. Rotenone-induced neurotoxicity in rat brain areas: a study on neuronal and neuronal supportive cells. Neuroscience. 2013;230:172–183. doi: 10.1016/j.neuroscience.2012.10.034. [DOI] [PubMed] [Google Scholar]
- Szabo C, Coletta C, Chao C, Módis K, Szczesny B, Papapetropoulos A, et al. Tumor-derived hydrogen sulfide, produced by cystathionine-β-synthase, stimulates bioenergetics, cell proliferation, and angiogenesis in colon cancer. Proc Natl Acad Sci U S A. 2013;110:12474–12479. doi: 10.1073/pnas.1306241110. [DOI] [PMC free article] [PubMed] [Google Scholar]
- Theroux P, Chaitman BR, Danchin N, Erhardt L, Meinertz T, Schroeder JS, et al. Inhibition of the sodium-hydrogen exchanger with cariporide to prevent myocardial infarction in high-risk ischemic situations. Main results of the GUARDIAN trial. Guard during ischemia against necrosis (GUARDIAN) Investigators. Circulation. 2000;102:3032–3038. doi: 10.1161/01.cir.102.25.3032. [DOI] [PubMed] [Google Scholar]
- Walenta S, Mueller-Klieser WF. Lactate: mirror and motor of tumor malignancy. Semin Radiat Oncol. 2004;14:267–274. doi: 10.1016/j.semradonc.2004.04.004. [DOI] [PubMed] [Google Scholar]
- Wang R. Two's company, three's a crowd: can H2S be the third endogenous gaseous transmitter? FASEB J. 2002;16:1792–1798. doi: 10.1096/fj.02-0211hyp. [DOI] [PubMed] [Google Scholar]
- Wang R. Physiological implications of hydrogen sulfide: a whiff exploration that blossomed. Physiol Rev. 2012;92:791–896. doi: 10.1152/physrev.00017.2011. [DOI] [PubMed] [Google Scholar]
- Wang X, Kurtz I. H+/base transport in principal cells characterized by confocal fluorescence imaging. Am J Physiol Cell Physiol. 1990;259:C365–C373. doi: 10.1152/ajpcell.1990.259.2.C365. [DOI] [PubMed] [Google Scholar]
- Warburg O. On the origin of cancer cells. Science. 1956;123:309–314. doi: 10.1126/science.123.3191.309. [DOI] [PubMed] [Google Scholar]
- Webb BA, Chimenti M, Jacobson MP, Barber DL. Dysregulated pH: a perfect storm for cancer progression. Nat Rev Cancer. 2011;11:671–677. doi: 10.1038/nrc3110. [DOI] [PubMed] [Google Scholar]
- Wu YC, Wang XJ, Yu L, Chan FKL, Cheng ASL, Yu J, et al. Hydrogen sulfide lowers proliferation and induces protective autophagy in colon epithelial cells. PLoS ONE. 2012;7:e37572. doi: 10.1371/journal.pone.0037572. [DOI] [PMC free article] [PubMed] [Google Scholar]
- Xu L, Fukumura D, Jain RK. Acidic extracellular pH induces vascular endothelial growth factor (VEGF) in human glioblastoma cells via ERK1/2 MAPK signaling pathway: mechanism of low pH-induced VEGF. J Biol Chem. 2002;277:11368–11374. doi: 10.1074/jbc.M108347200. [DOI] [PubMed] [Google Scholar]
- Yamagata M, Tannock IF. The chronic administration of drugs that inhibit the regulation of intracellular pH: in vitro and anti-tumour effects. Br J Cancer. 1996;73:1328–1334. doi: 10.1038/bjc.1996.254. [DOI] [PMC free article] [PubMed] [Google Scholar]
- Yang G, Cao K, Wu L, Wang R. Cystathionine γ-lyase overexpression inhibits cell proliferation via a H2S-dependent modulation of ERK1/2 phosphorylation and p21Cip/WAK-1. J Biol Chem. 2004;279:49199–49205. doi: 10.1074/jbc.M408997200. [DOI] [PubMed] [Google Scholar]
- Yang G, Wu L, Wang R. Pro-apoptotic effect of endogenous H2S on human aorta smooth muscle cells. FASEB J. 2006;20:553–555. doi: 10.1096/fj.05-4712fje. [DOI] [PubMed] [Google Scholar]
- Zhao Y, Butler EB, Tan M. Targeting cellular metabolism to improve cancer therapeutics. Cell Death Dis. 2013;4:e532. doi: 10.1038/cddis.2013.60. [DOI] [PMC free article] [PubMed] [Google Scholar]
Associated Data
This section collects any data citations, data availability statements, or supplementary materials included in this article.
Supplementary Materials
Figure S1 Lactate production of normal cells. Normal cells WI38 and MCF10A cultured under standard DMEM (25 mM glucose) condition for 5 days did not exhibit any significant difference of lactate production upon exposure of H2S. NT, non-treated. ZYJ1122 and GYY4137, 400 μM (n = 3 experiments). Results are mean ± SD.
Figure S2 Intracellular acidification was observed only in H2S donor treatment but not other commonly used cytotoxic agents. No dramatic decreases in pHi were observed in MCF7 cancer cells treated with commonly used cytotoxic agents including taxol (10 μg·mL−1), etoposide (200 μM) and camptothecin (CPT, 20 μM) at pharmacological concentrations. NT, non-treated. GYY4137, 400 μM (n ≥ 50 cells per group). Results are mean ± SD.
Figure S3 pH response curves of normal cells upon alkali and acid load. No significant difference in pH responses between different treatments of normal cells WI38 (left) and MCF10A (right) either upon (A) alkali or (B) acid load. NT, non-treated. ZYJ1122 and GYY4137, 400 μM.
Figure S4 Typical pH response curves with pH regulator inhibition. A dosage of 50 μM of DIDS (top) or 0.05 mg·mL−1 of cariporide (bottom) effectively inhibited cellular pHi responses towards alkali or acid challenges (indicated by black arrow pointer). NT, non-treated (n ≥ 50 cells per group).