Abstract
Serine proteases are involved in many fundamental physiological processes, and control of their activity mainly results from the fact that they are synthetized in an inactive form that becomes active upon cleavage. Three decades ago Martin Karplus’s group performed the first molecular dynamics simulations of trypsin, the most studied member of the serine protease family, to address the transition from the zymogen to its active form. Based on the computational power available at the time, only high frequency fluctuations, but not the transition steps, could be observed. By performing accelerated molecular dynamics (aMD) simulations, an interesting approach that increases the configurational sampling of atomistic simulations, we were able to observe the N-terminal tail insertion, a crucial step of the transition mechanism. Our results also support the hypothesis that the hydrophobic effect is the main force guiding the insertion step, although substantial enthalpic contributions are important in the activation mechanism. As the N-terminal tail insertion is a conserved step in the activation of serine proteases, these results afford new perspective on the underlying thermodynamics of the transition from the zymogen to the active enzyme.
Keywords: trypsin, trypsinogen, molecular dynamics, accelerated molecular dynamics, MD, aMD, GIST, solvation
Introduction
The serine proteases are among the most studied enzymes, with a multitude of kinetic, biochemical and structural studies over the past four decades.1 Serine proteases cleave peptide bonds with varying specificity and are found in eukaryotes, prokaryotes, archaea, and viruses. They are involved in numerous physiological processes in humans, including digestion, immune response, blood coagulation, and homeostasis.2–5 Serine proteases are especially interesting enzymes because they are synthesized in an inactive zymogen form that undergoes a proteolytic cleavage before becoming catalytically active. Cleavage yields a new N-terminus, Val-Ile-NH3+, that inserts in a specific pocket, known as the “Ile cleft,”6 where the new N-terminal amino group forms a salt bridge with a highly conserved aspartic residue.7
The most well studied member of the serine protease family, trypsin, is expressed in the pancreas as a zymogen, and then is secreted into the small intestine where it is cleaved N-terminal to the Ile-Val site, and is thus activated, by enteropeptidase. In the case of trypsin, a hexapeptide is released upon cleavage (Fig. 1). In the uncleaved zymogen form of trypsin, trypsinogen, the asp residue (Asp194 in chymotrypsin notation) is oriented away from the pocket and instead interacts with a His residue (His40 in chymotrypsin notation). Thus the activation of trypsin can be characterized by two key events: (i) the rotation of Asp194 from the His40 to the pocket, and (ii) the insertion of the N-terminal tail in the pocket (Fig. 1). A rearrangement in the active site is associated with those steps and the enzyme becomes activated. The order of these two steps is still under discussion, although the insertion was proposed to occur faster than breaking of the Asp194-His40 interaction.7
Figure 1.
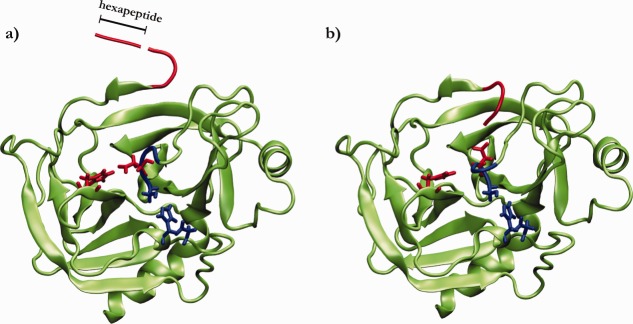
Cartoon representation of trypsinogen (a) and trypsin (b), outlining the activation process of the enzyme. A cleveage of the Lys-Ile peptide bond releases an hexapeptide (red tube) that allows the remaining N-terminal tail (Val-Ile-NH3+) to be inserted in a pocket. Conserved Asp194 (red sticks) interacts with either His40 (a) or the charged N-terminal tail (b). The active site residues are shown as blue sticks.
Many crystal structures of trypsin, resolved either with or without inhibitors or even with a dipeptide that mimics the inserted N-terminal tail, shed light on the relevant conformational states (Fig. 2). All crystal structures present nearly the same tertiary structure except for the so-called activation domain composed of the previously mentioned N-terminal region and three loops: Gly142-Pro152, Gly184 to Gly193, and Gly216 to Asn223.7 The first loop was found to be very important for binding and recognition8,9 and is called “autolysis loop” for its intrinsic susceptibility to proteolytic digestion of serine proteases.10
Figure 2.
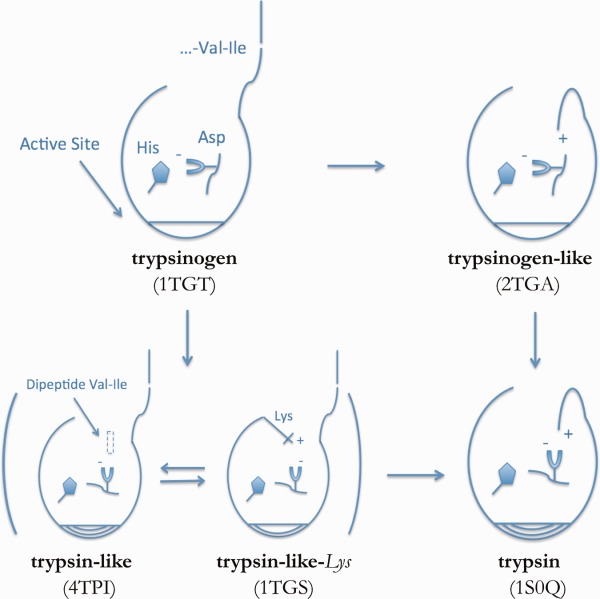
Possible mechanism of trypsin activation based on available crystal structures. From left to right: N-terminal tail insertion in the pocket. From top to bottom: Asp194 rotation from His40 towards the pocket. The location of the Val-Ile dipeptide (C) as well as the presence of a salt bridge between Lys156 and Asp194 in the trypsin-like-Lys conformation (D) are highlighted.
The first simulation of a zymogen was reported in 1987 by Brunger, Huber and Karplus.11 The authors started from a structure co-crystallized with an Ile-Val dipeptide and Pancreatic Trypsin Inhibitor (PTI) that mimics the trypsin configuration (trypsin-like) except with the N-terminal tail still pointing toward the solvent (Fig. 2). Although this was a fundamental work for the field, no N-terminal tail insertion was observed during the short (∼30 ps) molecular dynamics (MD) simulation. We decided to move forward with those fundamental simulations by preforming extended MD as well as accelerated MD (aMD) simulations starting from each of the configurations shown in Figure 2. We were able to observe, for the first time, the insertion of the N-terminal tail in the pocket even in the absence of Asp194 pointing toward the pocket. The insertion was only observed in aMD simulations, highlighting the relevance of this methodology for studying conformational transitions. The insertion displaced water molecules from the pocket to the bulk, in agreement with a hydrophobic driving force that has been previously proposed.12 The fact that the insertion was also observed when the Asp194 was not in the pocket, as is the case of trypsinogen, also supports the hypothesis that the salt bridge formation does not drive the insertion event.
Results
Conformational transition associated with activation of trypsinogen
As was done by Karplus’s group in the first computational approach to study the activation of trypsin, we leveraged the crystal structure of trypsin co-crystallized with the Val-Ile dipeptide bound in the pocket (PDB ID 4TPI, denoted “trypsin-like” in Fig. 2). To ensure a robust analysis of the activation process, we also considered another crystal structure in a trypsin-like conformation with the N-terminal tail still solvent-exposed; this structure, has Lys156 facing in towards the pocket, interacting with Asp194 instead of a the Val-Ile dipeptide (PDB ID 1TGS, denoted “trypsin-like-Lys“in Fig. 2). This Lys156 residue has been shown to be solely responsible for the activation of other serine proteases.13 Mutagenesis has also shown that introduction of this residue augments the activity of some proteases that naturally lack Lys156.14
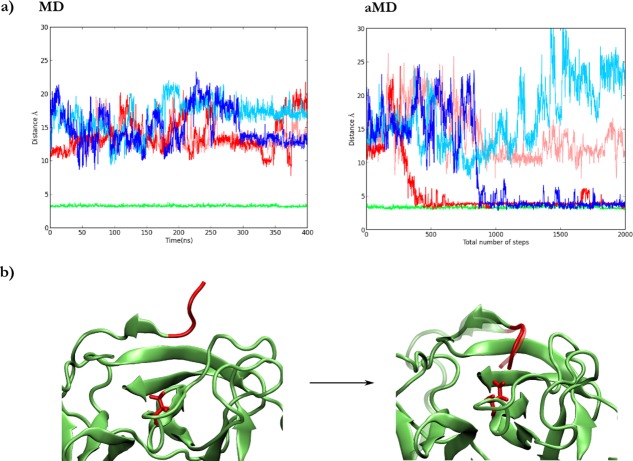
In 400ns of two replicate MD simulations of both trypsin-like conformations, no insertion events were observed from either (Fig. 3). To allow the system to more easily explore configurational space, we performed two replicate aMD simulations from each trypsin-like conformation. After simulating the same number of steps as in the conventional MD cases, we observed insertion events in two of the four independent trajectories, along with the corresponding salt bridge formation between Asp194 and Ile16, of the N-terminal tail (Fig. 3). Noteworthy, the N-terminal tail, including the Ile side chain, adopts the same position as in the crystal structure of activated trypsin (Fig. 3). The global structure of the enzyme, including the highly conserved Ca2+ site, was very stable during the time scale of the simulation. Interestingly, water molecules were displaced from the pocket upon insertion of the N-terminal tail.
Figure 3.
(a) Salt bridge between Asp194 and Ile16 of the N-terminal tail during MD (left panel) and aMD (right panel) simulations starting from trypsin-like (light and dark red), trypsin-like-Lys (light and dark blue), or Trypsin (green) configurations. (b) Initial and final snapshots of an aMD simulation where the insertion is observed. The N-terminal tail of trypsin was superimposed as a reference and is depicted in a ghost representation.
The Lys156-Asp194 salt bridge of the trypsin-like-Lys crystal structure formed and broke several times during both conventional and aMD simulations, suggesting that the barrier that separates the two configurations is small. This result shows that Lys156 is not as stable as N-terminal tail in the pocket, since only the latter remains in the pocket during all MD and aMD simulations [Fig. 3(a) right panel].
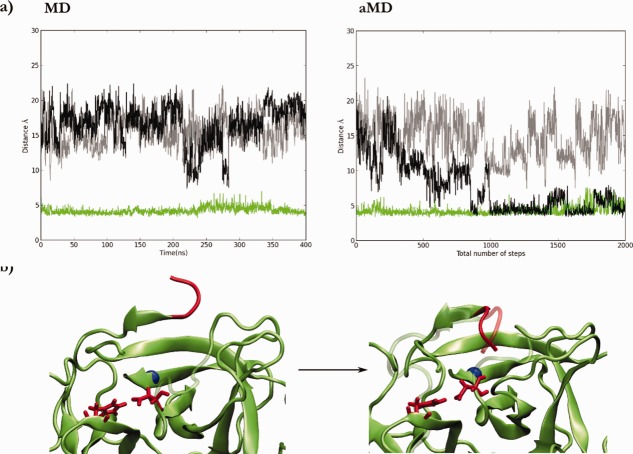
To further probe the activation mechanism of trypsin, we performed conventional and aMD simulations starting from the actual zymogen structure (trypsinogen in Fig. 2). Specifically, we performed an in silico cleavage of the initial hexapeptide to leave the -Val-Ile NH3+ N-terminal tail free to bind Asp194 in the pocket. As observed in the other simulations described above, no insertion events were observed in conventional MD simulations (Fig. 4). An insertion event was observed, however, during the aMD simulations (Fig. 4). Because Asp194 was engaged in a stable interaction with His40 in the zymogen state, Asp194 was not primed in the correct orientation for salt-bridge formation with the N-terminal tail. Surprisingly, however, we observed the N-terminal insertion into the pocket without any salt bridge formation. The results show again that once the N-terminal tail is in the pocket it remains inside during the rest of the simulation, as was also observed when the active trypsin was used as the starting point for the simulations [Fig. 4(a), green series]. The His40-Asp194 interaction also remains very stable either when positively charged or neutral His40 was used. With the insertion event observed from the trypsinogen configuration, water molecules were again displaced from the hydrophobic pocket. It is important to mention that because the Asp194-Ile16 distance used previously would not be a good coordinate to monitor the insertion from trypsinogen, we used the distance between Ile16 and the Cα of Leu119 located in the bottom of the pocket.
Figure 4.
(a) Distance between Cα of Leu119 and Ile16 of N-terminal tail during MD (left panel) or aMD (right panel) simulations, starting from the trypsinogen-like (black and grey), or trypsin (green) conformations. (b) Initial and final snapshot of an aMD simulation where the insertion was observed. The N-terminal tail of trypsinogen is superimposed as a reference and shown in a ghost representation.
Thermodynamics of pocket solvation
Based on the recurring observation of water molecules expelled upon the N-terminal tail insertion, we decided to perform a complete analysis of water molecules presence in the pocket (Fig. 5). To begin with, we simply counted the number of waters in the pocket either using MD simulations clustered according to Figure 2, or using MD simulations restrained to a representative structure for each conformation.
Figure 5.
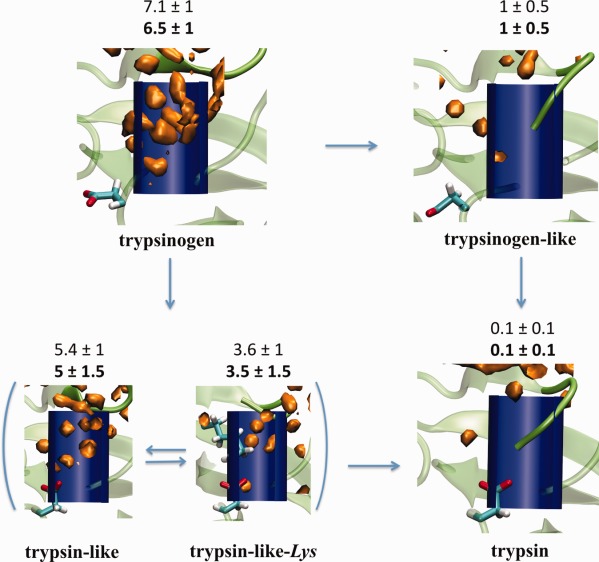
Density of water molecules (O atom) calculated by GIST calculations during restrained MD simulations (orange). The number of water molecules in a cylinder located in the pocket (blue) was also included in the figure for either restrained MD or MD simulations (bold). The N-terminal tail, Asp194 and Lys156 residues are shown as reference.
The number of water molecules in the pocket, according to either the post-processed unrestrained MD simulations or from the restrained simulations, for each of the five conformations is shown in Figure 5. Roughly 4 or 5 water molecules are released when the N-terminal tail is inserted in the pocket. The one water molecule observed in simulations of the trypsinogen-like conformation was expelled when Asp194 orients toward the pocket, as in the case of trypsin. Similar results were observed between the trypsinogen and trypsin-like conformations, where the difference in the number of water molecules is due to the presence of Asp194 in the pocket of the latter. To provide visual information regarding the water molecules in the pocket, we also compute the water density in the pocket by using Grid Inhomogeneous Solvation Theory (GIST) calculations (Fig. 5).
To further probe the nature of the water molecules occupying the pocket, we performed a thermodynamic analysis of the solvation of the pocket of trypsinogen using GIST (Fig. 6).15 In our analysis we only considered restrained MD simulations to reduce noise in the water occupancy, as suggested in the literature.15 We performed the same analysis for an arbitrarily chosen polar surface region of the protein as a control [see Fig. 7(b)]. Contrary to what might be expected for a hydrophobic pocket, the solvation of the pocket is approximately as favorable as the polar surface [Fig. 6(a)]. Specifically, there is a substantial enthalpic contribution to the free energy of solvation due to polar interactions between structural water molecules and the backbone of the pocket residues [Fig. 6(a), blue series]. This enthalpic contribution from the water–protein interactions is offset by both enthalpic (water–water) and entropic (translation and orientation of water molecules) contributions. We note that the comparable water–protein enthalpic contribution of the pocket and the polar region is only a result of the increased solvent-accessible surface area of the pocket compared to the surface region. When the N-terminal tail occupies the pocket, its polar backbone atoms fill the role of the water molecules once bound to the backbone of the pocket residues [Fig. 6(b)]. These polar interactions between the N-terminal tail and the pocket residues may mitigate the enthalpic loss in water-protein interactions upon desolvating the pocket [Fig. 6(a), blue series].
Figure 6.
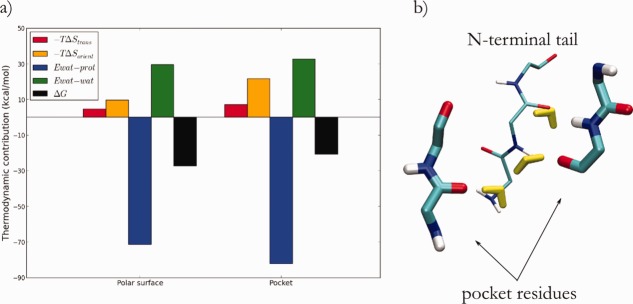
(a) Thermodynamic contributions to solvation ΔG for an arbitrary chosen polar surface and the pocket of in trypsinogen. (b) Detail of conserved positions of water molecules (yellow) that specifically interact with polar surfaces in the pocket of trypsinogen during MD simulations; other water molecules were omitted for clarity. The N-terminal binding pose is indicated as thin sticks.
Figure 7.
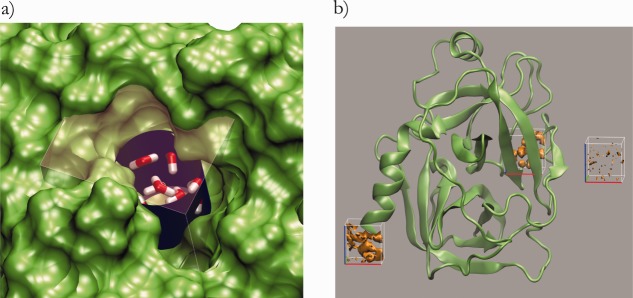
(a) Cylinder and rectangle used to monitor water molecules in the pocket and perform Grid inhomogeneous solvation theory calculations. Water molecules in the pocket and the surface of the protein are also shown. (b) In addition to the pocket itself two more regions were calculated: waters in the bulk used as reference and an arbitrary polar surface at the C-terminus of the protein used as a control.
Discussion
With a wealth of available biochemical data and applications in the laboratory, trypsin can be considered the prototypical serine protease. The activity of serine proteases is spatially regulated, such that the enzymes are synthesized in one part of the organism in an inactive, or zymogen, form, and upon relocation to their functionally relevant location, are cleaved and thus activated. The physical mechanism of activation of serine proteases requires the insertion of a flexible N-terminal tail into a conserved pocket; however the details of this process are unclear. Nearly three decades ago, Martin Karplus’s group attempted to use molecular dynamics simulations to specifically address the molecular details of the insertion event that activates trypsin, but found that the biological phenomenon must occur at timescales longer than the picosecond timescale accessible at the time.11 With the advent of increased computational power and a new enhanced sampling approach (aMD), we revisited the intriguing problem of understanding the molecular details underlying the activation of trypsin from its zymogen (trypsinogen) form.
From our aMD simulations we observed, for the first time, insertion events of the N-terminal tail starting, regardless of the initial conformation. Importantly, the insertion of the N-terminal tail occurred with (trypsin-like and trypsin-like-Lys) or without (trypsinogen) Asp194 oriented towards the pocket, suggesting that the salt bridge between Asp194 and the charged N-terminal tail is not required for the insertion event.
A closer analysis of the hydration of the pocket indicated that many structural water molecules were released upon N-terminal insertion, suggesting that the hydrophobic effect is the driving force of the insertion event. It is important to note that some water molecules in the pocket engage in stable polar interactions with the protein backbone of the pocket, such that their presence contributes a very substantial enthalpic gain in the pocket solvation free energy. The backbone of the N-terminal tail, once inserted, must replace these interactions to compensate this energy loss.
The salt bridge, on the other hand, is more likely acting as a latch to complete the transition, and could very well be involved in the subsequent allosteric communication with the active site. These results agree with both crystal structures16 and kinetic experiments6,17 in which various dipeptides were shown to have substantial disparities in their binding affinities for trypsin, despite their uniform capacity to form a salt bridge with Asp194.
We also found that Lys156 oscillates between either solvent-exposed (trypin-like) or forming a salt bridge with Asp194 in the pocket (trypsin-like-Lys). Because this oscillation was observed several times in both MD and aMD simulations, we argue that the barrier separating both trypsin-like states is not substantial as compared to thermal fluctuations. The N-terminal tail, on the other hand, once inserted, remained in the pocket for the duration of both MD and aMD simulations (hundreds of nanoseconds), indicating that the N-terminal tail is more stable than Lys156 inside the pocket. Although the functional role of Lys156 in trypsin, if any, remains unclear, our results do suggest that this residue would not act as a competitor for the N-terminal tail.
We consider this insertion event to be an illustrative example of the protein folding process, in which a “semi-folded” trypsin, with its N-terminal tail still extended toward the solvent, must properly fold the N-terminal tail into the pocket, and by doing so releases internal water molecules. This process has a clear gain in water entropy, as the waters trapped in the pocket are expelled to the bulk, and suffers from a loss in configurational entropy due to the configurational restriction of the flexible N-terminal tail. In general terms of a funnel landscape the protein folds by gaining effective energy, which includes the water entropy, and in turn losing configurational entropy. The idea that the trypsinogen-to-trypsin transition involves semi-folded states was indeed also suggested by Bode et al. in 1978.18 Having observed the process using aMD suggests promise of this method in application to protein folding predictions.
Conclusion
Using aMD simulations we have observed the N-terminal tail insertion that is crucial in the activation of trypsin from its inactive zymogen state. We argue that the expulsion of structural water molecules from the pocket, and not the salt bridge formation with Asp194, drives the insertion event. Interestingly, we identified a substantial enthalpic contribution from the water-protein interactions in the pocket that the backbone residues of the N-terminal tail must compensate for upon insertion into the pocket. Because the N-terminal tail insertion is a mechanistic step conserved in the activation of the other serine proteases, and the observed changes upon insertion implicate highly conserved regions, these mechanistic insights may indeed be evolutionarily conserved.
Methods
System preparation
Different crystal structures were used as starting points in the MD and accelerated MD simulations: (i) trypsinogen (PDB ID 1TGT),16 (ii) trypsinogen-Like (PDB ID 2TGA),16 (iii) trypsin-like (PDB ID 4TPI),19 (iv) trypsin-like-Lys (PDB ID 1TGS),20 (v) trypsin (PDB ID 1S0Q) (Fig. 2). All structures were cleaved at the N-terminus leaving Ile16 as the first residue of the sequence. All histidine protonation states were assigned based on the immediate environment in high resolution crystal structures,21 and cross-checked against the protonation prediction server H++.22 All histidines maintained the same immediate environments validating the choice of protonation states. His23 was set up in two different protonation states: the neutral ε-tautomer, and the positively-charged protonated state. The Amber ff99SB force field23 with explicit TIP3P24 water molecules was used in all simulations. The minimum distance between the protein and the water box edge was 12Å. Crystallographic waters were retained as found in the original crystal structures.
Molecular dynamics simulations
MD simulations were performed using the pmemd module within the AMBER11 simulation package. Periodic boundary conditions and Ewald sums were employed for the long-range electrostatic interactions. The SHAKE algorithm,25 and a 2-fs time step were used for the propagation of coordinates in time in the NPT ensemble, using the Berendsen thermostat and barostat.26 The equilibration process was performed by slowly heating the system from 0 to 300 K over the course of 500 ps. We performed duplicate 400-ns simulations of all five conformations shown in Figure 2. We also performed 200 ns of conventional MD simulations in which we restrained the configuration of every atom of the protein for the pocket water molecules analysis. Only water molecules are able to move during this type of simulations.
Accelerated MD
All-atom molecular dynamics simulations have been widely used to study protein conformations with great success. The time scale of the simulations, however, is not always sufficient to sample accurately the relevant configurational space of the protein. This problem can be overcome through the use of enhanced sampling methods such as accelerated MD (aMD) which modifies the classical potential energy  by adding a bias potential
  depending on a pre-defined threshold potential energy E and a tuning parameter α that determines how deeply the original potential energy will be modified, as shown in Eqs. (1) and (2) below27:
| (1) |
| (2) |
where  is the modified potential. The aMD approach is especially attractive because it does not require a priori knowledge of the reaction path. This technique has been successfully used during the last years by our group to sample conformational changes occurring on the micro- to millisecond time scales.28–31
The implementation of aMD allows modification of both the total potential energy ( ) of the system as well as the dihedral potential energy (
 ). It is possible to modify only the first one, only the second one or both of them at the same time; that is, the dihedral energy is doubly modified or more accelerated than other terms. In this work, we use both modifications at the same time, because it has been shown to provide good results for conformational changes in proteins. The parameters for
  (
( and
and  ) and for
  (
( and
and  ) were calculated using Eqs. (3) and (4) as suggested in previous work30,32,33:
 |
(3) |
 |
(4) |
where  and
and  correspond to the total number of atoms and residues, respectively. The average total potential
  and dihedral
  potential energies were extracted from a 10-ns conventional MD simulation.
All aMD simulations were performed by employing the same setting up of conventional MD, such as force field, time step, temperature, pressure. A structure obtained after 10ns of classical MD simulations for every system was used as starting points for every aMD simulation. We simulate the same number of steps for either aMD or conventional MD, although in the case of aMD we do not report “time” but “number of steps” because it is difficult to estimate which timescale those steps correspond to in aMD simulations
Water solvation thermodynamic contributions
We counted the number of waters within a cylindrical region centered at the pocket, either using 400 ns of conventional MD simulations clustered according to Figure 2, or 200 ns of conventional MD simulations by restraining each of the conformations in Figure 2 [Fig. 7(a)].
Pocket solvation thermodynamic parameters were calculated using Grid Inhomogeneous Solvation Theory (GIST) code,15 which computes the thermodynamics contribution to the solvation free energy as water–protein enthalpy (Ewat-prot), water–water enthalpy (Ewat-wat), translational entropy (-TΔStrans) and orientational entropy (-TΔSorient) within a predefined grid region. We defined a region of (16 × 15 × 15) Å3 that includes the entire pocket to compute the four thermodynamic parameters [Fig. 7(b)]. The defined region also includes the cylinder used to count water molecules in the pocket during the MD simulations [Fig. 7(b)].
We performed the same GIST calculation for two more regions. The first one corresponds to the bulk and it is used as a reference in the calculations. The second one includes a polar region of the protein where water molecules interact strongly with the surface [Fig. 7(b)]. A 200-ns conventional MD simulations of trypsinogen with its structure restrained were used to compute the thermodynamic parameters. Convergence to within 5% error was observed after 80–100 ns. Different grid parameters (edges, center, etc.) result in different estimates for the volume, however the same trends were conserved.
Acknowledgments
The authors thank Mike Gilson and Crystal Nguyen for providing the GIST code and Mehrnoosh Arrar for close reading of the manuscript. Leonardo Boechi is a Latin American Pew fellowship recipient.
References
- Hedstrom L. Serine protease mechanism and specificity. Chem Rev. 2002;102:4501–4524. doi: 10.1021/cr000033x. [DOI] [PubMed] [Google Scholar]
- Coughlin SR. Thrombin signalling and protease-activated receptors. Nature. 2000;407:258–264. doi: 10.1038/35025229. [DOI] [PubMed] [Google Scholar]
- Gandhi PS, Chen Z, Appelbaum E, Zapata F, Di Cera E. Structural basis of thrombin–protease-activated receptor interactions. Iubmb Life. 2011;63:375–382. doi: 10.1002/iub.461. [DOI] [PubMed] [Google Scholar]
- Joseph K, Ghebrehiwet B, Kaplan AP. Activation of the kinin-forming cascade on the surface of endothelial cells. Biol Chem. 2001;382:71–75. doi: 10.1515/BC.2001.012. [DOI] [PubMed] [Google Scholar]
- Neurath H. Evolution of proteolytic enzymes. Science. 1984;224:350–357. doi: 10.1126/science.6369538. [DOI] [PubMed] [Google Scholar]
- Bode W. The transition of bovine trypsinogen to a trypsin-like state upon strong ligand binding: II. The binding of the pancreatic trypsin inhibitor and of isoleucine-valine and of sequentially related peptides to trypsinogen and to p-guanidinobenzoate-trypsinogen. J Mol Biol. 1979;127:357–374. doi: 10.1016/0022-2836(79)90227-4. [DOI] [PubMed] [Google Scholar]
- Huber R, Bode W. Structural basis of the activation and action of trypsin. Acc Chem Res. 1978;11:114–122. [Google Scholar]
- Bah A, Chen Z, Bush-Pelc LA, Mathews FS, Cera ED. Crystal structures of murine thrombin in complex with the extracellular fragments of murine protease-activated receptors PAR3 and PAR4. Proc Natl Acad Sci USA. 2007;104:11603–11608. doi: 10.1073/pnas.0704409104. [DOI] [PMC free article] [PubMed] [Google Scholar]
- Pozzi N, Chen R, Chen Z, Bah A, Di Cera E. Rigidification of the autolysis loop enhances Na+ binding to thrombin. Biophys Chem. 2011;159:6–13. doi: 10.1016/j.bpc.2011.04.003. [DOI] [PMC free article] [PubMed] [Google Scholar]
- Bode W, Turk D, Karshikov A. The refined 1.9-A X-ray crystal structure of D-Phe-Pro-Arg chloromethylketone-inhibited human alpha-thrombin: structure analysis, overall structure, electrostatic properties, detailed active-site geometry, and structure-function relationships. Protein Sci Publ Protein Soc. 1992;1:426–471. doi: 10.1002/pro.5560010402. [DOI] [PMC free article] [PubMed] [Google Scholar]
- Brünger AT, Huber R, Karplus M. Trypsinogen-trypsin transition: a molecular dynamics study of induced conformational change in the activation domain. Biochemistry (Mosc.) 1987;26:5153–5162. doi: 10.1021/bi00390a039. [DOI] [PubMed] [Google Scholar]
- Hedstrom L, Lin TY, Fast W. Hydrophobic interactions control zymogen activation in the trypsin family of serine proteases. Biochemistry (Mosc.) 1996;35:4515–4523. doi: 10.1021/bi951928k. [DOI] [PubMed] [Google Scholar]
- Renatus M, Engh RA, Stubbs MT, Huber R, Fischer S, Kohnert U, Bode W. Lysine 156 promotes the anomalous proenzyme activity of tPA: X-ray crystal structure of single-chain human tPA. EMBO J. 1997;16:4797–4805. doi: 10.1093/emboj/16.16.4797. [DOI] [PMC free article] [PubMed] [Google Scholar]
- Pasternak A, White A, Jeffery CJ, Medina N, Cahoon M, Ringe D, Hedstrom L. The energetic cost of induced fit catalysis: crystal structures of trypsinogen mutants with enhanced activity and inhibitor affinity. Protein Sci Publ Protein Soc. 2001;10:1331–1342. doi: 10.1110/ps.44101. [DOI] [PMC free article] [PubMed] [Google Scholar]
- Nguyen CN, Young TK, Gilson MK. Grid inhomogeneous solvation theory: hydration structure and thermodynamics of the miniature receptor cucurbit[7]uril. J Chem Phys. 2012;137:044101. doi: 10.1063/1.4733951. [DOI] [PMC free article] [PubMed] [Google Scholar]
- Walter J, Steigemann W, Singh TP, Bartunik H, Bode W, Huber R. On the disordered activation domain in trypsinogen: chemical labelling and low-temperature crystallography. Acta Crystallogr B. 1982;38:1462–1472. [Google Scholar]
- Bode W, Huber R. Induction of the bovine trypsinogen–trypsin transition by peptides sequentially similar to the N-terminus of trypsin. FEBS Lett. 1976;68:231–236. doi: 10.1016/0014-5793(76)80443-7. [DOI] [PMC free article] [PubMed] [Google Scholar]
- Bode W, Huber R. Crystal structure analysis and refinement of two variants of trigonal trypsinogen: trigonal trypsin and PEG (polyethylene glycol) trypsinogen and their comparison with orthorhombic trypsin and trigonal trypsinogen. FEBS Lett. 1978;90:265–269. doi: 10.1016/0014-5793(78)80382-2. [DOI] [PubMed] [Google Scholar]
- Bode W, Walter J, Huber R, Wenzel HR, Tschesche H. The refined 2.2-A (0.22-nm) X-ray crystal structure of the ternary complex formed by bovine trypsinogen, valine–valine and the Arg15 analogue of bovine pancreatic trypsin inhibitor. Eur J Biochem FEBS. 1984;144:185–190. doi: 10.1111/j.1432-1033.1984.tb08447.x. [DOI] [PubMed] [Google Scholar]
- Bolognesi M, Gatti G, Menagatti E, Guarneri M, Marquart M, Papamokos E, Huber R. Three-dimensional structure of the complex between pancreatic secretory trypsin inhibitor (Kazal type) and trypsinogen at 1.8 A resolution. Structure solution, crystallographic refinement and preliminary structural interpretation. J Mol Biol. 1982;162:839–868. doi: 10.1016/0022-2836(82)90550-2. [DOI] [PubMed] [Google Scholar]
- Wahlgren WY, Pál G, Kardos J, Porrogi P, Szenthe B, Patthy A, Gráf L, Katona G. The catalytic aspartate is protonated in the michaelis complex formed between trypsin and an in vitro evolved substrate-like inhibitor. A refined mechanism of serine protease action. J Biol Chem. 2011;286:3587–3596. doi: 10.1074/jbc.M110.161604. [DOI] [PMC free article] [PubMed] [Google Scholar]
- Gordon JC, Myers JB, Folta T, Shoja V, Heath LS, Onufriev A. H++: a server for estimating pKas and adding missing hydrogens to macromolecules. Nucleic Acids Res. 2005;33:W368–W371. doi: 10.1093/nar/gki464. [DOI] [PMC free article] [PubMed] [Google Scholar]
- Hornak V, Abel R, Okur A, Strockbine B, Roitberg A, Simmerling C. Comparison of multiple Amber force fields and development of improved protein backbone parameters. Proteins. 2006;65:712–725. doi: 10.1002/prot.21123. [DOI] [PMC free article] [PubMed] [Google Scholar]
- Jorgensen WL, Chandrasekhar J, Madura JD, Impey RW, Klein ML. Comparison of simple potential functions for simulating liquid water. J Chem Phys. 1983;79:926. [Google Scholar]
- Ryckaert J-P, Ciccotti G, Berendsen H. Numerical integration of the cartesian equations of motion of a system with constraints: molecular dynamics of n-alkanes. J Comput Phys. 1977;23:341, 327. [Google Scholar]
- Berendsen H, Postma J. Molecular dynamics with coupling to an external bath. J Chem Phys. 1984;81:3684–3690. [Google Scholar]
- Hamelberg D, Mongan J, McCammon JA. Accelerated molecular dynamics: a promising and efficient simulation method for biomolecules. J Chem Phys. 2004;120:11919. doi: 10.1063/1.1755656. [DOI] [PubMed] [Google Scholar]
- De Oliveira CAF, Hamelberg D, McCammon JA. Estimating kinetic rates from accelerated molecular dynamics simulations: alanine dipeptide in explicit solvent as a case study. J Chem Phys. 2007;127:175105. doi: 10.1063/1.2794763. [DOI] [PubMed] [Google Scholar]
- Bucher D, Pierce LCT, McCammon JA, Markwick PRL. On the use of accelerated molecular dynamics to enhance configurational sampling in ab initio simulations. J Chem Theory Comput. 2011;7:890–897. doi: 10.1021/ct100605v. [DOI] [PMC free article] [PubMed] [Google Scholar]
- Wereszczynski J, McCammon JA. Accelerated molecular dynamics in computational drug design. Methods Mol Biol. 819:515–524. doi: 10.1007/978-1-61779-465-0_30. [DOI] [PubMed] [Google Scholar]
- Boechi L, de Oliveira CAF, Da Fonseca I, Kizjakina K, Sobrado P, Tanner JJ, McCammon JA. Substrate-dependent dynamics of UDP-galactopyranose mutase: implications for drug design. Protein Sci Publ Protein Soc. 2013;22:1490–1501. doi: 10.1002/pro.2332. [DOI] [PMC free article] [PubMed] [Google Scholar]
- Fuglestad B, Gasper PM, Tonelli M, McCammon JA, Markwick PRL, Komives EA. The dynamic structure of thrombin in solution. Biophys J. 2012;103:79–88. doi: 10.1016/j.bpj.2012.05.047. [DOI] [PMC free article] [PubMed] [Google Scholar]
- Cervantes CF, Markwick PRL, Sue S-C, McCammon JA, Dyson HJ, Komives EA. Functional dynamics of the folded ankyrin repeats of IκBα revealed by nuclear magnetic resonance. Biochemistry (Mosc.) 2009;48:8023–8031. doi: 10.1021/bi900712r. [DOI] [PMC free article] [PubMed] [Google Scholar]


