

Abstract
Background
An unbiased systems approach was utilized to define energy metabolic events that occur during the pathologic cardiac remodeling en route to heart failure.
Methods and Results
Combined myocardial transcriptomic and metabolomic profiling were conducted in a well-defined mouse model of heart failure that allows comparative assessment of compensated and decompensated (heart failure) forms of cardiac hypertrophy due to pressure overload. The pressure overload datasets were also compared with the myocardial transcriptome and metabolome for an adaptive (physiological) form of cardiac hypertrophy due to endurance exercise training. Comparative analysis of the datasets led to the following conclusions: 1) expression of most genes involved in mitochondrial energy transduction were not significantly changed in the hypertrophied or failing heart, with the notable exception of a progressive downregulation of transcripts encoding proteins and enzymes involved in myocyte fatty acid transport and oxidation during the development of heart failure; 2) tissue metabolite profiles were more broadly regulated than corresponding metabolic gene regulatory changes, suggesting significant regulation at the post-transcriptional level; 3) metabolomic signatures distinguished pathologic and physiological forms of cardiac hypertrophy and served as robust markers for the onset of heart failure; and 4) the pattern of metabolite derangements in the failing heart suggests “bottlenecks” of carbon substrate flux into the Krebs cycle.
Conclusions
Mitochondrial energy metabolic derangements that occur during the early development of pressure overload-induced heart failure involve both transcriptional and post-transcriptional events. A subset of the myocardial metabolomic profile robustly distinguished pathologic and physiologic cardiac remodeling.
Keywords: transcriptomics, metabolomics, heart failure, energy metabolism, mitochondria
Evidence is emerging that derangements in cardiac energy metabolism and mitochondrial function contribute to the pathologic remodeling that leads to heart failure. During pathological hypertrophic growth due to chronic pressure overload, the heart undergoes a re-programming of its fuel preference to a “fetal” format, shifting towards glucose, away from reliance on fatty acids, the chief energy substrate for the normal adult mammalian heart.1-8 The capacity of cardiac mitochondria to generate ATP is also compromised during the development of heart failure. Studies conducted in animal models and in humans have shown that myocardial high-energy phosphate stores (phosphocreatine levels), the main reservoir source of ATP, are reduced in the hypertrophied and failing heart.9-13 The potential role of fuel metabolic and bioenergetic disturbances as causal in heart failure is also supported by the observation that human inborn errors in mitochondrial fuel catabolism and ATP production cause cardiomyopathy.14-16
There is considerable interest in delineating the molecular regulatory events involved in the metabolic re-programming of the hypertrophied and failing heart. To date, studies have focused largely on candidate gene regulatory mechanisms in severe, late-stage disease. Accordingly, such studies do not necessarily provide insight into the primary mechanisms that drive energy metabolic alterations that occur in the early stages of pathological cardiac remodeling. Characterization of the fuel and energy metabolic disturbances, and corresponding upstream regulatory events occurring during the early stages of heart failure is an important first step towards the identification of new therapeutic targets for the early-stage treatment of heart failure.
In this study, unbiased transcriptomic and targeted quantitative metabolomic profiling were conducted to identify metabolic gene regulatory events and corresponding changes in metabolite pools that occur during the development of heart failure due to pressure overload in mice. The results were compared with that of an adaptive form of cardiac hypertrophy secondary to endurance exercise training. Surprisingly, we found that whereas transcriptional control of fatty acid oxidation (FAO) was altered, many genes involved in downstream mitochondrial energy transduction and ATP synthesis were not significantly regulated in the early stages of heart failure or in the exercise-trained heart. In striking contrast, myocardial metabolite profiles were distinct across each cardiac phenotype, providing robust signatures for the transition to heart failure, as well distinguishing pathologic versus physiological forms of cardiac hypertrophy.
Methods
An expanded Methods section, including all procedures used in this report, is available in the Data Supplement. In brief, all animal experiments and euthanasia protocols were conducted in strict accordance with the NIH guidelines for humane treatment of animals and approved by the IACUC Committee at the Sanford-Burnham Medical Research Institute at Lake Nona. 8 week old female C57BL/6J mice in the following groups were utilized: compensated hypertrophy (CH) vs sham controls; heart failure (HF) vs sham controls; physiological hypertrophy (PH) vs sedentary controls. CH was achieved by transverse aortic constriction (TAC). HF was achieved by TAC plus a small apical myocardial infarction. Mice were harvested 1 month following each procedure. PH was achieved by 8 weeks on a voluntary running wheel. At the end of all studies, hearts were excised and transcriptomic and metabolomics profiling was performed. The gene array data discussed in this publication have been deposited in NCBI’s Gene Expression Omnibus and are accessible through GEO Series accession number GSE56348. Validation by qRT-PCR was performed. Primer sets can be found in Supplemental Table 1. Data were analyzed using nonparametric Mann-Whitney test (GraphPad Prism 6), two-tailed, unless otherwise noted. For pathway analysis, Fisher’s exact test was used to denote significance. For all statistics, the level of significance was set at p < 0.05, and data are reported as mean ± S.D. unless otherwise noted.
Results
In order to identify metabolic changes that occur in the relatively early stages of pressure overload-induced cardiac left ventricular (LV) remodeling, a mouse model of chronic pressure overload was used. LV pressure overload was induced by performing transverse aortic constriction (TAC) on female C57BL/6J mice as previously described.17 In this model, mice develop significant LV hypertrophy with preserved systolic LV function at the 4-week time point after the TAC procedure, referred to here as compensated hypertrophy (CH). As expected, the CH group developed significant LV hypertrophy 4 weeks after TAC compared to sham-operated controls [(bi-ventricle weight/body weight, 6.55±1.58 (n=13) vs 4.00±0.22 (n=17), p < 0.001)] with preserved LV function (data not shown). In a second experimental group, TAC was combined with a small apical myocardial infarction achieved by placing a ligature in the distal portion of the left anterior descending coronary artery (LAD) resulting in global LV systolic and diastolic dilatation, and significantly reduced LV ejection fraction 4 weeks after the procedure (Supplemental Figure 1 and Supplemental Table 2), termed the heart failure (HF) group. Notably, this HF model results in global pathological remodeling [(bi-ventricle weight/body weight, 7.08±1.21 (n=23) vs 4.10±0.32 (n=30), p < 0.001)], without evidence of fibrosis outside of the excised infarct region, consistent with early stage heart failure (data not shown). The apical myocardial infarction alone did not result in significant LV remodeling (Supplemental Figure 1). Transcriptomic and quantitative targeted metabolomic profiling were conducted on ventricular samples harvested from CH and HF groups and corresponding sham-operated controls. The infarcted apical region was removed from the HF hearts and corresponding tissue region was removed from sham-operated control samples.
Transcriptomic profiling of pathological cardiac hypertrophy and heart failure
Gene expression profiling was conducted on samples from the four groups followed by informatics analyses (see Supplemental Methods). Genes with a posterior probability of greater than or equal to 0.95 were considered significantly differentially expressed (DE) relative to corresponding sham-operated control mice. 1080 genes were DE in the CH group (731 upregulated; 349 downregulated) and 1627 genes were regulated in the HF group (947 upregulated; 680 downregulated). Notably, the majority of genes that were DE in the CH group were also DE in the HF group (Figure 1A). In addition, genes that were DE in both CH and HF were almost always directionally concordant (Figure 1B). The directional expression of DE genes in CH and HF groups was highly positively correlated (R2 = 0.9, and p=2×10-16; Figure 1B). These results indicate that the majority of gene regulatory events in HF were initiated in CH.
Figure 1. Myocardial transcriptional profiles for compensated (CH) and decompensated (HF) pathologic cardiac hypertrophy exhibit significant concordance.
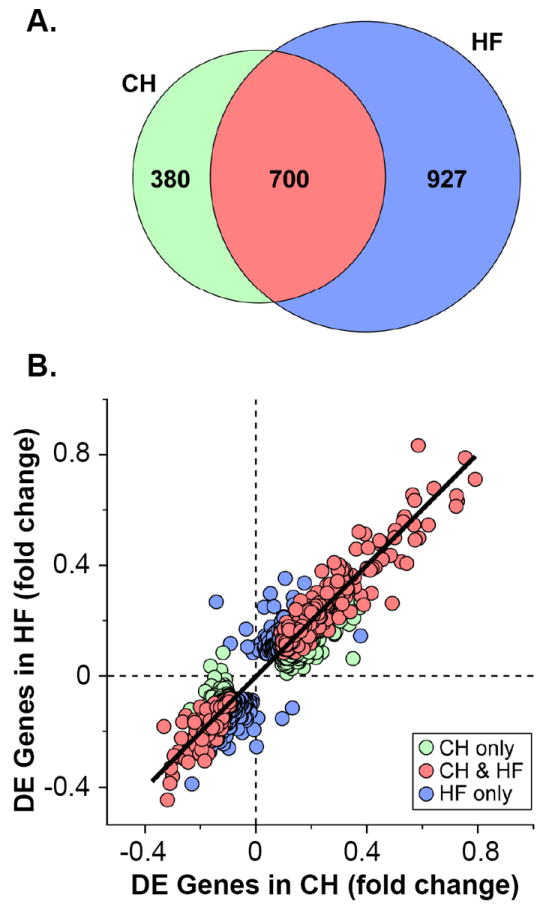
(A) Venn diagram showing differentially expressed (DE) genes in CH (left, n=5) or HF groups (right, n=5) compared to corresponding sham-operated controls (n=5 per group). The overlapping region (red) represents DE genes in both groups. (B) Scatter plot showing genes exhibiting DE ≥ 0.950 in either CH (green circles), HF (blue circles), or both (red circles) groups compared to corresponding controls. The log10-transformed fold change of genes in CH is shown on the x-axis, and corresponding fold change for HF is shown on the y-axis, plotted on a linear scale.
Ingenuity Pathway Analysis (IPA) analysis was conducted with the gene expression datasets to identify regulated pathways and biological processes in the CH and HF groups. Separate analyses were performed for genes upregulated or downregulated in each group compared to corresponding controls. Multiple pathways involved in metabolism were represented by downregulated genes in both CH and HF groups (Supplemental Tables 3 and 4). In contrast, and consistent with the hypertrophic growth response, many pathways involved in inflammation, growth, and cellular assembly/organization/movement were identified by upregulated genes in both CH and HF groups (Supplemental Tables 3 and 4).
A significant proportion of downregulated genes were noted in pathways involved in fatty acid uptake, transport, and catabolism in the CH and HF groups, with a greater number in the latter group (Supplemental Tables 3 and 4). Specifically, genes involved in FAO (Acaa2, Ecil, Acadvl, Hadh), fatty acid uptake (Slc27a1, Acsl5, Acsl6), and acyl trafficking (Cpt2) were significantly downregulated in the HF group (Supplemental Table 5). The extent of this regulation among several key lipid utilization pathways is shown in greater detail in Figure 2. These results serve as a form of validation for the transcriptional profiling dataset given that many published studies have shown that genes involved in cardiac myocyte fatty acid uptake and oxidation are downregulated in the hypertrophied and failing heart.8,18-22
Figure 2. Altered expression of genes involved in fatty acid catabolic pathways in HF.
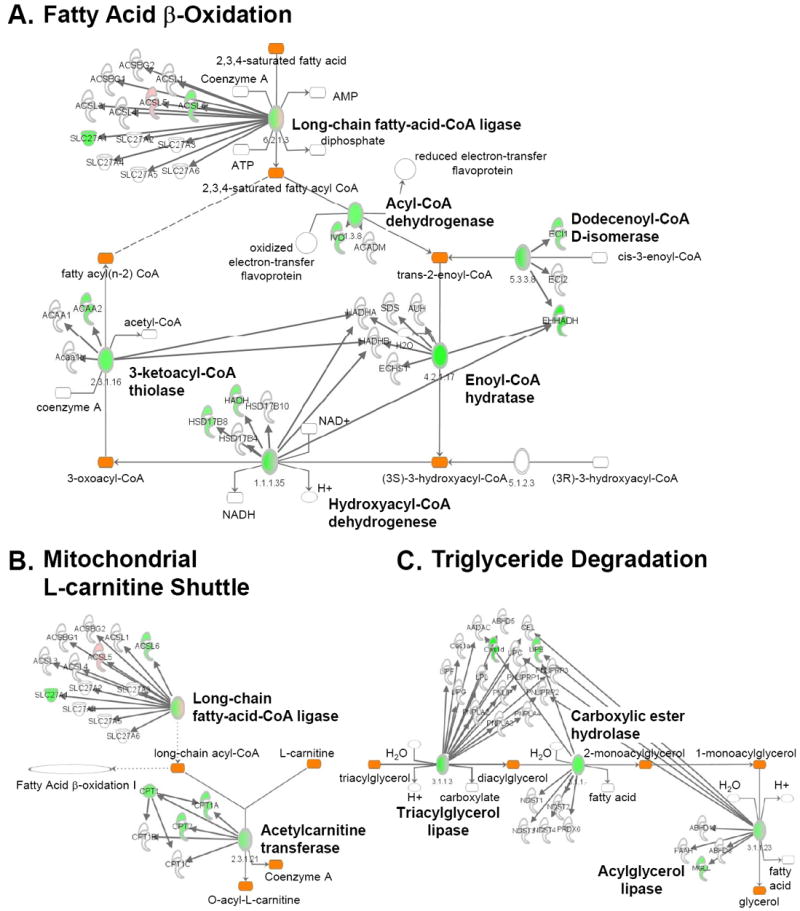
Pathway map showing cardiac genes significantly (DE ≥ 0.950) upregulated (pink) or downregulated (green) compared to controls. Pathways involved in lipid utilization are shown including FAO (A), mitochondrial L-carnitine shuttle (B), and triglyceride degradation (C) as identified by IPA (see Supplemental Methods). The ovals in the map represent enzyme complexes with components of each gene/enzyme displayed individually as denoted by the arrows. The intensity of the color within the symbols and ovals denotes the degree of regulation.
The transcriptomic analyses identified amino acid metabolism as a second regulated metabolic pathway category in the CH and HF samples. Regulation in this category largely reflected downregulation of genes involved in amino acid degradation pathways (Supplemental Tables 3 and 4). Specifically, expression of genes involved in the degradation of proline, alanine, tryptophan, and branched-chain amino acids (BCAA) were downregulated (Supplemental Table 6 and Figure 3). These results are of interest given that several of these pathways can serve as sources of anaplerotic input into the tricarboxylic acid (TCA) cycle.
Figure 3. Altered expression of genes involved in amino acid degradation in HF.
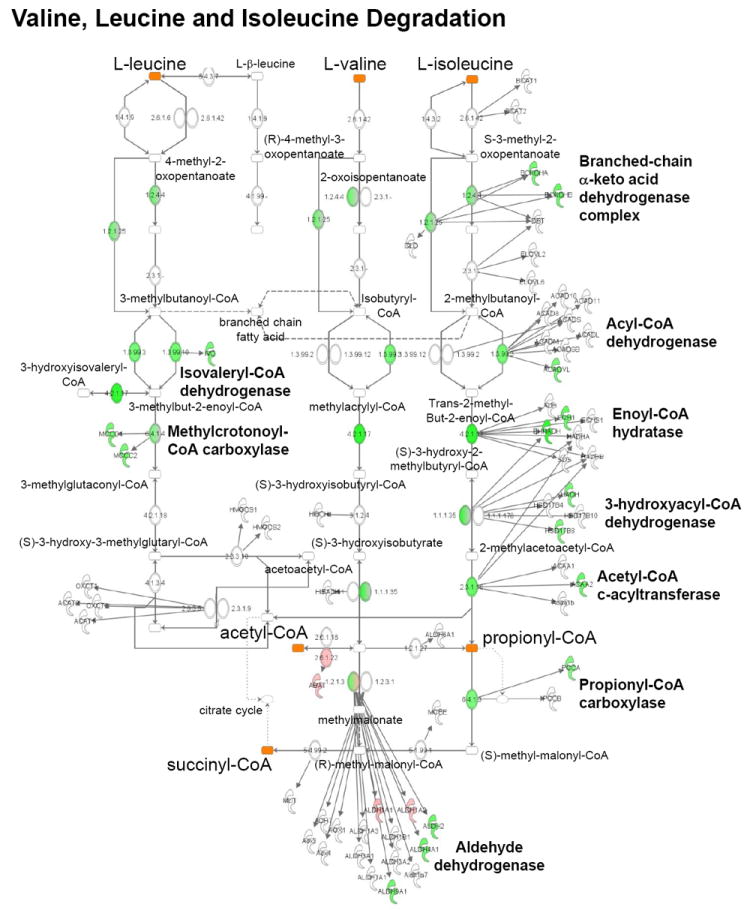
Pathway map showing myocardial genes significantly (DE ≥ 0.950) upregulated (pink) or downregulated (green) compared to controls in valine, leucine, and isoleucine degradation pathways identified by IPA.
A number of published gene expression profiling studies conducted largely in severe end-stage heart failure in several different models and species have demonstrated downregulated expression of genes involved in the electron transport complex (ETC) and oxidative phosphorylation (OXPHOS).23-26 Surprisingly, we found very little regulation of genes involved in ETC, OXPHOS, or the tricarboxylic acid (TCA) cycle in either the CH (data not shown) or HF groups (Supplemental Figure 2).
Metabolomic profiling of pathological cardiac hypertrophy and heart failure
The transcriptomic data did not identify many signatures that distinguished HF from CH, particularly in metabolic pathways. Accordingly, metabolomic profiling was conducted to determine whether metabolite levels could provide additional insight into the energy metabolic changes that occur during the progression from compensated cardiac hypertrophy to heart failure. Samples from the CH and HF groups and corresponding controls were subjected to targeted quantitative metabolomics using mass spectrometry to define levels of metabolites in three main classes relevant to several mitochondrial fuel metabolic pathways: acylcarnitines (FAO), organic acids (lactate/pyruvate oxidation and the TCA cycle), and amino acids. In contrast to the profile of metabolic gene regulation, the metabolomics data revealed a distinctly different pattern in the HF group compared to the CH group (Supplemental Table 7). Indeed, there were relatively few differences in metabolite levels from the CH samples compared to the control samples. The most striking distinguishing metabolite signature in the HF group was exhibited in the acylcarnitine profile. Levels of many acylcarnitine species were increased in the HF group compared to controls (Figure 4 and Supplemental Table 7). This was particularly notable for the long-chain (C14-C18) species. In addition, C2 carnitine levels (acetylcarnitine) were significantly increased in the HF samples. Consistent with increased levels of acylcarnitine esters, free carnitine levels (C0 carnitine) were modestly but significantly decreased in the HF group (Figure 4).
Figure 4. Accumulation of acylcarnitine esters in myocardial samples from the HF group.
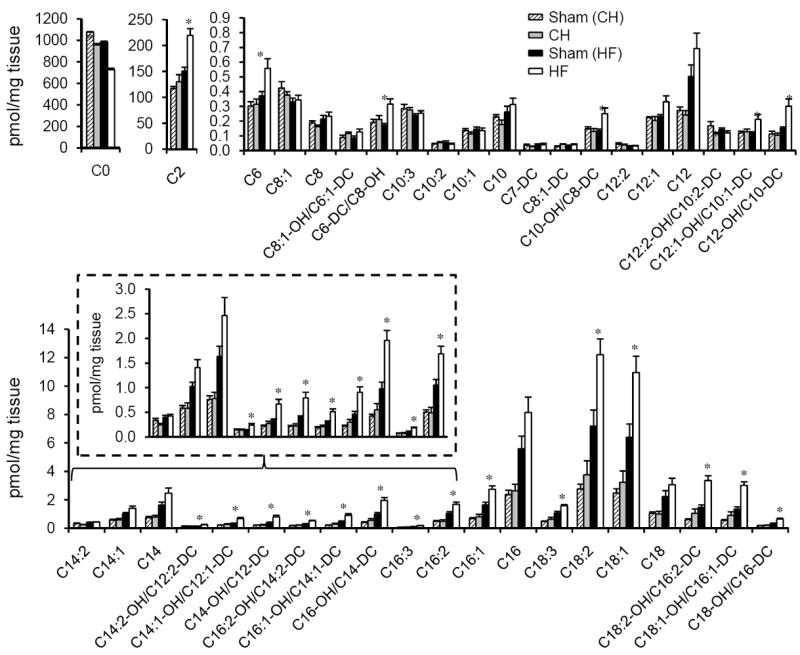
Levels of free carnitine (C0) and acylcarnitine species isolated from the bi-ventricle of CH (n=6) and HF (n=6) hearts and corresponding sham-operated controls are indicated by the labels on the x-axis. Acyl chain lengths are denoted by the numbers. Acylcarnitine species that represent monohydroxylated (OH) or dicarboxylic acid (DC) species are also shown. Note that the OH and DC carnitine species are isobaric and, thus, were not separated in this analysis. Bars represent mean ± S.E. *p< 0.05 compared with corresponded sham-operated controls (n=6).
The organic acid profile also revealed interesting differences between the CH and HF groups. First, lactate levels and the lactate/pyruvate ratio were increased in HF but not CH, suggesting reduced flux of pyruvate into the TCA cycle with diversion to lactate (Figure 5A and Supplemental Table 7). Second, levels of most TCA cycle intermediates (fumarate, malate, α-ketoglutarate) were decreased in HF (Figure 5B). One exception was succinate which was increased in the HF group (Figure 5B). The amino acid profile was less remarkable (Figure 5C and Supplemental Table 7). However, a few modest but significant differences were noted including increased levels of Asx (aspartic acid/asparagine) in the HF group (Figure 5C). In addition, with minor exceptions, changes in cardiac metabolites were not reflected in circulating plasma metabolite levels (Supplemental Table 8). Notably, a small but significant increase in some branched-chain amino acids (Leu/Ile) was observed in the plasma but not myocardium of the HF group.
Figure 5. Altered myocardial organic acid and amino acid levels in HF samples.
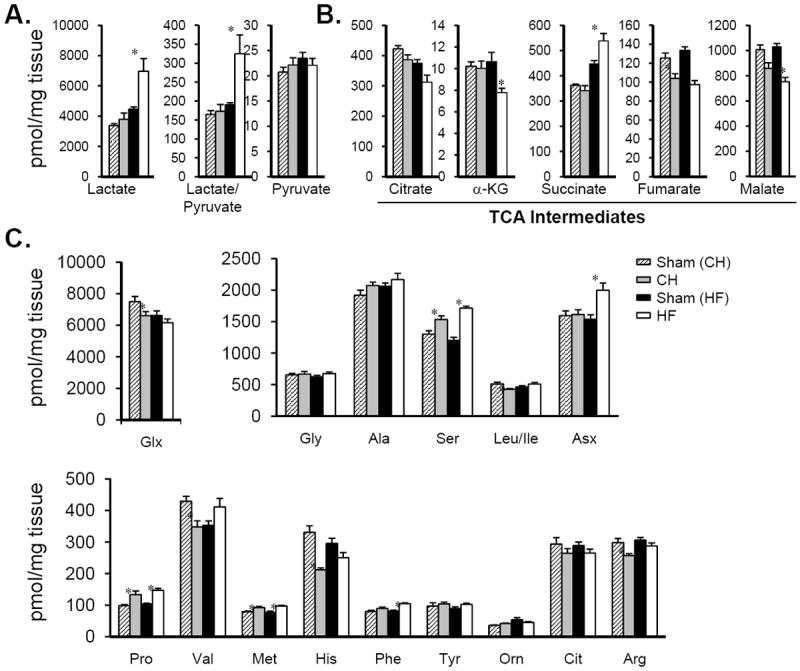
Metabolite profiles showing (A) lactate and pyruvate, (B) organic acid intermediates within the TCA cycle and (C) amino acids determined in samples isolated from the bi-ventricle of CH (n=6), HF (n=6) and corresponding control hearts. Bars represent mean ± S.E. *p< 0.05 compared with corresponding sham-operated control.
The observed elevation of long-chain acylcarnitine species together with a general reduction in TCA cycle intermediates in the HF group suggested a “bottleneck” of carbon flux within the FAO pathway. The reduced expression of a subset of genes involved in FAO observed in the transcriptomic profile in HF samples (Supplemental Table 5) is consistent with this hypothesis. To explore this further, quantitative PCR was used to determine the level of representative genes involved in the cellular uptake and mitochondrial β-oxidation of long-chain fatty acids, some of which were identified as downregulated in the gene expression array data. The expression of genes encoding the fatty acid transporter (Slc27a1) and enzymes involved in mitochondrial fatty acid uptake and oxidation (Cpt2 and Acadvl) were all significantly downregulated only in the HF group (Figure 6A). In addition, expression of the gene encoding Ehhadh, a peroxisomal β-oxidation enzyme, was also downregulated in the HF samples (Figure 6A). Consistent with reduced expression of genes involved in long-chain FAO, palmitoylcarnitine-driven state 3 respiration was significantly diminished in isolated cardiac muscle strips in the HF samples compared with control (Figure 6B). In contrast, respiration rates with pyruvate as a substrate were unchanged in the HF group, consistent with the conclusion that the deficit in palmitoylcarnitine-driven respiration in HF is a result of a decreased capacity for FAO (Figure 6B).
Figure 6. Reduced expression of genes involved in fatty acid uptake and oxidation in HF.
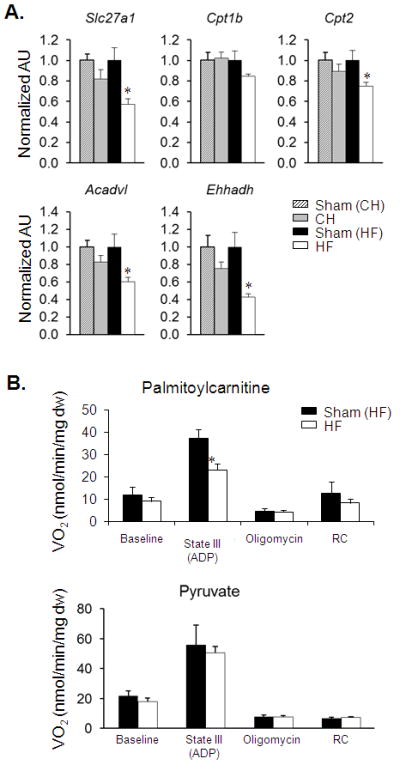
(A) Results of quantitative RT-PCR analysis of RNA extracted from hearts of CH (n=7), HF (n=7) and corresponding sham-operated controls (n=5-7) for the transcripts as labeled. Bars represent mean ± S.E. normalized (=1.0) to each sham control. *p < 0.05 compared to corresponding sham-operated control. (B) Mean (± S.E.) mitochondrial respiration rates of permeabilized cardiac muscle fiber strips prepared from HF mice (n=11) and sham-operated controls (n=5-8) using palmitoylcarnitine/malate (top) or pyruvate/malate (bottom) as substrate. Basal, state III (ADP-stimulated), and post-oligomycinrates are shown. Respiratory control ratio (RC) = state III/state IV. *p < 0.05 compared to Sham (HF).
To determine whether post-transcriptional changes in FAO enzyme levels contribute to the alteration in acylcarnitine levels, immunoblotting experiments were conducted on a subset of FAO enzymes for which the corresponding transcript was downregulated [very long-chain acyl-CoA dehydrogenase (VLCAD)] or unchanged [medium-chain acyl-CoA dehydrogenase (MCAD) and long-chain acyl-CoA dehydrogenase (LCAD)]. Consistent with the transcriptional profiling results, levels of VLCAD protein were reduced in the HF samples whereas LCAD and MCAD levels were unchanged (Supplemental Figure 3A).
Transcriptomic/metabolomic profiling of physiological cardiac hypertrophy
We next conducted cardiac transcriptomic and metabolomic profiling in an adaptive (physiological) cardiac growth state for comparison with the pressure overload datasets. To this end, cardiac ventricular samples obtained from C57BL/6J female mice subjected to a nocturnal wheel running-based exercise training regimen for 8 weeks were compared to gender-, strain- and age-matched control samples. This intervention has been shown to result in physiologic hypertrophy (PH) of the LV,27 albeit to a lesser degree than that achieved with the pressure overload regimen. The training regimen resulted in an approximately 10% increase in bi-ventricle weight/body weight (Supplemental Table 9).
The gene expression profiling results for the PH samples (compared to sedentary controls) revealed minimal regulation, with only 6 DE genes, none of which were within metabolic pathways (Supplemental Table 10). In contrast, significant changes were observed in the metabolome of the PH samples. Interestingly, the pattern of metabolite changes observed in the PH group was strikingly distinct from that of the HF profile. In contrast to the increase in long-chain acylcarnitines observed in HF, the levels of many medium- and long-chain acylcarnitines were decreased in the PH samples (Figure 7A and Supplemental Table 7). In addition, there was no change in acetylcarnitine levels in the PH group in contrast to the observed elevation in HF (Figures 7A and 4, and Supplemental Table 7). Differences were also noted in the organic acid species. Whereas both HF and PH exhibited reduced levels of a shared subset of organic acids (fumarate and malate), levels of succinate and lactate were reduced in PH but elevated in HF (Figures 7B, 5A, 5B and Supplemental Table 7). Lastly, there were modest but significant changes in a subset of amino acid levels including alanine, leucine/isoleucine, and Asx (Supplemental Table 7). As described above for the HF samples, levels of proteins for a subset of unregulated FAO transcripts were unchanged (Supplemental Figure 3B).
Figure 7. Metabolomic profile of exercise-trained mouse heart.
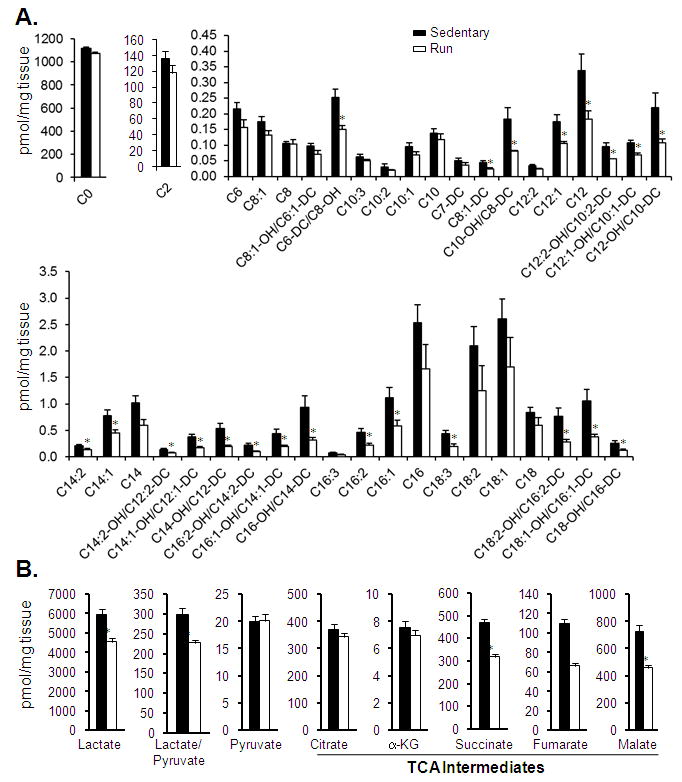
Levels of (A) free carnitine (C0), acetylcarnitine (C2), and other acylcarnitine species, and (B) organic acids isolated from the bi-ventricle of PH hearts (Run). Bars represent mean ± S.E. *p< 0.05 compared with age-, gender- (female), and strain (C57BL/6J)-matched sedentary controls (n=6 per group).
Comparative analysis of transcriptomic and metabolomic profiles across the phenotypic groups
We next compared the collective results of our transcriptomic and metabolomic analyses. This comparative analysis is depicted in heat maps (Figure 8) displaying the level and direction of differential expression compared to the corresponding controls. This comparative analysis, which was restricted to the subset of genes involved in mitochondrial fuel and energy metabolism relevant to the metabolites measured in the metabolomic analyses, led to several major conclusions. First, as noted above, a subset of genes involved in cellular fatty acid uptake/oxidation were downregulated in both the CH and to a greater extent the HF groups. Second, in contrast to the lipid utilization genes, the majority of genes involved in downstream mitochondrial energy transduction pathways, including ETC and OXPHOS, were not significantly regulated in the hypertrophied and failing heart. This observation is further highlighted by comparing the metabolic gene expression profiles in the CH and HF samples with the corresponding gene expression data obtained previously28 from the hearts of mice deficient for the transcriptional coactivators, PGC-1α and PGC-1β, master regulators of genes involved in mitochondrial energy metabolism29-32 (Figure 8A). Third, very few gene regulatory changes were observed in the hearts undergoing adaptive physiological cardiac hypertrophy (PH group) (Figure 8A).
Figure 8. Comparative analysis of transcriptomic and metabolomic profiles representing mitochondrial energy metabolic pathways for CH, HF, and PH hearts.
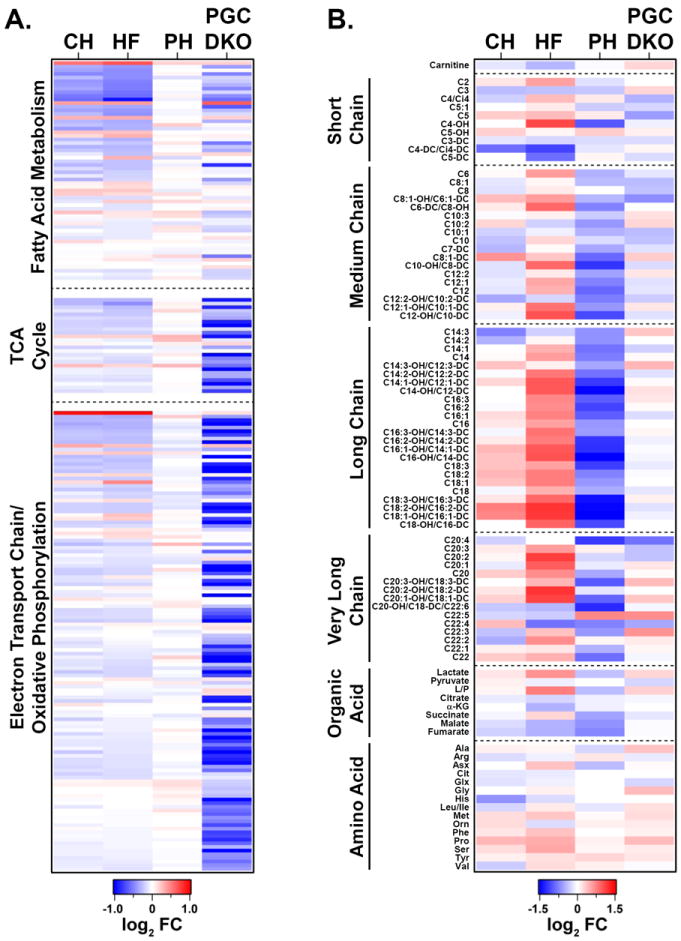
(A) A heat map containing gene expression array datasets representing the level of expression of genes in fatty acid utilization, TCA cycle, and ETC/OXPHOS pathways defined by IPA for CH, HF, PH, and adult PGC-1αβ-/- hearts (PGC DKO; n=5 per group). Each row represents the log2-transformed fold change compared with corresponding controls. The pathways are ranked according to the posterior probabilities in HF, top being the most significant. Downregulation in blue and upregulation in red. (B) Heat map containing the log2-transformed ratio of the mean relative levels of acylcarnitines, organic acids, and amino acids among CH, HF, PH, and adult PGC-1αβ-/- hearts (n=6) compared to corresponding controls. The intensity of color indicates the magnitude of the fold change.
In contrast to the transcriptomic results, the metabolomic signatures served as a robust correlate of the cardiac phenotype (Figure 8B), distinguishing the CH, HF, and PH groups (Figure 8B). This was particularly evident upon analysis of acylcarnitine species, many of which were unchanged in CH, increased in HF, and decreased in PH. The organic acid profile was also distinct among the metabolites as described above. Taken together, these results indicate that metabolite levels distinguished the cardiac hypertrophic phenotype and that post-transcriptional regulatory events contribute to the metabolic re-programming that occurs in HF and PH. In addition, many observed changes in gene expression do not correlate with changes in metabolite pool size changes or cardiac dysfunction. This latter point is underscored by the observed lack of alterations in metabolite pools in the hearts of the PGC-1αβ-/- hearts which exhibit widespread downregulation in the expression of genes involved in mitochondrial metabolism (Figure 8A) yet exhibit normal cardiac function28 and minimal changes in the metabolome (Figure 8B).
Discussion
Herein we undertook an unbiased approach to identify changes in energy metabolic gene expression and metabolite pools in several forms of cardiac hypertrophy and in the early stages of heart failure in a mouse model. The results demonstrated the power of employing combined unbiased molecular profiling to define signatures of complex physiological and disease states.
The transcriptional profiling results were remarkable for the lack of changes in expression of genes involved in ETC and OXPHOS. These results were surprising given that a number of previously published studies conducted in heart failure animal models and in humans with heart failure have shown reduced expression of ETC and OXPHOS genes and proteins.23-26 However, most of these studies focused on later stages of heart failure, suggesting that many of the observed metabolic gene regulatory events reflect irreversible mitochondrial dysfunction and myocyte death. In this study, focused on earlier stages with less severe pathological cardiac remodeling, we found a more selective pattern of altered metabolic gene regulation including a significant subset of genes involved in lipid and amino acid metabolism. The observed reduction in expression of genes involved in mitochondrial FAO serve as a validation of our gene expression profiling, given that this pathway has been shown to be downregulated in many studies of pressure overload-induced cardiac hypertrophy and heart failure, in a variety of animal models and humans.8,18-22 We also found that expression of a subset of genes involved in amino acid degradation pathways were downregulated in CH and HF. The relevance of this finding is unclear but could relate to the balance between growth and catabolism. Specifically, cardiac hypertrophic growth requires activation of anabolic pathways involved in protein synthesis, which may result in feedback suppression of amino acid degradation pathways. This finding could also have implications for fuel metabolism given that several of the downregulated amino acid catabolic pathways serve as an important source of anaplerotic carbon for the TCA cycle.
The metabolite profile served to robustly distinguish between the various cardiac phenotypes in this study. Many species in the acylcarnitine profile were elevated in the HF group, but were normal in CH. In addition, elevations in lactate and acetylcarnitine levels, along with a reduction in most organic acid TCA cycle intermediates were specific to the HF samples. Taken together, this metabolite accumulation pattern suggests a “bottleneck” in carbon flux (fatty acids and glucose) into the TCA cycle, which could reduce capacity to generate the reducing equivalents needed to generate ATP contributing to contractile dysfunction. During preparation of this manuscript, Sansbury et al reported the results of global metabolomic profiling in a mouse model of TAC and MI.33 In contrast to our results, this study reported a reduced level of acylcarnitines in the TAC and MI model. The basis for this difference is unknown but could relate to co-existing severe ischemic insult or the duration of the heart failure (8 weeks in the study by Sansbury et al). Taken together, these findings suggest the interesting possibility that the myocardial metabolite profile reflects stage and etiology of the heart failure.
The metabolite profile was also regulated to a greater extent than the transcriptome in the exercise-trained heart. Interestingly, the regulated metabolite levels in the adaptive hypertrophy (PH) samples were generally directionally discordant from the pattern observed in the HF group. Specifically, in contrast to the failing heart, many acylcarnitine and organic acid species were concordantly decreased in the trained heart, suggesting matched carbon flux (absence of “bottlenecking”). Consistent with this conclusion, acetylcarnitine and lactate levels were normal. It should be noted that several previously published studies have shown a somewhat larger number of genes regulated in heart following exercise training.34-38 The basis for this difference is not clear but could relate to training protocol, species, or degree of cardiac hypertrophy achieved.
Several limitations of this study should be noted. First, the studies were only conducted with female animals. Accordingly, we cannot conclude that the same results will be seen in male mice. Second, the HF model involved pressure overload together with a small apical infarct which results in a predictable global LV dilatation and reduced ejection fraction. This approach allowed us to compare animals with compensated (CH) versus decompensated (HF) LV hypertrophy at the same relatively early time point (4 weeks). It is possible that the molecular profiling results shown here will differ from other HF models. Future comparative studies will be important to address this question.
The striking differences observed between the transcriptomic and metabolite profiles suggest that significant post-translational regulatory events may be operative in the metabolic re-programming that occurs during the early stages of heart failure. Evidence is emerging that changes in the levels of mitochondrial metabolite pools, such as acetyl-CoA and succinyl-CoA can lead to modification of mitochondrial enzyme function through acetylation and succinylation, respectively.39-45 Indeed, a recent study has shown that heart failure in mice due to targeted disruption of Ndufs4 involves a significant component of mitochondrial protein hyperacetylation and alterations in metabolite pools.42 It will be of significant interest to determine whether such post-translational changes are relevant to the metabolic derangements that occur during the early stages of heart failure.
Supplementary Material
Acknowledgments
We are grateful to Lorenzo Thomas for assistance with manuscript preparation; Gregory Aubert for critical scientific discussion; Samuel Lee for expert technical assistance with the wheel-running experiments; Jian-Liang Li and Feng Qi from the Applied Bioinformatics Core at Sanford-Burnham Medical Research Institute at Lake Nona (SBMRI-LN) for helpful discussion; Metabolomics Core at SBMRI-LN; Carla Weinheimer and Attila Kovacs (Washington University School of Medicine) for guidance related to the mouse surgical model and echocardiographic analyses; and Orlando Rodriguez and Lauren Ashley Gabriel for assistance with animal studies.
Sources of Funding
This work was supported by NIH grants R01 HL58493 (D.P.K.) and R01 HL101189 (D.P.K., A.D.A., and D.M.M.).
Footnotes
Disclosures
None.
References
- 1.Bing RJ. The metabolism of the heart. Harvey Lect. 1954;50:27–70. [PubMed] [Google Scholar]
- 2.Bishop SP, Altschuld RA. Increased glycolytic metabolism in cardiac hypertrophy and congestive failure. Am J Physiol. 1970;218:153–159. doi: 10.1152/ajplegacy.1970.218.1.153. [DOI] [PubMed] [Google Scholar]
- 3.Allard MF, Schonekess BO, Henning SL, English DR, Lopaschuk GD. Contribution of oxidative metabolism and glycolysis to ATP production in hypertrophied hearts. Am J Physiol. 1994;267:H742–750. doi: 10.1152/ajpheart.1994.267.2.H742. [DOI] [PubMed] [Google Scholar]
- 4.Christe ME, Rodgers RL. Altered glucose and fatty acid oxidation in hearts of the spontaneously hypertensive rat. J Mol Cell Cardiol. 1994;26:1371–1375. doi: 10.1006/jmcc.1994.1155. [DOI] [PubMed] [Google Scholar]
- 5.Taegtmeyer H, Golfman L, Sharma S, Razeghi P, van Arsdall M. Linking gene expression to function: metabolic flexibility in the normal and diseased heart. Ann N Y Acad Sci. 2004;1015:202–213. doi: 10.1196/annals.1302.017. [DOI] [PubMed] [Google Scholar]
- 6.Huss JM, Kelly DP. Mitochondrial energy metabolism in heart failure: a question of balance. J Clin Invest. 2005;115:547–555. doi: 10.1172/JCI200524405. [DOI] [PMC free article] [PubMed] [Google Scholar]
- 7.Stanley WC, Recchia FA, Lopaschuk GD. Myocardial substrate metabolism in the normal and failing heart. Physiol Rev. 2005;85:1093–1129. doi: 10.1152/physrev.00006.2004. [DOI] [PubMed] [Google Scholar]
- 8.Lopaschuk GD, Ussher JR, Folmes CD, Jaswal JS, Stanley WC. Myocardial fatty acid metabolism in health and disease. Physiol Rev. 2010;90:207–258. doi: 10.1152/physrev.00015.2009. [DOI] [PubMed] [Google Scholar]
- 9.Ingwall JS, Atkinson DE, Clarke K, Fetters JK. Energetic correlates of cardiac failure: changes in the creatine kinase system in the failing myocardium. Eur Heart J. 1990;11(Suppl B):108–115. doi: 10.1093/eurheartj/11.suppl_b.108. [DOI] [PubMed] [Google Scholar]
- 10.Tian R, Nascimben L, Kaddurah-Daouk R, Ingwall JS. Depletion of energy reserve via the creatine kinase reaction during the evolution of heart failure in cardiomyopathic hamsters. J Mol Cell Card. 1996;28:755–765. doi: 10.1006/jmcc.1996.0070. [DOI] [PubMed] [Google Scholar]
- 11.Neubauer S, Horn M, Cramer M, Harre K, Newell JB, Peters W, Pabst T, Ertl G, Hahn D, Ingwall JS, Kochsiek K. Myocardial phosphocreatine-to-ATP ratio is a predictor of mortality in patients with dilated cardiomyopathy. Circulation. 1997;96:2190–2196. doi: 10.1161/01.cir.96.7.2190. [DOI] [PubMed] [Google Scholar]
- 12.Weiss RG, Gerstenblith G, Bottomley PA. ATP flux through creatine kinase in the normal, stressed, and failing human heart. Proc Natl Acad Sci USA. 2005;102:808–813. doi: 10.1073/pnas.0408962102. [DOI] [PMC free article] [PubMed] [Google Scholar]
- 13.Ingwall JS. On the hypothesis that the failing heart is energy starved: lessons learned from the metabolism of ATP and creatine. Curr Hypertens Rep. 2006;8:457–464. doi: 10.1007/s11906-006-0023-x. [DOI] [PubMed] [Google Scholar]
- 14.Kelly DP, Strauss AW. Inherited cardiomyopathies. N Engl J Med. 1994;330:913–919. doi: 10.1056/NEJM199403313301308. [DOI] [PubMed] [Google Scholar]
- 15.Bennett MJ, Rinaldo P, Strauss AW. Inborn errors of mitochondrial fatty acid oxidation. Crit Rev Clin Lab Sci. 2000;37:1–44. doi: 10.1080/10408360091174169. [DOI] [PubMed] [Google Scholar]
- 16.Wallace DC. Mitochondrial defects in cardiomyopathy and neuromuscular disease. Am Heart J. 2000;139:S70–85. doi: 10.1067/mhj.2000.103934. [DOI] [PubMed] [Google Scholar]
- 17.Huss JM, Imahashi K, Dufour CR, Weinheimer CJ, Courtois M, Kovacs A, Giguere V, Murphy E, Kelly DP. The nuclear receptor ERRalpha is required for the bioenergetic and functional adaptation to cardiac pressure overload. Cell Metab. 2007;6:25–37. doi: 10.1016/j.cmet.2007.06.005. [DOI] [PubMed] [Google Scholar]
- 18.Sack MN, Rader TA, Park S, Bastin J, McCune SA, Kelly DP. Fatty acid oxidation enzyme gene expression is downregulated in the failing heart. Circulation. 1996;94:2837–2842. doi: 10.1161/01.cir.94.11.2837. [DOI] [PubMed] [Google Scholar]
- 19.Sack MN, Disch DL, Rockman HA, Kelly DP. A role for Sp and nuclear receptor transcription factors in a cardiac hypertrophic growth program. Proc Natl Acad Sci USA. 1997;94:6438–6443. doi: 10.1073/pnas.94.12.6438. [DOI] [PMC free article] [PubMed] [Google Scholar]
- 20.Barger PM, Brandt JM, Leone TC, Weinheimer CJ, Kelly DP. Deactivation of peroxisome proliferator-activated receptor-alpha during cardiac hypertrophic growth. J Clin Invest. 2000;105:1723–1730. doi: 10.1172/JCI9056. [DOI] [PMC free article] [PubMed] [Google Scholar]
- 21.Kanda H, Nohara R, Hasegawa K, Kishimoto C, Sasayama S. A nuclear complex containing PPARalpha/RXRalpha is markedly downregulated in the hypertrophied rat left ventricular myocardium with normal systolic function. Heart Vessels. 2000;15:191–196. doi: 10.1007/s003800070022. [DOI] [PubMed] [Google Scholar]
- 22.Sihag S, Cresci S, Li AY, Sucharov CC, Lehman JJ. PGC-1alpha and ERRalpha target gene downregulation is a signature of the failing human heart. J Mol Cell Card. 2009;46:201–212. doi: 10.1016/j.yjmcc.2008.10.025. [DOI] [PMC free article] [PubMed] [Google Scholar]
- 23.Gao Z, Xu H, DiSilvestre D, Halperin VL, Tunin R, Tian Y, Yu W, Winslow RL, Tomaselli GF. Transcriptomic profiling of the canine tachycardia-induced heart failure model: global comparison to human and murine heart failure. J Mol Cell Cardiol. 2006;40:76–86. doi: 10.1016/j.yjmcc.2005.08.002. [DOI] [PMC free article] [PubMed] [Google Scholar]
- 24.Bugger H, Schwarzer M, Chen D, Schrepper A, Amorim PA, Schoepe M, Nguyen TD, Mohr FW, Khalimonchuk O, Weimer BC, Doenst T. Proteomic remodelling of mitochondrial oxidative pathways in pressure overload-induced heart failure. Cardiovasc Res. 2010;85:376–384. doi: 10.1093/cvr/cvp344. [DOI] [PubMed] [Google Scholar]
- 25.Barth AS, Kumordzie A, Frangakis C, Margulies KB, Cappola TP, Tomaselli GF. Reciprocal transcriptional regulation of metabolic and signaling pathways correlates with disease severity in heart failure. Circ Cardiovasc Genet. 2011;4:475–483. doi: 10.1161/CIRCGENETICS.110.957571. [DOI] [PMC free article] [PubMed] [Google Scholar]
- 26.Xu J, Nie HG, Zhang XD, Tian Y, Yu B. Down-regulated energy metabolism genes associated with mitochondria oxidative phosphorylation and fatty acid metabolism in viral cardiomyopathy mouse heart. Mol Biol Rep. 2011;38:4007–4013. doi: 10.1007/s11033-010-0519-y. [DOI] [PubMed] [Google Scholar]
- 27.Allen DL, Harrison BC, Maass A, Bell ML, Byrnes WC, Leinwand LA. Cardiac and skeletal muscle adaptations to voluntary wheel running in the mouse. J Appl Physiol. 2001;90:1900–1908. doi: 10.1152/jappl.2001.90.5.1900. [DOI] [PubMed] [Google Scholar]
- 28.Martin OJ, Lai L, Soundarapandian MM, Leone TC, Zorzano A, Keller MP, Attie AD, Muoio DM, Kelly DP. A role for peroxisome proliferator-activated receptor gamma coactivator-1 in the control of mitochondrial dynamics during postnatal cardiac growth. Circ Res. 2014;114:626–636. doi: 10.1161/CIRCRESAHA.114.302562. [DOI] [PMC free article] [PubMed] [Google Scholar]
- 29.Lin J, Handschin C, Spiegelman BM. Metabolic control through the PGC-1 family of transcription coactivators. Cell Metab. 2005;1:361–370. doi: 10.1016/j.cmet.2005.05.004. [DOI] [PubMed] [Google Scholar]
- 30.Finck BN, Kelly DP. PGC-1 coactivators: inducible regulators of energy metabolism in health and disease. J Clin Invest. 2006;116:615–622. doi: 10.1172/JCI27794. [DOI] [PMC free article] [PubMed] [Google Scholar]
- 31.Handschin C, Spiegelman BM. Peroxisome proliferator-activated receptor gamma coactivator 1 coactivators, energy homeostasis, and metabolism. Endocr Rev. 2006;27:728–735. doi: 10.1210/er.2006-0037. [DOI] [PubMed] [Google Scholar]
- 32.Scarpulla RC, Vega RB, Kelly DP. Transcriptional integration of mitochondrial biogenesis. Trends Endocrinol Metab. 2012;23:459–466. doi: 10.1016/j.tem.2012.06.006. [DOI] [PMC free article] [PubMed] [Google Scholar]
- 33.Sansbury BE, De Martino AM, Xie Z, Brooks AC, Brainard RE, Watson LJ, Defilippis AP, Cummins TD, Harbeson MA, Brittian KR, Prabhu SD, Bhatnagar A, Jones SP, Hill BG. Metabolomic analysis of pressure-overloaded and infarcted mouse hearts. Circ Heart Fail. 2014;7:634–642. doi: 10.1161/CIRCHEARTFAILURE.114.001151. [DOI] [PMC free article] [PubMed] [Google Scholar]
- 34.Galindo CL, Skinner MA, Errami M, Olson LD, Watson DA, Li J, McCormick JF, McIver LJ, Kumar NM, Pham TQ, Garner HR. Transcriptional profile of isoproterenol-induced cardiomyopathy and comparison to exercise-induced cardiac hypertrophy and human cardiac failure. BMC Physiol. 2009;9:23. doi: 10.1186/1472-6793-9-23. [DOI] [PMC free article] [PubMed] [Google Scholar]
- 35.Iemitsu M, Maeda S, Miyauchi T, Matsuda M, Tanaka H. Gene expression profiling of exercise-induced cardiac hypertrophy in rats. Acta Physiol Scand. 2005;185:259–270. doi: 10.1111/j.1365-201X.2005.01494.x. [DOI] [PubMed] [Google Scholar]
- 36.Strom CC, Aplin M, Ploug T, Christoffersen TE, Langfort J, Viese M, Galbo H, Haunso S, Sheikh SP. Expression profiling reveals differences in metabolic gene expression between exercise-induced cardiac effects and maladaptive cardiac hypertrophy. FEBS J. 2005;272:2684–2695. doi: 10.1111/j.1742-4658.2005.04684.x. [DOI] [PubMed] [Google Scholar]
- 37.Diffee GM, Seversen EA, Stein TD, Johnson JA. Microarray expression analysis of effects of exercise training: increase in atrial MLC-1 in rat ventricles. Am J Physiol Heart Circ Physiol. 2003;284:H830–837. doi: 10.1152/ajpheart.00761.2002. [DOI] [PubMed] [Google Scholar]
- 38.Budiono BP, See Hoe LE, Peart JN, Sabapathy S, Ashton KJ, Haseler LJ, Headrick JP. Voluntary running in mice beneficially modulates myocardial ischemic tolerance, signaling kinases, and gene expression patterns. Am J Physiol Regul Integr Comp Physiol. 2012;302:R1091–1100. doi: 10.1152/ajpregu.00406.2011. [DOI] [PubMed] [Google Scholar]
- 39.Hirschey MD, Shimazu T, Huang JY, Verdin E. Acetylation of mitochondrial proteins. Methods Enzymol. 2009;457:137–147. doi: 10.1016/S0076-6879(09)05008-3. [DOI] [PubMed] [Google Scholar]
- 40.Cai L, Tu BP. On acetyl-CoA as a gauge of cellular metabolic state. Cold Spring Harb Symp Quant Biol. 2011;76:195–202. doi: 10.1101/sqb.2011.76.010769. [DOI] [PubMed] [Google Scholar]
- 41.Newman JC, He W, Verdin E. Mitochondrial protein acylation and intermediary metabolism: regulation by sirtuins and implications for metabolic disease. J Biol Chem. 2012;287:42436–42443. doi: 10.1074/jbc.R112.404863. [DOI] [PMC free article] [PubMed] [Google Scholar]
- 42.Karamanlidis G, Lee CF, Garcia-Menendez L, Kolwicz SC, Jr, Suthammarak W, Gong G, Sedensky MM, Morgan PG, Wang W, Tian R. Mitochondrial complex I deficiency increases protein acetylation and accelerates heart failure. Cell Metab. 2013;18:239–250. doi: 10.1016/j.cmet.2013.07.002. [DOI] [PMC free article] [PubMed] [Google Scholar]
- 43.Mills E, O’Neill LA. Succinate: a metabolic signal in inflammation. Trends Cell Biol. 2014;24:313–320. doi: 10.1016/j.tcb.2013.11.008. [DOI] [PubMed] [Google Scholar]
- 44.Rardin MJ, He W, Nishida Y, Newman JC, Carrico C, Danielson SR, Guo A, Gut P, Sahu AK, Li B, Uppala R, Fitch M, Riiff T, Zhu L, Zhou J, Mulhern D, Stevens RD, Ilkayeva OR, Newgard CB, Jacobson MP, Hellerstein M, Goetzman ES, Gibson BW, Verdin E. SIRT5 regulates the mitochondrial lysine succinylome and metabolic networks. Cell Metab. 2013;18:920–933. doi: 10.1016/j.cmet.2013.11.013. [DOI] [PMC free article] [PubMed] [Google Scholar]
- 45.Park J, Chen Y, Tishkoff DX, Peng C, Tan M, Dai L, Xie Z, Zhang Y, Zwaans BM, Skinner ME, Lombard DB, Zhao Y. SIRT5-mediated lysine desuccinylation impacts diverse metabolic pathways. Mol Cell. 2013;50:919–930. doi: 10.1016/j.molcel.2013.06.001. [DOI] [PMC free article] [PubMed] [Google Scholar]
Associated Data
This section collects any data citations, data availability statements, or supplementary materials included in this article.