

Abstract
Understanding the etiology of patterns of variation within and covariation across brain regions is key to advancing our understanding of the functional, anatomical and developmental networks of the brain. Here we applied multivariate twin modeling and principal component analysis (PCA) to investigate the genetic architecture of the size of seven subcortical regions (caudate nucleus, thalamus, putamen, pallidum, hippocampus, amygdala and nucleus accumbens) in a genetically informative sample of adolescents and young adults (N=1,038; mean age=21.6 ± 3.2 years; including 148 monozygotic and 202 dizygotic twin pairs) from the Queensland Twin IMaging (QTIM) Study. Our multivariate twin modeling identified a common genetic factor that accounts for all the heritability of intracranial volume (0.88) and a substantial proportion of the heritability of all subcortical structures, particularly those of the thalamus (0.71 out of 0.88), pallidum (0.52 out of 0.75) and putamen (0.43 out of 0.89). In addition, we also found substantial region-specific genetic contributions to the heritability of the hippocampus (0.39 out of 0.79), caudate nucleus (0.46 out of 0.78), amygdala (0.25 out of 0.45) and nucleus accumbens (0.28 out of 0.52). This provides further insight into the extent and organization of multiple genetic factors, which include developmental and general growth pathways, as well as functional specialization and maturation trajectories that influence each subcortical region.
Keywords: Subcortical Volumes, Twin Study, Covariation, Structural MRI, Heritability, Multivariate
INTRODUCTION
Previous studies in both developing children (Supekar et al., 2009) and healthy aging adults (Raz et al., 2004, Raz et al., 1997, Raz et al., 2005) have shown covariation across different brain regions at the phenotypic level. For certain regions, these patterns of covariation remain significant even after accounting for the effects of factors such as age and overall brain size (Allen et al., 2002, Colibazzi et al., 2008, Kennedy et al., 1998, Mechelli et al., 2005). Thus, it is suggested that further research into the etiology of volumetric covariance may provide insights into the anatomical and functional networks of the brain in both health and disease (Colibazzi et al., 2008).
Subcortical brain structures of the basal ganglia and limbic system co-vary in size and this covariation may reflect developmental and/or functional relationships amongst inter-connected regions (Eyler et al., 2011). In addition, each subcortical region performs highly specialized functions. For instance, the hippocampus, amygdala and caudate nucleus are involved in memory formation, emotional processing and motor coordination, respectively (Bird & Burgess, 2008, Feinstein et al., 2011, Grahn et al., 2009). Also, each region follows a characteristic maturation trajectory across the lifespan according to its function (Eyler et al., 2011, Raznahan et al., 2014, Walhovd et al., 2014). Therefore, correlation patterns among subcortical regions could result from both developmental similarities and/or functional associations.
Several studies have shown that genetic factors account for 50–80% of variance in subcortical structures (Den Braber et al., 2013, Kremen et al., 2010, Wallace et al., 2006). A recent study of middle-age male twins (Eyler et al., 2011) used hierarchical clustering and PCA to show that patterns of covariation among subcortical regions are partly due to common genes. Four correlated factors were identified. However, it is not known whether these genetic patterns are established earlier in life and/or are the product of regional losses due to mechanisms involved in aging (Eyler et al., 2011), nor whether the patterns are similar in males and females. Similarly, the extent of common vs. region-specific genetic influences for each subcortical region has not been quantified, and may be useful for ongoing neuroimaging genetic efforts (Thompson et al., 2014).
Here we explore the genetic architecture of subcortical brain volumes in a large sample of young adult twins, including both males and females. We used multivariate genetic modeling to investigate genetic and environmental sources of covariation across seven subcortical structures (thalamus, putamen, caudate nucleus, hippocampus, pallidum, amygdala and nucleus accumbens), and quantified the degree of region-specific vs. common genetic contributions across regions. We predicted that young adults would show a similar genetic architecture to that found in middle aged adults (Eyler et al., 2011). This would in turn support the hypothesis of earlier developmental factors contributing to the association/relationship among subcortical regions.
MATERIALS & METHODS
Participants
Participants included 1038 twins and siblings from the Queensland Twin IMaging (QTIM) (De Zubicaray et al., 2008) project. This is an ongoing study examining healthy young adult twins with structural and functional magnetic-resonance imaging (MRI) and high-resolution diffusion tensor imaging (DTI) (Blokland et al., 2011, Braskie et al., 2011, Chiang et al., 2009, Jahanshad et al., 2010). While the descriptive analyses were conducted on the entire sample (N=1,038), the genetic analyses focused only on available data from 350 complete twin pairs (n=700): 100 monozygotic (MZ) female, 48 MZ male, 81 dizygotic (DZ) female, 39 DZ male and 82 opposite-sex pairs (mean age=21.6 ± 3.19 years; range=16–29). All participants were screened (by self-report) for their suitability for imaging, as well as any significant medical, psychiatric, or neurological conditions (including head injuries), current or past diagnosis of substance abuse, and for current use of psychoactive medication. Twins were approached to participate in QTIM only if they were Caucasian and right-handed for throwing and writing as assessed by the Annett’s Handedness Questionnaire (Annett, 1970), in order to achieve homogeneity in the imaging sample. Zygosity of same-sex twins was established by DNA typing of 9 markers (AmpF1STR Profiler Plus Amplification KIT, Applied Biosystems Inc.) and later confirmed for >80% of the sample who were genotyped on the Illumina 610K SNP array. 75 percent of twin pairs were scanned together on the same day, with the remainder, on average, within 12 days of each other. In addition, 80 participants (13 MZ and 14 DZ pairs, and 26 single twins) were rescanned (mean time between scans = 120 days ± 55 SD) after their initial scan to assess test-retest reliability of the protocol. Informed consent was obtained from each participant and parent or guardian for participants under 18 years of age. The study was approved by the Human Research Ethics Committees of the Queensland Institute of Medical Research, the University of Queensland, and Uniting Health Care, Wesley Hospital.
MRI Acquisition and Processing
We acquired T1-weighted whole-brain scans with an inversion recovery rapid gradient echo sequence on a 4 Tesla MRI scanner (Bruker Medspec; with acquisition parameters: TI/TR/TE=700/1500/3.35 ms; flip angle=8°; slice thickness=0.9 mm; matrix=256×256×256).
Images were analysed using FIRST (FSL v4.1.9), an automated processing pipeline which performs segmentation and registration of subcortical structures. Input images were registered to the Montreal Neuroscience Institute (MNI) space through two-stage affine transformation. Shape models were then used to segment subcortical structures, with a boundary correction program determining if neighboring voxels belong to the structure or not. Slight modifications as per the Enhancing Neuro-Imaging Genetics through Meta-Analysis (ENIGMA) consortium’s imaging protocol (http://enigma.loni.ucla.edu/wp-content/uploads/2012/03/ENIGMA_FSL_FIRST_Protocol.doc) were made to improve the MNI space transformation. 14 subcortical regions of interest (ROI) were extracted, including bi-lateral measures of the thalamus, caudate nucleus, putamen, pallidum, hippocampus, amygdala, and nucleus accumbens. Quality of delineation was assessed following the ENIGMA protocol for subcortical structures (http://enigma.loni.ucla.edu/protocols/imaging-protocols/quality-checking-subcortical-structures), which resulted in the exclusion of 1.25% of volumes. Intracranial volume (ICV) was calculated as the inverse of the determinant of the affine transformation matrix, multiplied by the size of the MNI template.
In addition, we also used the software package FreeSurfer (FS) (v5.1, http://surfer.nmr.mgh.harvard.edu/) to extract the sub-cortical volumes in a subset of 80 participants that had been scanned twice. As discussed by Fischl et al. (Fischl et al., 2002), images are skull stripped, transformed to Talairach space and a probabilistic atlas is used to assign each voxel a neuroanatomical label. FreeSurfer also provides a measure of ICV. Quality control following the ENIGMA consortium guidelines was conducted and resulted in the exclusion of 1.83% of Freesurfer observations.
Subcortical Volumes
Using the 80 participants that were scanned twice, we first compared the sub-cortical volumes extracted using both software packages – FSL-FIRST and FS – and assessed their test-retest reliability through Pearson correlations. Our choice of test-retest correlation over other methods such as intra-class correlation was because, being a structural measure, we did not expect any considerable change in true scores, as it is common in, for example, functional MRI or cognitive test/tasks, due to learning or carry-over effects. Mean volume estimates tended to be higher when extracted with FS compared with FSL-FIRST. However this trend was only significant for the amygdalae (FS: left=1863, right=1954 mm3; vs. FSL: left=856, right=806 mm3) and right nucleus accumbens (FS: 834, FSL: 429 mm3). Because the amygdala and nucleus accumbens are the smallest of the subcortical structures, variability as a proportion of size is expected to be higher and likely to be exacerbated through different processing methods. In addition, the borders defining both structures are difficult to delineate, and likely to differ between automated pipelines due to the use of different reference atlases. Increased variability between automated measures has been previously reported for the nucleus accumbens (Hanson et al., 2012) and amygdala (Dewey et al., 2010, Hanson et al., 2012, Morey et al., 2009). As the test-retest reliabilities in the current sample were overall higher for FSL volumes compared with FS, including the nucleus accumbens and amygdala, a decision was made to process the entire sample (N=1,038) with FSL. No significant differences in the skewness of the distributions were observed, regardless of segmentation method used.
Data Analysis
Quality Control
Following segmentation of the full sample (N=1,038 × 14 subcortical regions and ICV), we excluded 0.61% of volumes (2 L-pallidum, 5 R-pallidum, 7 L-thalamus, 3 R-thalamus, 5 L-putamen, 6 R-putamen, 3 L-caudate, 9 R-caudate, 11 L-hippocampus, 6 R-hippocampus, 7 L-accumbens, 6 R-accumbens, 10 L-amygdala, 8 R-amygdala) due to poor structure delineation. All variables were normally distributed. 10 individual observations (2 L-thalamus, 1 R-thalamus, 2 R-caudate, 1 R-putamen and 4 R-pallidum) were deemed as outliers (>3.8 SD from the mean) and winsorized.
Twin analyses
We performed standard quantitative analyses to estimate common and region-specific genetic and environmental influences on individual differences in overall and regional subcortical brain volumes (Plomin et al., 2013). The classical twin design compares similarity in a given trait among pairs of identical (MZ) and fraternal (DZ) twins. While MZ twins share 100% of their genes, DZ twins share an average of 50% of their genes. In a standard ACE model, phenotypic variance in a trait can be disagreggated into three components: additive genetic (A), common environment (C) and unique environment (E). Multiple correlated variables can be analysed and the covariance partitioned into its genetic and environmental components through multivariate twin modeling. A usual starting point in multivariate twin analysis is the Cholesky decomposition, which is a method of triangular decomposition where the first variable (y1) is assumed to be caused by a latent factor that can explain the variance in the remaining variables (y2,…,yn). The second variable (y2) is assumed to be caused by a second latent factor (n2) that can explain variance in the second as well as remaining variables (y2,…,yn). This pattern continues until the final observed variable (yn) is explained by a latent variable (nn) For further information, see (Gillespie & Martin, 2005). However, the Cholesky does not distinguish between common factor and specific factor variance and does not estimate a specific factor effect for any variable except the last. Alternate methods such as the common and independent pathway models can be used to estimate common and specific factor variance (Gillespie & Martin, 2005). Finally, two models can be compared using a likelihood ratio chi-squared statistic.
Covariates and Homotopic correlations
We examined covariate effects (sex, age, age2, sex*age, sex*age2 and ICV) in the whole dataset (N=1,038) using Mx (Neale et al., 2003), which allows adjustment for relatedness among individuals. Out of all the covariates, only sex showed a significant effect. Thus, we carefully controlled for sex effects in all our subsequent analyses. Age effects were non-significant after adjustments for sex.
Phenotypic and genetic correlations across pairs of homotopic regions (mirror structures located in opposite hemispheres; e.g., left- and right- thalamus) were estimated. Moderate to high phenotypic correlations (0.38–0.89), and even higher genetic correlations (0.60–0.93) were observed, suggesting that volumetric variation of mirror structures located in both hemispheres is explained largely by the same genetic factors (Table 1). Therefore, and to avoid redundancy, we performed our genetic analyses on mean bilateral subcortical volumes, all of which showed good reliability (0.66 to 0.90), as shown in Table 1.
Table 1.
Homotopic correlations, test-retest correlations, descriptive statistics, covariate effects and twin correlations for subcortical volumes.
| ICV | Thalamus | Putamen | Caudate | Hippocampus | Pallidum | Amygdala | Accumbens | |
|---|---|---|---|---|---|---|---|---|
| Descriptives (N=1024–1038) | ||||||||
| Mean (mm3) | 1298345 | 7520 | 5005 | 3688 | 3566 | 1656 | 807 | 452 |
| SD (mm3) | 143176 | 723 | 544 | 427 | 363 | 177 | 196 | 114 |
| Range (mm3) | (908943, 1725507) | (5495, 9827) | (3368, 6586) | (2456, 4969) | (2615, 4730) | (1150, 2178) | (293, 1495) | (115, 800) |
|
| ||||||||
| Covariate effects (N=1024–1038) | ||||||||
| % Males > Females | 14% | 11% | 13% | 9% | 9% | 13% | 12% | 14% |
| Std. β value (Sex) | 0.57* | 0.55* | 0.56* | 0.37* | 0.40* | 0.57* | 0.26* | 0.25* |
| Std. β value (Sex) - adjusted for ICV | ----- | 0.11* | 0.24* | 0.03 | 0.05 | 0.20* | 0.03 | 0.03 |
| Std. β value (ICV) - Males | ----- | 0.70* | 0.50* | 0.47* | 0.49* | 0.61* | 0.33* | 0.35* |
| Std. β value (ICV) - Females | ----- | 0.78* | 0.48* | 0.52* | 0.59* | 0.66* | 0.29* | 0.32* |
|
| ||||||||
| Twin correlations | ||||||||
| MZ (n=137–145 pairs) | .88 (.84, .91) | .65 (.55, .73) | .83 (.77, .88) | .70 (.61, .77) | .73 (.65, .80) | .83 (.77, .87) | .42 (.28, .55) | .47 (.33, .59) |
| DZ (n=183–197 pairs) | .35 (.23, .47) | .35 (.22, .47) | .43 (.31, .53) | .44 (.32, .54) | .41 (.29, .52) | .42 (.29, .52) | .23 (.09, .36) | .22 (.08, .35) |
| MZ females (n=93–98 pairs) | .83 (.76, .88) | .67 (.55, .77) | .86 (.76, .92) | .77 (.68, .84) | .81 (.72, .87) | .83 (.75, .88) | .46 (.14, .69) | .56 (.41, 68) |
| MZ males (n=44–47 pairs) | .78 (.64, .86) | .61 (.40, .76) | .82 (.74, .87) | .56 (.33, .72) | .58 (.35, .74) | .84 (.74, .91) | .45 (.19, .65) | .39 (.09, .62) |
| DZ females (n=76–79 pairs) | .48 (.29,.63) | .23 (.02, .43) | .47 (.28, .62) | .57 (.40, .70) | .45 (.26, .61) | .41 (.21, .57) | .31 (.13, .46) | .28 (.01, .52) |
| DZ males (n=33–38 pairs) | .36 (.08, .59) | .47 (.18, .69) | .38 (.07, .62) | .33 (.02, .58) | .46 (.18, .67) | .30 (.01, .55) | .15 (.−07, .36) | .15 (−.07, .36) |
| DZ opposite sex (n=74–80 pairs) | .60 (.44, .71) | .39 (.19, .56) | .41 (.21, .58) | .41 (.21, .58) | .35 (.14, .52) | .43 (.25, .58) | .19 (−.03, .40) | .18 (−.06, .39) |
|
| ||||||||
| Test-retest Pearson correlation (r) (FSL-FIRST and FS), cross-method correlations (r and intra-class) correlations | ||||||||
| Test-retest r (N=72–80) | FSL: 0.98 | FSL: 0.90 | FSL: 0.88 | FSL: 0.87 | FSL: 0.67 | FSL: 0.77 | FSL: 0.66 | FSL: 0.77 |
| FS: 0.77 | FS: 0.70 | FS: 0.77 | FS: 0.87 | FS: 0.75 | FS: 0.72 | FS: 0.52 | FS: 0.51 | |
| Cross-method r (95% CI) | ----- | .56 (.44, .67) | .76 (.67, .82) | .70 (.61, .78) | .44 (.29, .56) | .45 (.31, .57) | .28 (.13, .43) | .20 (.12, .42) |
| Cross-method ICC (95% CI) | ----- | .72 (.60, .80) | .85 (.79, .89) | .82 (.75, .87) | .60 (.45, .72) | .61 (.46, .72) | .34 (.08, .53) | .34 (.08, .52) |
| L-R correlation (FSL) Phenotypic | ----- | 0.89* | 0.83* | 0.82* | 0.58* | 0.75* | 0.38* | 0.50* |
| L-R correlation (FSL) Genetic | ----- | 0.84* | 0.86* | 0.90* | 0.67* | 0.93* | 0.74* | 0.60* |
=Correlation is significant; All variables displayed normal distributions and means for all structures except for the two amygdalae were within the consensus volume estimates determined by manual segmentation in prior studies. Sample size (N) ranges reflect data missingness.
Phenotypic and genetic correlations and twin correlations across subcortical regions
We first assessed homogeneity of sampling for all variables by testing whether a reduction in fit of the model resulted by equating means and variances across birth order and zygosity groups. Mean homotopic volumes and ICV were adjusted for sex effects and residualised before estimation of pair-wise correlations. Maximum-likelihood genetic correlations and twin correlations for both five (MZ females, MZ males, DZ females, DZ males, DZ opposite sex) and two (MZ and DZ) zygosity groups were calculated using Mx (Neale et al., 2003).
Multivariate twin modeling
We examined covariation across ICV and the seven subcortical volumes in the subset comprising full twin pairs (n=700) using multivariate twin modelling with Mx (Neale et al., 2003), under a two zigosity (MZ/DZ) model. All variables were adjusted for sex effects. We started with a full Cholesky decomposition model, and then tested the fit of independent and common pathway models (Neale & Cardon, 1992a). Then, the fit of different submodels with a constrained number of genetic and environmental factors were compared against the fit of the full Cholesky model to determine the minimum number of factors that can explain the genetic relationships between intracranial and subcortical volumes. A standard indicator of better fit is the Akaike information criterion (AIC), with the best fitting model having the lowest AIC.
Principal Component Analysis
Similar to the approach used by (Eyler et al., 2011), we conducted a PCA on both phenotypic and genetic correlation matrices using the promax (oblique) rotation option in the psych package (Revelle, 2013) for R, in which factors are allowed to correlate. Based on a scree plot, the number of factors chosen was four. Altogether, a cumulative variance of over eighty percent was explained by four components, and no considerable gain in explained variance was observed when adding more components.
RESULTS
Preliminary Analyses
To assess (FS vs. FSL-FIRST) cross-method reliability, we calculated both Pearson correlations and intra-class correlations (ICC) between the mean bilateral volume estimates obtained with FSL and Freesurfer (given in Table 1) in our test-retest subsample. We observed agreement between both methods in that correlations for both amygdala and nucleus accumbens were lower than those for other subcortical regions. The issue of low reliability for semi-automated segmentation of these structures has been raised previously (Nugent et al., 2013).
Descriptive statistics (mean, standard deviation, range) and twin correlations for ICV and the seven mean subcortical volumes are provided in Table 1. On average, ICV was 14% larger for males than females, which is within the range reported by previous studies (Goldstein et al., 2001, Lenroot et al., 2007). Subcortical volumes were also larger in males compared to females (standardized regression β values ranging from 0.25 to 0.57, or 9–14%), but after controlling for ICV, sex differences were low and only significant for the putamen (β=0.24), pallidum (β=0.20) and thalamus (β=0.11). In addition, ICV accounted for a similar amount of the variance in subcortical volumes for both males and females, with standardized regression β values ranging from 0.32 to 0.72 in males and 0.29 to 0.78 in females (Table 1).
We also explored possible age effects. Although we initially observed a small but significant decrease of subcortical volume with age, this was no longer significant after adjusting for sex, that is, the age effect was due to sample composition, resulting from having slightly more older female than male participants. Further, to eliminate any potential bias due to the relatedness of the sample, covariate effects were explored in a subset comprising one individual per family, finding no significant differences.
Model-fitting analyses revealed homogeneity of sampling with no evidence of birth order [Δχ2 ranged 0.88–3.46, df=1 (i.e. Δχ21)] or zygosity effects (Δχ21 =0.18–3.17) in means nor variances (birth order Δχ21 = 0.55–4.69, zygosity Δχ21 =0.12–3.45). Maximum-likelihood twin correlations for both two (MZ/DZ) and five (MZf/MZm/DZf/DZm/DZos) zygosity groups are given in Table 1. MZ correlations ranged from 0.42 (amygdala) to 0.88 (putamen), whereas DZ correlations ranged from 0.22 (nucleus accumbens) to 0.44 (caudate nucleus).
Phenotypic and genetic correlations are given in Table 2 (variables were adjusted for sex effects). At the phenotypic level, ICV displayed the highest correlation with the thalamus (0.76) and the lowest with the nucleus accumbens (0.34) and amygdala (0.30). At the genetic level a similar pattern was observed, with the thalamus (0.86) and amygdala (0.41) displaying the highest and lowest correlations with ICV respectively. The strongest pair-wise correlations at the phenotypic level were those of pallidum with putamen and thalamus (0.60), with the amygdala displaying the lowest phenotypic correlations with other structures (0.10–0.37). Genetic correlations were slightly higher than at the phenotypic level, but overall a similar pattern was observed, with the basal ganglia structures being strongly correlated. Parallel analyses using both left- and right- volumes instead of mean volumes (data not shown) confirmed similar patterns of correlations.
Table 2.
Phenotypic (lower-triangle) and genetic (upper-triangle) correlations (95% CI) across intracranial and mean subcortical volumes.
| ICV | Pallidum | Putamen | Thalamus | Hippocampus | Caudate | Accumbens | Amygdala | GENET. CORR. | |
|---|---|---|---|---|---|---|---|---|---|
|
|
|||||||||
| ICV | 1 | .80 (.77, .82) | .63 (.59, .67) | .86 (.84, .88) | .67 (.63, .70) | .60 (.56, .64) | .46 (.40, .51) | .41 (.35, .46) | ICV |
| Pallidum | .65 (.61, .69) | 1 | .76 (.73, .79) | .74 (.71, .77) | .65 (.61, .69) | .59 (.55, .63) | .58 (.53, .62) | .58 (.53, .62) | Pallidum |
| Putamen | .49 (.43, .53) | .60 (.55, .64) | 1 | .62 (.62, .89) | .49 (.44, .54) | .54 (.49, .58) | .48 (.43, .53) | .32 (.26, .37) | Putamen |
| Thalamus | .76 (.73, .78) | .60 (.55, .64) | .51 (.46, .55) | 1 | .63 (.59, .67) | .52 (.47, .57) | .48 (.43, .53) | .33 (.27, .39) | Thalamus |
| Hippocampus | .55 (.51, 59) | .46 (.47, .88) | .40 (.33, .45) | .52 (.46, .55) | 1 | .40 (.34, .45) | .46 (.40, .51) | .43 (.37, .48) | Hippocampus |
| Caudate | .48 (.45, .55) | .46 (.40, .51) | .44 (.39, .50) | .44 (.38, .49) | .34 (.28, .40) | 1 | .33 (.27, .39) | .13 (.06, .19) | Caudate |
| Accumbens | .34 (.28, .40) | .42 (.37, .48) | .34 (.28, .39) | .35 (.29, .40) | .30 (.25, .38) | .27 (.20, .33) | 1 | .27 (.20, .33) | Accumbens |
| Amygdala | .30 (.25, .37) | .37 (.31,42) | .19 (.13, .25) | .23 (.16, .28) | .28 (.21, .33) | .10 (.03, .16) | .20 (.13, .25) | 1 | Amygdala |
|
|
|||||||||
| PHENO. CORR. | ICV | Pallidum | Putamen | Thalamus | Hippocampus | Caudate | Accumbens | Amygdala | |
Multivariate genetic modelling
Model fitting statistics are given in Table 3. We found that common environmental (C) factors could be dropped from the fully-saturated ACE Cholesky (Δ-2LL=188.44; Δdf=36), whereas additive genetic (A) factors could not be dropped without loss of fit (Δ-2LL=27.78; Δdf=36). The loadings on the genetic factor structure (shown in Table 4) suggested two common factors and six region-specific genetic factors. One common factor influenced overall brain size as well as subcortical volumes (i.e., Factor A1 in column 1), while another comprised only the subcortical regions (i.e., Factor A2 in column 2). Also, region-specific genetic influences were evident for most variables (indicated by the moderately large estimates on the diagonal). An independent pathway model (Neale & Cardon, 1992b) allowing for two common genetic factors (i.e., both an ICV- and a subcortical- genetic factors) and specific genetic influences to each variable also provided a good fit to the data. In fact, both AE Cholesky and AE 2-factor independent pathway models provided a better fit (lower AIC) than the ACE Cholesky (Table 3). While the AE Cholesky (Table 4) provided the best fit, we also present the independent pathway model in Figure 1, as it facilitates the distinction between common cross-region and region-specific genetic factors (Loehlin, 1996).
Table 3.
Model fitting results.
| Model | −2 log Likehood | df | AIC |
|---|---|---|---|
| ACE Cholesky | 11328.53 | 5410 | 508.53 |
| AE Cholesky | 11356.31 | 5446 | 464.31 |
| CE Cholesky | 11516.97 | 5446 | 624.97 |
| AE 2-factor Independent pathway* | 11387.12 | 5460 | 467.12 |
=This model comprises two common and eight specific genetic factors and a full E cholesky matrix.
Best fitting model is shown in bold.
Table 4.
Cholesky AE decomposition matrices
| Standardized Additive Genetic (A) Path Estimates | ||||||||
|---|---|---|---|---|---|---|---|---|
| Factor A1 | Factor A2 | Factor A3 | Factor A4 | Factor A5 | Factor A6 | Factor A7 | Factor A8 | |
| ICV | 0.94 | |||||||
| Pallidum | 0.73 | 0.47 | ||||||
| Putamen | 0.64 | 0.42 | 0.54 | |||||
| Thalamus | 0.83 | 0.09 | 0.05 | 0.41 | ||||
| Hippocampus | 0.65 | 0.14 | −0.05 | 0.01 | 0.58 | |||
| Caudate | 0.58 | 0.14 | 0.13 | −0.12 | −0.01 | 0.62 | ||
| Nucleus Accumbens | 0.38 | 0.23 | 0.04 | 0.05 | 0.07 | −0.03 | 0.53 | |
| Amygdala | 0.36 | 0.34 | −0.12 | −0.08 | 0.08 | −0.12 | −0.06 | 0.43 |
| Standardized Unique Environmental (E) Path Estimates | ||||||||
|---|---|---|---|---|---|---|---|---|
| Factor E1 | Factor E2 | Factor E3 | Factor E4 | Factor E5 | Factor E6 | Factor E7 | Factor E8 | |
| ICV | 0.35 | |||||||
| Pallidum | 0.22 | 0.45 | ||||||
| Putamen | 0.09 | 0.09 | 0.33 | |||||
| Thalamus | 0.15 | 0.09 | 0.10 | 0.30 | ||||
| Hippocampus | 0.13 | 0.04 | 0.11 | 0.07 | 0.42 | |||
| Caudate | 0.15 | 0.09 | 0.09 | 0.12 | 0.04 | 0.42 | ||
| Nucleus Accumbens | 0.20 | 0.14 | 0.10 | 0.07 | 0.09 | 0.07 | 0.65 | |
| Amygdala | 0.21 | 0.01 | 0.03 | −0.02 | 0.00 | 0.02 | 0.05 | 0.68 |
Figure 1.

Parameter estimates for independent variable 2 factor model showing covariation between ICV and subcortical volumes. The model shows common (AC1, AC2) and region-specific (AS0–AS7) additive genetic sources. ICV-specific source (AS0) was set to zero for the model to be identified. Estimates are standardized such that when squared they indicate the percentage of variance accounted for (95% CI indicated in parenthesis). Environmental influences (not shown here) were modelled as Cholesky and are similar to those shown in Table 4.
Heritability estimates of subcortical volumes (Figure 1) were high for ICV (0.88) and most subcortical structures (0.75–0.89), with the only exceptions being the amygdala (0.42) and nucleus accumbens (0.49). The common genetic factor, AC1, explained 81% of the genetic variance in thalamic volume (i.e. 71 out of 88%), compared to only 29% for the amygdala and 31% for the nucleus accumbens. This factor also explained a large proportion of the genetic variance in volume of basal ganglia structures: pallidum 69%, putamen 48%, and caudate nucleus 44%. Common genetic factor AC2 showed moderate contributions to the heritability of the pallidum (29%), amygdala (24%), putamen (19%) and nucleus accumbens (12%), and only small contributions to hippocampus (3.84%), caudate (3.84%) and thalamus (1.13%) volumes. Notably, in this model, contributions of region-specific genetic factors (As) were sizeable, accounting for 32–57% of the heritability of caudate nucleus (52%), nucleus accumbens (57%), amygdala (47%), hippocampus (47%) and putamen (32%). Only 1.3% of the heritability in pallidum volume was due to a region-specific genetic factor. Environmental contributions to variance were largely region-specific across structures, with the small overlap across structures in the Factor E1 (Table 4), possibly due to correlated measurement error.
Subsequent modeling including only the volumes for the seven subcortical regions (after adjustment for ICV and sex effects) provided support for both a common subcortical genetic factor and considerable region-specific genetic factors for all structures but the pallidum (shown in Figure 2). The common factor (AC) explained more than half of the genetic variance in volume for the pallidum, putamen and thalamus, whereas region-specific genetic contributions (AS(1–7)) were larger for the caudate, nucleus accumbens and amygdala, and genetic contributions to hippocampal volume were equally split between common and specific factors.
Figure 2.
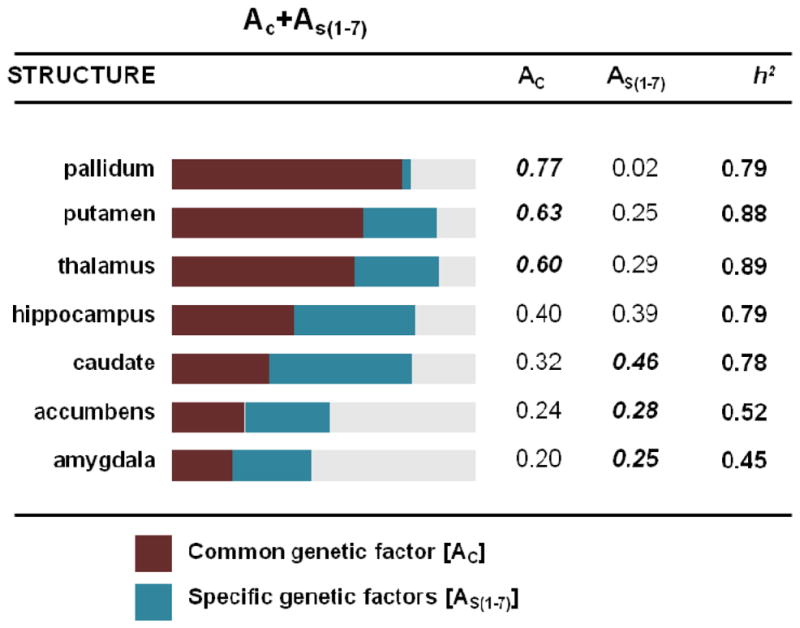
Common (AC) and region-specific (AS) contributions to heritability estimates (h2) of subcortical brain volumes (adjusted for ICV). The greater contributing genetic factor (either common or specific) is indicated in bold for each region.
Principal Component Analysis
PCA on the phenotypic correlation matrix identified 4 rotated factors, each with eigenvalues greater than one. Factors B and D resembled the previously reported factors (Eyler et al., 2011), with factor B grouping together the “basal ganglia” structures: putamen, caudate nucleus and pallidum, and factor D clustering apart the nucleus accumbens. The amygdala also formed a factor on its own (factor C), whereas factor A comprised ICV, hippocampus and thalamus. Together, factors A and B explained 56% of the total variance and were correlated with one another (0.67). Factors C and D also showed significant correlations with factors A and B, ranging from 0.34 to 0.43. A similar component composition resulted from using the genetic correlation matrix (data not shown). In addition, excluding ICV from the analysis and including it as a covariate resulted in a similar component composition, except that the loadings for the thalamus were split, with around two thirds loading with hippocampus and the remaining third with the basal ganglia structures (shown in Tables 5 and 6). This is in line with results reported by Eyler et al. (2011), in which thalamus volume loaded moderately in both factors. Additionally, the amygdala and nucleus accumbens loaded each on separate factors and all four factors remained strongly correlated.
Table 5.
PCA results based upon genetic correlation matrix
| PC1 | PC2 | PC3 | PC4 | |
|---|---|---|---|---|
| Pallidum | 0.51 | 0.14 | 0.35 | 0.15 |
| Putamen | 0.77 | −0.15 | 0.13 | 0.20 |
| Thalamus | 0.37 | 0.62 | −0.08 | 0.04 |
| Hippocampus | −0.13 | 1.02 | 0.03 | −0.01 |
| Caudate nucleus | 1.11 | −0.02 | −0.21 | −0.21 |
| Amygdala | −0.12 | 0.01 | −0.11 | 1.09 |
| Nucleus accumbens | −0.13 | 0.01 | 1.07 | −0.11 |
|
| ||||
| SS loadings | 2.16 | 1.50 | 1.26 | 1.20 |
| Cumulative Var | 0.31 | 0.52 | 0.70 | 0.88 |
Factor loadings greater than 0.35 are indicated in bold.
Table 6.
PCA results based upon phenotypic correlation matrix
| PC1 | PC2 | PC3 | PC4 | |
|---|---|---|---|---|
| Pallidum | 0.61 | 0.07 | 0.26 | 0.12 |
| Putamen | 0.79 | −0.01 | 0.02 | 0.05 |
| Thalamus | 0.39 | 0.55 | −0.05 | 0.02 |
| Hippocampus | −0.15 | 1.05 | −0.02 | −0.04 |
| Caudate nucleus | 1.02 | −0.16 | −0.15 | −0.12 |
| Amygdala | −0.05 | −0.03 | −0.05 | 1.04 |
| Nucleus accumbens | −0.07 | −0.03 | 1.03 | −0.05 |
|
| ||||
| SS loadings | 2.12 | 1.37 | 1.10 | 1.07 |
| Cumulative Var | 0.30 | 0.50 | 0.65 | 0.81 |
Factor loadings greater than 0.35 are indicated in bold.
DISCUSSION
Here we sought to identify patterns of genetic covariation among seven subcortical brain volumes using both genetic modeling and PCA. We used one of the largest MRI-phenotyped twin cohorts to date, comprising both male and female adolescents and young adults. Total heritability estimates were similar to those reported previously for older samples (Den Braber et al., 2013, Kremen et al., 2010). We show that the strong phenotypic covariation across subcortical volumes is largely explained by a common genetic factor. This factor also accounted for all of the genetic variance (h2=088) in global head size (ICV). In addition, region-specific genetic contributions explained ~50% or more of the heritability in four of the subcortical volumes. This provides the first quantification of common and region-specific genetic contributions to variance in subcortical volumes and confirms the genetic architecture suggested in prior work in older male twins (Eyler et al., 2011).
As shown in Figure 1, our multivariate independent pathway model suggests the existence of sets of genes with pleiotropic influences over the size of different brain regions. AC1 accounted for all of the genetic variance in overall head size, and explained between 29–81% of the heritability of individual regional volumes. This suggests the presence of an overall brain size genetic factor. Prior work shows that overall brain size and gray matter volume correlate with body height (Posthuma et al., 2003, Taki et al., 2012). This may be partially explained by the effects of general growth pathways such as those mediated by the insulin-like growth factor I and growth hormone, which are known to affect both height and the development of the nervous system (Rogers et al., 2006, Taki et al., 2012).
When ICV was included in the model as a covariate (Figure 2), a common subcortical genetic factor was evident across regions, which may reflect, at least in part, a brain specific developmental factor. During embryonic development, cortical and subcortical structures share a common origin in the prosencephalon (Gilbert, 2000, Volpe, 2008), which then divides into telencephalon and diencephalon. While the diencephalon is the precursor of the thalamus and hypothalamus, the telencephalon gives origin to the amygdala, hippocampus, basal ganglia and cortex (Gilbert, 2000, Volpe, 2008). The model shown in Figure 2 also highlights that, with the exception of the pallidum, subcortical volumes display large region-specific genetic contributions. Approximately half of the heritability of four regions was explained by region-specific genetic factors: hippocampus (49%), caudate nucleus (59%), nucleus accumbens (53%) and amygdala (56%). Increasing evidence from cross-sectional (Ostby et al., 2009) and longitudinal (Raznahan et al., 2014) studies suggest that maturation trajectories across subcortical regions are heterogeneous. The volumes of caudate, putamen, pallidum and nucleus accumbens tend to decrease linearly after reaching different peak volumes between ages 7.7 and 17.4 (Raznahan et al., 2014). On the other hand, the maturation of the amygdala and hippocampus is generally slower and their volumes tend to increase nonlinearly until they reach a stable plateau (Ostby et al., 2009). Brain structures that mature last are those that have undergone preferential expansion in primates and those involved in complex, integrative and late-maturing cognitive functions (Fjell et al., 2013, Lenroot et al., 2007, Shaw et al., 2008). As noted by Eyler et al. (2011), other factors that may contribute to region-specific variance may include differences in neurotransmitter densities, individual variation in regional maturation, sensitivity to various environmental agents and plasticity-related connectivity differences.
In line with the genetic modeling, our PCA identified four principal components that were moderately to strongly correlated with one another. The factor structure was similar to that reported by Eyler et al. (2011) in middle aged male twins, including basal ganglia and accumbens factors. Overall, our results confirm our prior hypothesis and provide evidence for similar genetic architectures in young adults and middle aged individuals. Furthermore, we observed that this architecture is similar in both males and females. However, unlike in the previously reported PCA (Eyler et al., 2011), our limbic factor did not include the amygdala. This may be due to the use of different segmentation strategies in the two studies. In our test-retest sample subset, a smaller association between hippocampus and amygdala volumes was found with FSL (rp=0.23; rg=0.43) compared to Freesurfer (rp=0.40; rg=0.61), with the latter method being used in the study by Eyler et al. (2011).
In agreement with previous studies (Blokland et al., 2012, Den Braber et al., 2013, Kremen et al., 2010, Wallace et al., 2006), heritability estimates for the nucleus accumbens and amygdala were lower compared to those of other subcortical structures. This may be partly due to limitations in both current MRI technology resolution and accuracy of semi-automated segmentation of smaller brain structures. While test-retest correlations (shown in Table 1) inform about the repeatability of a measurement, they do not provide information about the accuracy of segmentation, which may result in measurement error. Visual inspection of all our images suggested that border delineation for hippocampus, pallidum, amygdala and nucleus accumbens, all of which showed comparable test-retest reliabilities, was difficult and subject to segmentation methodological limitations. We predict that, as future methodological and technological improvements become available, these limitations may be overcome, and more accurate heritability estimates for the amygdala and nucleus accumbens can be estimated. Furthermore, our twin modeling results suggest that environmental contributions are largely region-specific (Table 4), indicating that correlated measurement error may be small or subsumed by our correction for intracranial volume.
We note that the results of this paper are based on analyses carried out on data from adolescent and young adult right-handers, and the generalisability of these results to other populations warrants further attention. Furthermore, given that only subcortical volumes were considered in the present study, it is possible that the structure of the genetic architecture may vary when other brain regions (i.e. cortical) are taken into account. For instance, a recent study (Walhovd et al., 2014) that investigated brain maturation between the ages of 8 and 22 found evidence for coordinated covariation in size between subcortical and cortical regions. Such covariation partly followed macrostructural circuits such as those between hippocampus and the Papez circuit and between the basal ganglia and prefrontal cortex. It remains to be established to what extent those cortical-subcortical covariation patterns are due to either common or region-specific genetic or environmental factors.
In summary, here we provide insights into how genetic factors contribute to volumetric variation and covariation of subcortical regions, and show that the degree and source (common or region-specific) of these genetic factors varies for each region. This is particularly relevant in the context of recent genome-wide association mapping efforts, which have identified genetic loci for intracranial and hippocampal volumes (Bis et al., 2012, Ikram et al., 2012, Stein et al., 2012, Thompson et al., 2014). As these GWAS efforts expand and identify more genetic loci, it is anticipated that novel genetic associations with either pleiotropic or region-specific effects will be uncovered, thus improving our understanding of the development, connectivity, function and pathology of the brain.
Acknowledgments
We thank the twins for their participation, Kori Johnson and the radiographers for MRI scanning and preprocessing the images, Marlene Grace and Ann Eldridge for twin recruitment. The QTIM study was supported by the National Institute of Child Health and Human Development (R01 HD050735), and the National Health and Medical Research Council (NHMRC 486682, 1009064), Australia. M.E.R. was supported by an ANZ Trustees Scholarship in Medical Research, an Endeavour International Postgraduate Research Scholarship (IPRS), and a University of Queensland Research Scholarship (UQRS). G.I.Z. is supported by an ARC Future Fellowship.
BIBLIOGRAPHY
- Allen JS, Damasio H, Grabowski TJ. Normal neuroanatomical variation in the human brain: an MRI-volumetric study. Am J Phys Anthropol. 2002;118:341–358. doi: 10.1002/ajpa.10092. [DOI] [PubMed] [Google Scholar]
- Annett M. A classification of hand preference by association analysis. Br J Psychol. 1970;61:303–321. doi: 10.1111/j.2044-8295.1970.tb01248.x. [DOI] [PubMed] [Google Scholar]
- Bird CM, Burgess N. The hippocampus and memory: insights from spatial processing. Nature reviews Neuroscience. 2008;9:182–194. doi: 10.1038/nrn2335. [DOI] [PubMed] [Google Scholar]
- Bis JC, DeCarli C, Smith AV, van der Lijn F, Crivello F, Fornage M, Debette S, Shulman JM, Schmidt H, Srikanth V, Schuur M, Yu L, Choi SH, Sigurdsson S, Verhaaren BF, DeStefano AL, Lambert JC, Jack CR, Jr, Struchalin M, Stankovich J, Ibrahim-Verbaas CA, Fleischman D, Zijdenbos A, den Heijer T, Mazoyer B, Coker LH, Enzinger C, Danoy P, Amin N, Arfanakis K, van Buchem MA, de Bruijn RF, Beiser A, Dufouil C, Huang J, Cavalieri M, Thomson R, Niessen WJ, Chibnik LB, Gislason GK, Hofman A, Pikula A, Amouyel P, Freeman KB, Phan TG, Oostra BA, Stein JL, Medland SE, Vasquez AA, Hibar DP, Wright MJ, Franke B, Martin NG, Thompson PM, Nalls MA, Uitterlinden AG, Au R, Elbaz A, Beare RJ, van Swieten JC, Lopez OL, Harris TB, Chouraki V, Breteler MM, De Jager PL, Becker JT, Vernooij MW, Knopman D, Fazekas F, Wolf PA, van der Lugt A, Gudnason V, Longstreth WT, Jr, Brown MA, Bennett DA, van Duijn CM, Mosley TH, Schmidt R, Tzourio C, Launer LJ, Ikram MA, Seshadri S Enhancing Neuro Imaging Genetics through Meta-Analysis, C., Cohorts for, H., Aging Research in Genomic Epidemiology, C. Common variants at 12q14 and 12q24 are associated with hippocampal volume. Nature genetics. 2012;44:545–551. doi: 10.1038/ng.2237. [DOI] [PMC free article] [PubMed] [Google Scholar]
- Blokland GA, de Zubicaray GI, McMahon KL, Wright MJ. Genetic and environmental influences on neuroimaging phenotypes: a meta-analytical perspective on twin imaging studies. Twin research and human genetics : the official journal of the International Society for Twin Studies. 2012;15:351–371. doi: 10.1017/thg.2012.11. [DOI] [PMC free article] [PubMed] [Google Scholar]
- Blokland GA, McMahon KL, Thompson PM, Martin NG, de Zubicaray GI, Wright MJ. Heritability of working memory brain activation. J Neurosci. 2011;31:10882–10890. doi: 10.1523/JNEUROSCI.5334-10.2011. [DOI] [PMC free article] [PubMed] [Google Scholar]
- Braskie MN, Jahanshad N, Stein JL, Barysheva M, McMahon KL, de Zubicaray GI, Martin NG, Wright MJ, Ringman JM, Toga AW, Thompson PM. Common Alzheimer’s disease risk variant within the CLU gene affects white matter microstructure in young adults. J Neurosci. 2011;31:6764–6770. doi: 10.1523/JNEUROSCI.5794-10.2011. [DOI] [PMC free article] [PubMed] [Google Scholar]
- Chiang MC, Barysheva M, Shattuck DW, Lee AD, Madsen SK, Avedissian C, Klunder AD, Toga AW, McMahon KL, de Zubicaray GI, Wright MJ, Srivastava A, Balov N, Thompson PM. Genetics of brain fiber architecture and intellectual performance. J Neurosci. 2009;29:2212–2224. doi: 10.1523/JNEUROSCI.4184-08.2009. [DOI] [PMC free article] [PubMed] [Google Scholar]
- Colibazzi T, Zhu H, Bansal R, Schultz RT, Wang Z, Peterson BS. Latent volumetric structure of the human brain: Exploratory factor analysis and structural equation modeling of gray matter volumes in healthy children and adults. Hum Brain Mapp. 2008;29:1302–1312. doi: 10.1002/hbm.20466. [DOI] [PMC free article] [PubMed] [Google Scholar]
- de Zubicaray GI, Chiang MC, McMahon KL, Shattuck DW, Toga AW, Martin NG, Wright MJ, Thompson PM. Meeting the Challenges of Neuroimaging Genetics. Brain imaging and behavior. 2008;2:258–263. doi: 10.1007/s11682-008-9029-0. [DOI] [PMC free article] [PubMed] [Google Scholar]
- den Braber A, Bohlken MM, Brouwer RM, van ’t Ent D, Kanai R, Kahn RS, de Geus EJ, Hulshoff Pol HE, Boomsma DI. Heritability of subcortical brain measures: a perspective for future genome-wide association studies. NeuroImage. 2013;83:98–102. doi: 10.1016/j.neuroimage.2013.06.027. [DOI] [PubMed] [Google Scholar]
- Dewey J, Hana G, Russell T, Price J, McCaffrey D, Harezlak J, Sem E, Anyanwu JC, Guttmann CR, Navia B, Cohen R, Tate DF, Consortium HIVN. Reliability and validity of MRI-based automated volumetry software relative to auto-assisted manual measurement of subcortical structures in HIV-infected patients from a multisite study. NeuroImage. 2010;51:1334–1344. doi: 10.1016/j.neuroimage.2010.03.033. [DOI] [PMC free article] [PubMed] [Google Scholar]
- Eyler LT, Prom-Wormley E, Fennema-Notestine C, Panizzon MS, Neale MC, Jernigan TL, Fischl B, Franz CE, Lyons MJ, Stevens A, Pacheco J, Perry ME, Schmitt JE, Spitzer NC, Seidman LJ, Thermenos HW, Tsuang MT, Dale AM, Kremen WS. Genetic patterns of correlation among subcortical volumes in humans: results from a magnetic resonance imaging twin study. Hum Brain Mapp. 2011;32:641–653. doi: 10.1002/hbm.21054. [DOI] [PMC free article] [PubMed] [Google Scholar]
- Feinstein JS, Adolphs R, Damasio A, Tranel D. The human amygdala and the induction and experience of fear. Current biology : CB. 2011;21:34–38. doi: 10.1016/j.cub.2010.11.042. [DOI] [PMC free article] [PubMed] [Google Scholar]
- Fischl B, Salat DH, Busa E, Albert M, Dieterich M, Haselgrove C, van der Kouwe A, Killiany R, Kennedy D, Klaveness S, Montillo A, Makris N, Rosen B, Dale AM. Whole brain segmentation: automated labeling of neuroanatomical structures in the human brain. Neuron. 2002;33:341–355. doi: 10.1016/s0896-6273(02)00569-x. [DOI] [PubMed] [Google Scholar]
- Fjell AM, Westlye LT, Amlien I, Tamnes CK, Grydeland H, Engvig A, Espeseth T, Reinvang I, Lundervold AJ, Lundervold A, Walhovd KB. High-Expanding Cortical Regions in Human Development and Evolution Are Related to Higher Intellectual Abilities. Cereb Cortex. 2013 doi: 10.1093/cercor/bht201. [DOI] [PubMed] [Google Scholar]
- Gilbert SF. Differentiation of the Neural Tube. Sinauer Associates; Sunderland, MA: 2000. [Google Scholar]
- Gillespie NA, Martin NG. Multivariate genetic analysis. In: Everitt BS, Howell DC, editors. Encyclopedia of Statistics in Behavioral Science. Wiley; Chirchester: 2005. pp. 1363–1370. [Google Scholar]
- Goldstein JM, Seidman LJ, Horton NJ, Makris N, Kennedy DN, Caviness VS, Jr, Faraone SV, Tsuang MT. Normal sexual dimorphism of the adult human brain assessed by in vivo magnetic resonance imaging. Cereb Cortex. 2001;11:490–497. doi: 10.1093/cercor/11.6.490. [DOI] [PubMed] [Google Scholar]
- Grahn JA, Parkinson JA, Owen AM. The role of the basal ganglia in learning and memory: neuropsychological studies. Behavioural brain research. 2009;199:53–60. doi: 10.1016/j.bbr.2008.11.020. [DOI] [PubMed] [Google Scholar]
- Hanson JL, Suh JW, Nacewicz BM, Sutterer MJ, Cayo AA, Stodola DE, Burghy CA, Wang H, Avants BB, Yushkevich PA, Essex MJ, Pollak SD, Davidson RJ. Robust Automated Amygdala Segmentation via Multi-Atlas Diffeomorphic Registration. Frontiers in neuroscience. 2012;6:166. doi: 10.3389/fnins.2012.00166. [DOI] [PMC free article] [PubMed] [Google Scholar]
- Ikram MA, Fornage M, Smith AV, Seshadri S, Schmidt R, Debette S, Vrooman HA, Sigurdsson S, Ropele S, Taal HR, Mook-Kanamori DO, Coker LH, Longstreth WT, Jr, Niessen WJ, DeStefano AL, Beiser A, Zijdenbos AP, Struchalin M, Jack CR, Jr, Rivadeneira F, Uitterlinden AG, Knopman DS, Hartikainen AL, Pennell CE, Thiering E, Steegers EA, Hakonarson H, Heinrich J, Palmer LJ, Jarvelin MR, McCarthy MI, Grant SF, St Pourcain B, Timpson NJ, Smith GD, Sovio U, Nalls MA, Au R, Hofman A, Gudnason H, van der Lugt A, Harris TB, Meeks WM, Vernooij MW, van Buchem MA, Catellier D, Jaddoe VW, Gudnason V, Windham BG, Wolf PA, van Duijn CM, Mosley TH, Jr, Schmidt H, Launer LJ, Breteler MM, DeCarli C Early Growth Genetics, C., Cohorts for, H., Aging Research in Genomic Epidemiology C. Common variants at 6q22 and 17q21 are associated with intracranial volume. Nature genetics. 2012;44:539–544. doi: 10.1038/ng.2245. [DOI] [PMC free article] [PubMed] [Google Scholar]
- Jahanshad N, Lee AD, Barysheva M, McMahon KL, de Zubicaray GI, Martin NG, Wright MJ, Toga AW, Thompson PM. Genetic influences on brain asymmetry: a DTI study of 374 twins and siblings. NeuroImage. 2010;52:455–469. doi: 10.1016/j.neuroimage.2010.04.236. [DOI] [PMC free article] [PubMed] [Google Scholar]
- Kennedy DN, Lange N, Makris N, Bates J, Meyer J, Caviness VS., Jr Gyri of the human neocortex: an MRI-based analysis of volume and variance. Cereb Cortex. 1998;8:372–384. doi: 10.1093/cercor/8.4.372. [DOI] [PubMed] [Google Scholar]
- Kremen WS, Prom-Wormley E, Panizzon MS, Eyler LT, Fischl B, Neale MC, Franz CE, Lyons MJ, Pacheco J, Perry ME, Stevens A, Schmitt JE, Grant MD, Seidman LJ, Thermenos HW, Tsuang MT, Eisen SA, Dale AM, Fennema-Notestine C. Genetic and environmental influences on the size of specific brain regions in midlife: the VETSA MRI study. NeuroImage. 2010;49:1213–1223. doi: 10.1016/j.neuroimage.2009.09.043. [DOI] [PMC free article] [PubMed] [Google Scholar]
- Lenroot RK, Gogtay N, Greenstein DK, Wells EM, Wallace GL, Clasen LS, Blumenthal JD, Lerch J, Zijdenbos AP, Evans AC, Thompson PM, Giedd JN. Sexual dimorphism of brain developmental trajectories during childhood and adolescence. NeuroImage. 2007;36:1065–1073. doi: 10.1016/j.neuroimage.2007.03.053. [DOI] [PMC free article] [PubMed] [Google Scholar]
- Loehlin JC. The Cholesky Approach: A Cautionary Note. Behavior Genetics. 1996;26:65–69. [Google Scholar]
- Mechelli A, Friston KJ, Frackowiak RS, Price CJ. Structural covariance in the human cortex. J Neurosci. 2005;25:8303–8310. doi: 10.1523/JNEUROSCI.0357-05.2005. [DOI] [PMC free article] [PubMed] [Google Scholar]
- Morey RA, Petty CM, Xu Y, Hayes JP, Wagner HR, 2nd, Lewis DV, LaBar KS, Styner M, McCarthy G. A comparison of automated segmentation and manual tracing for quantifying hippocampal and amygdala volumes. NeuroImage. 2009;45:855–866. doi: 10.1016/j.neuroimage.2008.12.033. [DOI] [PMC free article] [PubMed] [Google Scholar]
- Neale MC, Boker SM, Xie G, Maes HH. Mx: Statistical Modeling. Department of Psychiatry; Richmond, VA: 2003. [Google Scholar]
- Neale MC, Cardon LR. Methodology for genetic studies of twins and families. Kluwer Academic Publishers; 1992a. [Google Scholar]
- Neale MC, Cardon LR. Methods for genetic studies of twins and families. Kluwer Academic Publishers; The Netherlands: 1992b. [Google Scholar]
- Nugent AC, Luckenbaugh DA, Wood SE, Bogers W, Zarate CA, Jr, Drevets WC. Automated subcortical segmentation using FIRST: Test-retest reliability, interscanner reliability, and comparison to manual segmentation. Hum Brain Mapp. 2013;34:2313–2329. doi: 10.1002/hbm.22068. [DOI] [PMC free article] [PubMed] [Google Scholar]
- Ostby Y, Tamnes CK, Fjell AM, Westlye LT, Due-Tonnessen P, Walhovd KB. Heterogeneity in subcortical brain development: A structural magnetic resonance imaging study of brain maturation from 8 to 30 years. J Neurosci. 2009;29:11772–11782. doi: 10.1523/JNEUROSCI.1242-09.2009. [DOI] [PMC free article] [PubMed] [Google Scholar]
- Plomin R, DeFries JC, Knopik VS, Neiderhiser JM. Behavioral Genetics. Worth Publishers; New York: 2013. [Google Scholar]
- Posthuma D, Beem AL, de Geus EJ, van Baal GC, von Hjelmborg JB, Iachine I, Boomsma DI. Theory and practice in quantitative genetics. Twin Res. 2003;6:361–376. doi: 10.1375/136905203770326367. [DOI] [PubMed] [Google Scholar]
- Raz N, Gunning-Dixon F, Head D, Rodrigue KM, Williamson A, Acker JD. Aging, sexual dimorphism, and hemispheric asymmetry of the cerebral cortex: replicability of regional differences in volume. Neurobiol Aging. 2004;25:377–396. doi: 10.1016/S0197-4580(03)00118-0. [DOI] [PubMed] [Google Scholar]
- Raz N, Gunning FM, Head D, Dupuis JH, McQuain J, Briggs SD, Loken WJ, Thornton AE, Acker JD. Selective aging of the human cerebral cortex observed in vivo: differential vulnerability of the prefrontal gray matter. Cereb Cortex. 1997;7:268–282. doi: 10.1093/cercor/7.3.268. [DOI] [PubMed] [Google Scholar]
- Raz N, Lindenberger U, Rodrigue KM, Kennedy KM, Head D, Williamson A, Dahle C, Gerstorf D, Acker JD. Regional brain changes in aging healthy adults: general trends, individual differences and modifiers. Cereb Cortex. 2005;15:1676–1689. doi: 10.1093/cercor/bhi044. [DOI] [PubMed] [Google Scholar]
- Raznahan A, Shaw PW, Lerch JP, Clasen LS, Greenstein D, Berman R, Pipitone J, Chakravarty MM, Giedd JN. Longitudinal four-dimensional mapping of subcortical anatomy in human development. Proceedings of the National Academy of Sciences of the United States of America. 2014;111:1592–1597. doi: 10.1073/pnas.1316911111. [DOI] [PMC free article] [PubMed] [Google Scholar]
- Revelle W. psych: Procedures for Personality and Psychological Research. Northwestern University; Evanston, Illinois, USA: 2013. [Google Scholar]
- Rogers I, Metcalfe C, Gunnell D, Emmett P, Dunger D, Holly J Avon Longitudinal Study of Parents Children Study, T. Insulin-like growth factor-I and growth in height, leg length, and trunk length between ages 5 and 10 years. The Journal of clinical endocrinology and metabolism. 2006;91:2514–2519. doi: 10.1210/jc.2006-0388. [DOI] [PubMed] [Google Scholar]
- Shaw P, Kabani NJ, Lerch JP, Eckstrand K, Lenroot R, Gogtay N, Greenstein D, Clasen L, Evans A, Rapoport JL, Giedd JN, Wise SP. Neurodevelopmental trajectories of the human cerebral cortex. J Neurosci. 2008;28:3586–3594. doi: 10.1523/JNEUROSCI.5309-07.2008. [DOI] [PMC free article] [PubMed] [Google Scholar]
- Stein JL, Medland SE, Vasquez AA, Hibar DP, Senstad RE, Winkler AM, Toro R, Appel K, Bartecek R, Bergmann O, Bernard M, Brown AA, Cannon DM, Chakravarty MM, Christoforou A, Domin M, Grimm O, Hollinshead M, Holmes AJ, Homuth G, Hottenga JJ, Langan C, Lopez LM, Hansell NK, Hwang KS, Kim S, Laje G, Lee PH, Liu X, Loth E, Lourdusamy A, Mattingsdal M, Mohnke S, Maniega SM, Nho K, Nugent AC, O’Brien C, Papmeyer M, Putz B, Ramasamy A, Rasmussen J, Rijpkema M, Risacher SL, Roddey JC, Rose EJ, Ryten M, Shen L, Sprooten E, Strengman E, Teumer A, Trabzuni D, Turner J, van Eijk K, van Erp TG, van Tol MJ, Wittfeld K, Wolf C, Woudstra S, Aleman A, Alhusaini S, Almasy L, Binder EB, Brohawn DG, Cantor RM, Carless MA, Corvin A, Czisch M, Curran JE, Davies G, de Almeida MA, Delanty N, Depondt C, Duggirala R, Dyer TD, Erk S, Fagerness J, Fox PT, Freimer NB, Gill M, Goring HH, Hagler DJ, Hoehn D, Holsboer F, Hoogman M, Hosten N, Jahanshad N, Johnson MP, Kasperaviciute D, Kent JW, Jr, Kochunov P, Lancaster JL, Lawrie SM, Liewald DC, Mandl R, Matarin M, Mattheisen M, Meisenzahl E, Melle I, Moses EK, Muhleisen TW, et al. Identification of common variants associated with human hippocampal and intracranial volumes. Nature genetics. 2012;44:552–561. doi: 10.1038/ng.2250. [DOI] [PMC free article] [PubMed] [Google Scholar]
- Supekar K, Musen M, Menon V. Development of large-scale functional brain networks in children. PLoS Biol. 2009;7:e1000157. doi: 10.1371/journal.pbio.1000157. [DOI] [PMC free article] [PubMed] [Google Scholar]
- Taki Y, Hashizume H, Sassa Y, Takeuchi H, Asano M, Asano K, Kotozaki Y, Nouchi R, Wu K, Fukuda H, Kawashima R. Correlation among body height, intelligence, and brain gray matter volume in healthy children. NeuroImage. 2012;59:1023–1027. doi: 10.1016/j.neuroimage.2011.08.092. [DOI] [PubMed] [Google Scholar]
- Thompson PM, Stein JL, Medland SE, Hibar DP, Vasquez AA, Renteria ME, Toro R, Jahanshad N, Schumann G, Franke B, Wright MJ, Martin NG, Agartz I, Alda M, Alhusaini S, Almasy L, Almeida J, Alpert K, Andreasen NC, Andreassen OA, Apostolova LG, Appel K, Armstrong NJ, Aribisala B, Bastin ME, Bauer M, Bearden CE, Bergmann O, Binder EB, Blangero J, Bockholt HJ, Boen E, Bois C, Boomsma DI, Booth T, Bowman IJ, Bralten J, Brouwer RM, Brunner HG, Brohawn DG, Buckner RL, Buitelaar J, Bulayeva K, Bustillo JR, Calhoun VD, Cannon DM, Cantor RM, Carless MA, Caseras X, Cavalleri GL, Chakravarty MM, Chang KD, Ching CR, Christoforou A, Cichon S, Clark VP, Conrod P, Coppola G, Crespo-Facorro B, Curran JE, Czisch M, Deary IJ, de Geus EJ, den Braber A, Delvecchio G, Depondt C, de Haan L, de Zubicaray GI, Dima D, Dimitrova R, Djurovic S, Dong H, Donohoe G, Duggirala R, Dyer TD, Ehrlich S, Ekman CJ, Elvsashagen T, Emsell L, Erk S, Espeseth T, Fagerness J, Fears S, Fedko I, Fernandez G, Fisher SE, Foroud T, Fox PT, Francks C, Frangou S, Frey EM, Frodl T, Frouin V, Garavan H, Giddaluru S, Glahn DC, Godlewska B, Goldstein RZ, Gollub RL, Grabe HJ, et al. The ENIGMA Consortium: large-scale collaborative analyses of neuroimaging and genetic data. Brain imaging and behavior. 2014 doi: 10.1007/s11682-013-9269-5. [DOI] [PMC free article] [PubMed] [Google Scholar]
- Volpe JJ. Neurology of the Newborn. Saunders Elsevier; Philadelphia, USA: 2008. [Google Scholar]
- Walhovd KB, Tamnes CK, Bjornerud A, Due-Tonnessen P, Holland D, Dale AM, Fjell AM. Maturation of Cortico-Subcortical Structural Networks--Segregation and Overlap of Medial Temporal and Fronto-Striatal Systems in Development. Cereb Cortex. 2014 doi: 10.1093/cercor/bht424. [DOI] [PubMed] [Google Scholar]
- Wallace GL, Eric Schmitt J, Lenroot R, Viding E, Ordaz S, Rosenthal MA, Molloy EA, Clasen LS, Kendler KS, Neale MC, Giedd JN. A pediatric twin study of brain morphometry. J Child Psychol Psychiatry. 2006;47:987–993. doi: 10.1111/j.1469-7610.2006.01676.x. [DOI] [PubMed] [Google Scholar]