Abstract
Digital breast tomosynthesis (DBT) is a pseudo-three-dimensional x-ray imaging modality proposed to decrease the effect of tissue superposition present in mammography, potentially resulting in an increase in clinical performance for the detection and diagnosis of breast cancer. Tissue classification in DBT images can be useful in risk assessment, computer-aided detection and radiation dosimetry, among other aspects. However, classifying breast tissue in DBT is a challenging problem because DBT images include complicated structures, image noise, and out-of-plane artifacts due to limited angular tomographic sampling. In this project, we propose an automatic method to classify fatty and glandular tissue in DBT images. First, the DBT images are pre-processed to enhance the tissue structures and to decrease image noise and artifacts. Second, a global smooth filter based on L0 gradient minimization is applied to eliminate detailed structures and enhance large-scale ones. Third, the similar structure regions are extracted and labeled by fuzzy C-means (FCM) classification. At the same time, the texture features are also calculated. Finally, each region is classified into different tissue types based on both intensity and texture features. The proposed method is validated using five patient DBT images using manual segmentation as the gold standard. The Dice scores and the confusion matrix are utilized to evaluate the classified results. The evaluation results demonstrated the feasibility of the proposed method for classifying breast glandular and fat tissue on DBT images.
Keywords: Breast tissue classification, Digital breast tomosynthesis, Global gradient minimization, Texture features
1. INTRODUCTION
Mammography is a routine imaging modality for breast cancer detection, which can effectively reduce mortality from the disease. However, mammography only provides two-dimensional (2D) projection images of a three-dimensional (3D) object, resulting in breast tissue superposition, which leads to missed cancers and false positives. Digital breast tomosynthesis (DBT), which is a 3D x-ray imaging modality, was proposed to decrease tissue superposition in mammography, resulting in an increase in detection and diagnostic accuracy [1, 2]. Classifying different breast tissue in DBT images may have a positive impact on mass tissue detection, radiation dose estimation, and cancer risk assessment [3–12]. Although DBT is superior to mammography in term of 3D information, automated tissue classification of DBT images is still a challenging problem due to the low vertical resolution and presence of out-of-plane artifacts due to its limited angular tomographic imaging [13, 14].
The classification method based on DBT images was started by Kontos et al. [9]. They investigated 2D and 3D texture features (e.g., skewness, coarseness, etc.) in different tissue regions and found that these texture features were useful for the classification purpose. Another effort was made by Vedantham et al. on the pre-processing before intensity based classification in DBT images [12]. Because of the existence of out-of-plain artifacts and image noise, a 3 dimensional anisotropic filter was introduced to improve the image quality [5]. In this project, we propose an automatic DBT classification method that can classify both adipose and glandular tissue in DBT images based on L0 gradient minimization [15] and a fuzzy C-means algorithm. The accuracy of this proposed classification method was validated using five patient images using manual segmentation as the gold standard.
2. MATERIALS AND METHODS
The main problem in classifying different tissue types from DBT images is that there are severe artifacts caused by its limited angle reconstruction. Another issue is the complicated patterns in which the glandular tissue is distributed, which makes it harder to classify it just based on the intensity. Thus, our proposed method will focus on solving both problems on patient data. Thus, the algorithm was developed and tested using five patient DBT images, acquired with a clinical tomosynthesis machine (Selenia Dimensions, Hologic, Inc) for an ongoing IRB-approved clinical trial. The patients released these images for further research upon anonymization.
2.1 Overview of the proposed pre-processing and classification method
Tomosynthesis images are usually affected by noise and also by substantial out-of-plane artifacts, making it difficult to identify breast tissues from tomosynthesis images. Thus, in order to tackle the presence of artifacts before image classification, DBT images are pre-processed by different filters. After pre-processing, the processed images contain different tubular structures and other small discontinuous regions, which are shown bright in the images. To address this problem, a global smoothing filter based on L0 gradient minimization is applied to eliminate detailed structures and to enhance large-scale ones in the images. The smoothed images are divided into different regions and are labeled based on their intensity similarity. The average intensity and texture features for each labeled region are calculated. Finally, a fuzzy C-means algorithm is used to classify these labeled regions into different tissue types based on those calculated features. The flowchart of the whole procedure is shown in Figure 1.
Figure 1.

Flowchart of the DBT classification procedure.
2.2 Pre-processing
Nonlinear filters have the ability of preserving the edges during denoising [16]. Three different filters are used to increase image quality. First, an angular constrained bilateral filter (ACBL) is applied to reduce the out-of-slice artifacts caused by the limited angle imaging [12]. A general bilateral filter is a weighted average of the local neighborhood samples. It is a is non-linear, edge-preserving and noise-reducing smoothing filter, whose weights are computed based on both spatial and intensity histogram distances between the center sample and the neighboring samples [17]. Usually, the weights are set as Gaussian distributions. The bilateral filter can both preserve sharp edges and remove the noise in the image. For a given image I, its intensity at point x is I(x), then its corresponding filtered results is defined as:
| (1) |
where IBL is the filtered image, Ω is the window centered in x, fr is the range kernel for smoothing differences in intensities, and gs is the spatial kernel for smoothing differences in coordinates. Both smoothing kernel applied here are following Gaussian distributions.
In order to decrease the angular based artifacts, according to the imaging angular range, this filter is modified as an angular constrained bilateral filter in the x-z plane, i.e. parallel to the X-ray projection direction, which can reduce the “X” shaped out-of-slice artifacts in the x-z plane. In our project, the angular range is from −7.5° to 7.5°.
Second, cupping artifacts needs to be corrected before classification. The intensity values in the center of the reconstructed breast are lower than those at the margins in the reconstructed image. This cupping artifact should be considered in the x-y plane, i.e. vertical to the X-ray projection direction. This artifact will affect the classification accuracy when an intensity based classification method is used. To reduce the cupping artifact, we applied a bias correction (BC) method that was previously used for breast CT image classification [18].
After the bias correction, the intensity histogram of the processed DBT images is adjusted by the constrained limited adaptive histogram equalization (CLAHE) [19]. This method can enhance the details as well as the local contrast in the corrected images. In order to reduce image noise while maintaining edge sharpness as much as possible, a bilateral filter (BL) is utilized to remove the noise in the x-y plane.
2.3 Classification
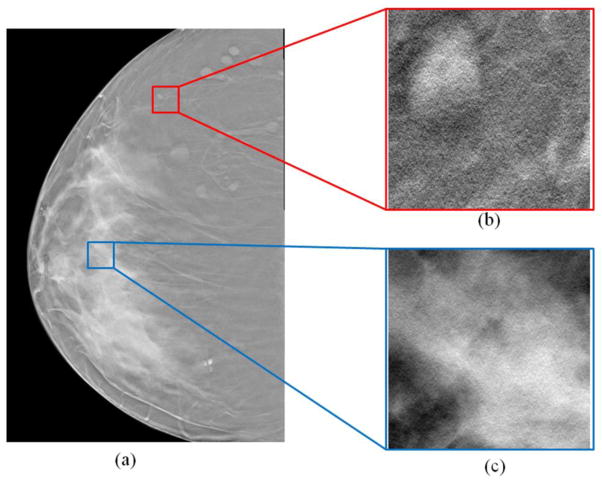
After the pre-processing step, the DBT images have been enhanced for breast tissue classification. A breast mask and morphologic operation segments the whole breast and the skin regions. Then, the classification focuses on the glandular and fat tissue in the whole breast region within the skin. Being different from those methods that utilize the intensity similarity for the segmentation of different tissue regions [20–23], the criteria for the classification here is mainly based on the fact that the texture features of different tissues are different, as shown in Figure 2.
Figure 2.
Different tissue regions from a DBT image (a). (b) The adipose tissue region. (c) The glandular tissue region. The texture features, contrast, and homogeneity are different at the two different regions.
L0 Gradient Filter
The breast tube structures in DBT images can be complicated and lead to inaccurate classification. We utilize an L0 gradient filter to eliminate detailed structures and to enhance large-scale ones in the images [15]. The filter is a global smooth filter based on L0 gradient minimization. Here, we suppose that I is the input image to be filtered by the L0 gradient filter and S be the filtered result. The intensity gradient at point p is ∇Sp = (∂xSp, ∂y,Sp), which is calculated from the intensity differences along both x and y directions. Then, a global gradient measurement function, as shown below, is used to process the image.
| (2) |
This function is designed to calculate the number of gradients around the whole image. Here #{} is the counting operator to calculate the number of p that has non-zero gradient, which is the L0 norm of gradient. This counting function only considers the number of non-zero gradients rather than the magnitudes of the gradients. Based on the measurement function C(S), the output image S is filtered by optimizing the following function:
| (3) |
where α is the weight parameter to control the significance of the global gradient measurement function C(S), and the term Σp(Sp − Ip)2 constrains the similarity of the image intensity. In order to solve this function to acquire the minimum result of the function (3), a special alternating optimization strategy with half quadratic splitting is applied here, which is based on the idea of introducing auxiliary variables to iteratively expand and update the original terms.
This L0 gradient filter can further denoise the image in order to make it smoother. At the same time, the global smoothness ability of the filter can merge the points as one region with similar intensity. Therefore, different regions can be extracted and labeled from the gradient filtered images using a fuzzy C-means (FCM) algorithm [24, 25].
Texture feature extraction and tissue classification
Texture feature has been proven useful for tissue classification in DBT images [8, 9]. We calculate 8 texture features: skewness, contrast, correlation, entropy, sum entropy, difference entropy, sum of variances, information measures of correlation, and the mean intensity of each region. These are all calculated from the images after pre-processing and before L0 gradient filtering. Based on the texture features and mean intensity for each labeled region, FCM is applied to classify the breast into two groups: adipose and glandular tissue.
2.4 Evaluation
Quantitative evaluations are usually conducted by comparing the automatic results with the corresponding manual segmentation results [26–38]. In this project, the manual segmentation was performed without knowledge of the automatic segmentation results using a commercial software Analyze (AnalyzeDirect Inc., Overland Park, KS). The Dice score is used as the metric to assess the classification performance. It is computed as follows:
| (4) |
where S and G represent the pixel set of the classified regions obtained by the proposed algorithm and by the gold standard, respectively.
For further analysis, we set glandular tissue as positive and adipose tissue as negative. Then a confusion table is created with two rows and two columns presenting the number of voxels of True Negatives (TN), False Positives (FP), False Negatives (FN), and True Positives (TP) for predictive analytics [39]. Compared with the gold standard, TN means that adipose tissue is correctly classified as adipose; FP means that adipose tissue is falsely classified as glandular; FN means that glandular tissue is falsely classified as adipose; and TP means that glandular tissue is correctly classified as glandular. The confusion table of the classification is calculated as
| (5) |
| (6) |
| (7) |
3. RESULTS
3.1 Pre-processing results
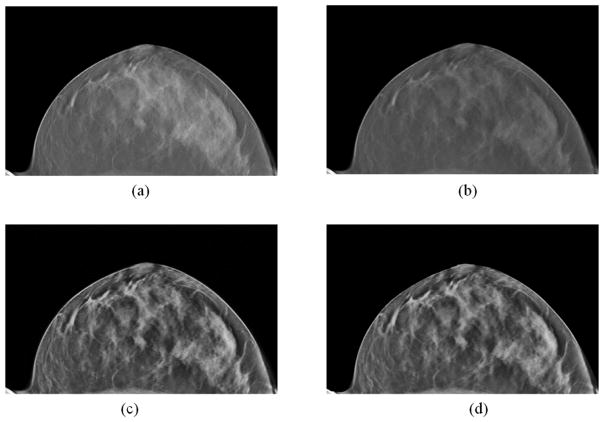
Figure 3 shows the pre-processed images of one patient case. After the pre-processing, the artifacts and noise in Figure 3(a) were reduced and the detailed structures in the breast were enhanced (Figure 3(d)).
Figure 3.
The pre-processing results of the DBT image. (a) Original image. (b) Result after the out-of-plane and cupping artifact corrections. (c) Results after the constrained local histogram equalization. (d) Denoising results after bilateral filtering.
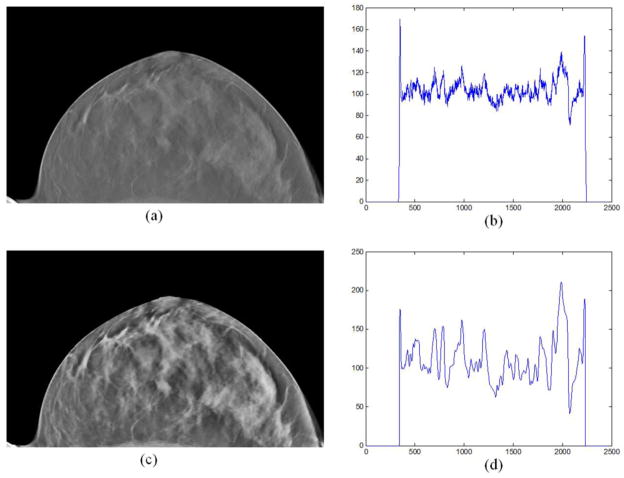
Moreover, the intensities of the DBT image before and after pre-processing were compared with profiles, as shown in Figure 4. It can be seen from Figure 4(b) that the intensity of the processed image was smoother and its dynamic range was increased comparing with the original image in Figure 4(d).
Figure 4.
The comparison of the image intensities between the original image (a) and the pre-processed image (c). (b) An intensity profile of a horizontal profile on the original image; (d) The same horizontal profile of the pre-preprocessed image (c).
3.2 Classification results
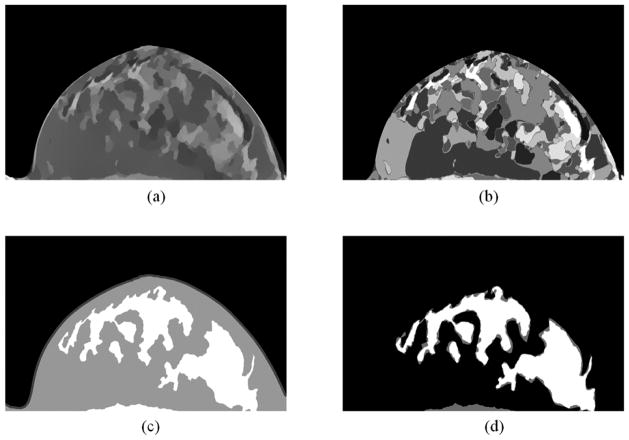
Figure 5 shows the processed and classified results. The preprocessed images, as shown in Figure 3(d), are smoothed by the L0 gradient filter, as shown in Figure 5 (a). Then the filtered image was labeled into 20 regions by a fuzzy C-means classification method (Figure 5 (b)). After that, the labeled images were classified into 2 regions based on their texture features. The final results and their comparison with gold standard were shown in Figure 5 (c) and Figure 5 (d), respectively.
Figure 5.
Classification results. (a) Smoothed results of Figure 2(d) by the L0 gradient filter. (b) Labeled regions of (a). (c) Classified results based on the texture features in the labeled regions in (b), where the white region is the glandular tissue, the grey one is the adipose tissue, and the outer thin region is the skin. (d) Comparison between classified results and the gold standard, where white regions are the agreed regions and the gray are the errors.
3.3 Evaluations of five patient data
Based on the proposed method, the classified results of five patients were analyzed. The evaluation results including the Dice score, sensitivity, specificity, and accuracy for both glandular and adipose tissue were calculated, as shown in Table 1.
Table 1.
Evaluations of the classified results from five patient data
| Patient number | Glandular Dice (%) | Adipose Dice (%) | Sensitivity (%) | Specificity (%) | Accuracy (%) |
|---|---|---|---|---|---|
| 1 | 82.5 | 94.9 | 78.9 | 96.2 | 92.1 |
| 2 | 90.3 | 88.1 | 85.9 | 94.0 | 89.3 |
| 3 | 89.6 | 95.1 | 87.3 | 96.3 | 93.3 |
| 4 | 91.0 | 93.9 | 88.2 | 95.9 | 92.7 |
| 5 | 84.2 | 92.1 | 82.5 | 95.2 | 90.6 |
|
| |||||
| Mean ± std | 87.5 ± 3.9 | 92.8 ± 2.9 | 84.6 ± 3.8 | 95.5 ± 1.0 | 91.6 ± 1.6 |
4. CONCLUSIONS
We proposed a pre-processing and classification method utilizing global gradient minimization and texture features for digital breast tomosynthesis images. Preliminary results on five patients demonstrate the feasibility of the proposed method for classifying glandular and adipose tissue of the breast on tomosynthesis images.
Acknowledgments
This research is supported in part by NIH grants (R01CA156775, R21CA176684, R01CA163746, and P50CA128301), Susan G. Komen Foundation Grant IIR13262248 and Georgia Cancer Coalition Distinguished Clinicians and Scientists Award.
References
- 1.Niklason LT, Christian BT, Niklason LE, et al. Digital tomosynthesis in breast imaging. Radiology. 1997;205(2):399–406. doi: 10.1148/radiology.205.2.9356620. [DOI] [PubMed] [Google Scholar]
- 2.Park JM, Franken EA, Jr, Garg M, et al. Breast tomosynthesis: present considerations and future applications. Radiographics. 2007;27(Suppl 1):S231–40. doi: 10.1148/rg.27si075511. [DOI] [PubMed] [Google Scholar]
- 3.Reiser I, Nishikawa RM, Giger ML, et al. Computerized detection of mass lesions in digital breast tomosynthesis images using two- and three dimensional radial gradient index segmentation. Technol Cancer Res Treat. 2004;3(5):437–41. doi: 10.1177/153303460400300504. [DOI] [PubMed] [Google Scholar]
- 4.Reiser I, Nishikawa RM, Giger ML, et al. Computerized mass detection for digital breast tomosynthesis directly from the projection images. Med Phys. 2006;33(2):482–91. doi: 10.1118/1.2163390. [DOI] [PubMed] [Google Scholar]
- 5.Sun XJ, Land W, Samala R. Deblurring of tomosynthesis images using 3D anisotropic diffusion filtering. Medical Imaging 2007: Image Processing. 2007;6512:5124. [Google Scholar]
- 6.Chan HP, Wei J, Zhang Y, et al. Computer-aided detection of masses in digital tomosynthesis mammography: comparison of three approaches. Med Phys. 2008;35(9):4087–95. doi: 10.1118/1.2968098. [DOI] [PMC free article] [PubMed] [Google Scholar]
- 7.Reiser I, Nishikawa RM, Edwards AV, et al. Automated detection of microcalcification clusters for digital breast tomosynthesis using projection data only: a preliminary study. Med Phys. 2008;35(4):1486–93. doi: 10.1118/1.2885366. [DOI] [PMC free article] [PubMed] [Google Scholar]
- 8.Despina Kontos RB, Bakic Predrag R, Maidment Andrew DA. Breast Tissue Classification in Digital Breast Tomosynthesis Images using texture. SPIE Medical Imaging 2009: Computer-Aided Diagnosis. 2009;7260:726024–1. [Google Scholar]
- 9.Kontos D, Bakic PR, Carton AK, et al. Parenchymal texture analysis in digital breast tomosynthesis for breast cancer risk estimation: a preliminary study. Acad Radiol. 2009;16(3):283–98. doi: 10.1016/j.acra.2008.08.014. [DOI] [PMC free article] [PubMed] [Google Scholar]
- 10.Bertolini M, Nitrosi A, Borasi G, et al. Contrast Detail Phantom Comparison on a Commercially Available Unit. Digital Breast Tomosynthesis (DBT) versus Full-Field Digital Mammography (FFDM) Journal of Digital Imaging. 2011;24(1):58–65. doi: 10.1007/s10278-009-9270-0. [DOI] [PMC free article] [PubMed] [Google Scholar]
- 11.Kontos D, Ikejimba LC, Bakic PR, et al. Analysis of parenchymal texture with digital breast tomosynthesis: comparison with digital mammography and implications for cancer risk assessment. Radiology. 2011;261(1):80–91. doi: 10.1148/radiol.11100966. [DOI] [PMC free article] [PubMed] [Google Scholar]
- 12.Vedantham S, Shi L, Karellas A, et al. Semi-automated segmentation and classification of digital breast tomosynthesis reconstructed images. Conf Proc IEEE Eng Med Biol Soc. 2011;2011:6188–91. doi: 10.1109/IEMBS.2011.6091528. [DOI] [PMC free article] [PubMed] [Google Scholar]
- 13.Sechopoulos I. A review of breast tomosynthesis. Part I. The image acquisition process. Medical Physics. 2013;40(1):014301. doi: 10.1118/1.4770279. [DOI] [PMC free article] [PubMed] [Google Scholar]
- 14.Sechopoulos I. A review of breast tomosynthesis. Part II. Image reconstruction, processing and analysis, and advanced applications. Med Phys. 2013;40(1):014302. doi: 10.1118/1.4770281. [DOI] [PMC free article] [PubMed] [Google Scholar]
- 15.Xu L, Lu CW, Xu Y, et al. Image Smoothing via L-0 Gradient Minimization. Acm Transactions on Graphics. 2011;30(6) [Google Scholar]
- 16.Qin X, Cong Z, Jiang R, et al. Extracting cardiac myofiber orientations from high frequency ultrasound images; Proceedings of SPIE; 2013; 2013. pp. 867507–8. [DOI] [PMC free article] [PubMed] [Google Scholar]
- 17.Tomasi C, Manduchi R. Bilateral filtering for gray and color images. Sixth International Conference on Computer Vision; 1998. pp. 839–846. [Google Scholar]
- 18.Sechopoulos I, Bliznakova K, Qin XL, et al. Characterization of the homogeneous tissue mixture approximation in breast imaging dosimetry. Medical Physics. 2012;39(8):5050–5059. doi: 10.1118/1.4737025. [DOI] [PMC free article] [PubMed] [Google Scholar]
- 19.Zuiderveld K. Contrast limited adaptive histogram equalization. Academic Press Professional, Inc; 1994. [Google Scholar]
- 20.Qin X, Wang S, Wan M. Improving reliability and accuracy of vibration parameters of vocal folds based on high-speed video and electroglottography. IEEE Trans Biomed Eng. 2009;56(6):1744–54. doi: 10.1109/TBME.2009.2015772. [DOI] [PubMed] [Google Scholar]
- 21.Akbari H, Fei BW. 3D ultrasound image segmentation using wavelet support vector machines. Medical Physics. 2012;39(6):2972–2984. doi: 10.1118/1.4709607. [DOI] [PMC free article] [PubMed] [Google Scholar]
- 22.Qin X, Wu L, Jiang H, et al. Measuring body-cover vibration of vocal folds based on high frame rate ultrasonic imaging and high-speed video. IEEE Trans Biomed Eng. 2011;58(8) doi: 10.1109/TBME.2011.2157156. [DOI] [PubMed] [Google Scholar]
- 23.Tang S, Zhang Y, Qin X, et al. Measuring body layer vibration of vocal folds by high-frame-rate ultrasound synchronized with a modified electroglottograph. Journal of the Acoustical Society of America. 2013;134(1):528–538. doi: 10.1121/1.4807652. [DOI] [PubMed] [Google Scholar]
- 24.Wang H, Fei B. A modified fuzzy C-means classification method using a multiscale diffusion filtering scheme. Med Image Anal. 2009;13(2):193–202. doi: 10.1016/j.media.2008.06.014. [DOI] [PMC free article] [PubMed] [Google Scholar]
- 25.Yang X, Wu S, Sechopoulos I, et al. Cupping artifact correction and automated classification for high-resolution dedicated breast CT images. Med Phys. 2012;39(10):6397–406. doi: 10.1118/1.4754654. [DOI] [PMC free article] [PubMed] [Google Scholar]
- 26.Qin X, Cong Z, Fei B. Automatic segmentation of right ventricular ultrasound images using sparse matrix transform and level set. Physics in Medicine and Biology. 2013;58(21):7609–24. doi: 10.1088/0031-9155/58/21/7609. [DOI] [PMC free article] [PubMed] [Google Scholar]
- 27.Fei B, Schuster D, Master V, et al. Incorporating PET/CT Images Into 3D Ultrasound-Guided Biopsy of the Prostate. Medical Physics. 2012;39(6):3888–3888. [Google Scholar]
- 28.Qin X, Cong Z, Halig LV, et al. Automatic segmentation of right ventricle on ultrasound images using sparse matrix transform and level set. Proceedings of SPIE; 2013; 2013. pp. 86690Q–7. [DOI] [PMC free article] [PubMed] [Google Scholar]
- 29.Lu G, Halig LV, Wang D, et al. Spectral-spatial classification using tensor modeling for head and neck cancer detection of hyperspectral imaging. SPIE Medical Imaging 2014: Image processing. 2014;9034 doi: 10.1117/12.2043796. [DOI] [PMC free article] [PubMed] [Google Scholar]
- 30.Qin X, Wang S, Shen M, et al. Mapping cardiac fiber orientations from high resolution DTI to high frequency 3D ultrasound. SPIE Medical Imaging. 2014;2014:9036. doi: 10.1117/12.2043821. [DOI] [PMC free article] [PubMed] [Google Scholar]
- 31.Feng SSJ, Bliznakova K, Qin X, et al. Characterization of the Homogeneous Breast Tissue Mixture Approximation for Breast Image Dosimetry. Medical Physics. 2012;39(6):3878–3878. doi: 10.1118/1.4737025. [DOI] [PMC free article] [PubMed] [Google Scholar]
- 32.Fei B, Yang X, Nye JA, et al. MRPET quantification tools: Registration, segmentation, classification, and MR-based attenuation correction. Med Phys. 2012;39(10):6443–54. doi: 10.1118/1.4754796. [DOI] [PMC free article] [PubMed] [Google Scholar]
- 33.Fei B, Duerk JL, Wilson DL. Automatic 3D registration for interventional MRI-guided treatment of prostate cancer. Comput Aided Surg. 2002;7(5):257–67. doi: 10.1002/igs.10052. [DOI] [PubMed] [Google Scholar]
- 34.Fei B, Wheaton A, Lee Z, et al. Automatic MR volume registration and its evaluation for the pelvis and prostate. Phys Med Biol. 2002;47(5):823–38. doi: 10.1088/0031-9155/47/5/309. [DOI] [PubMed] [Google Scholar]
- 35.Fei B, Duerk JL, Boll DT, et al. Slice-to-volume registration and its potential application to interventional MRI-guided radio-frequency thermal ablation of prostate cancer. IEEE Trans Med Imaging. 2003;22(4):515–25. doi: 10.1109/TMI.2003.809078. [DOI] [PubMed] [Google Scholar]
- 36.Fei B, Kemper C, Wilson DL. A comparative study of warping and rigid body registration for the prostate and pelvic MR volumes. Comput Med Imaging Graph. 2003;27(4):267–81. doi: 10.1016/s0895-6111(02)00093-9. [DOI] [PubMed] [Google Scholar]
- 37.Fei B, Duerk JL, Sodee DB, et al. Semiautomatic nonrigid registration for the prostate and pelvic MR volumes. Acad Radiol. 2005;12(7):815–24. doi: 10.1016/j.acra.2005.03.063. [DOI] [PubMed] [Google Scholar]
- 38.Fei B, Wang H, Muzic RF, Jr, et al. Deformable and rigid registration of MRI and microPET images for photodynamic therapy of cancer in mice. Med Phys. 2006;33(3):753–60. doi: 10.1118/1.2163831. [DOI] [PubMed] [Google Scholar]
- 39.Lv G, Yan G, Wang Z. Bleeding detection in wireless capsule endoscopy images based on color invariants and spatial pyramids using support vector machines. IEEE EMBC. 2011;2011:6643–6646. doi: 10.1109/IEMBS.2011.6091638. [DOI] [PubMed] [Google Scholar]


