

Abstract
Plant and animals have evolved different strategies for their development. Whether this is linked to major differences in their cell mechanics remains unclear, mainly because measurements on plant and animal cells relied on independent experiments and setups, thus hindering any direct comparison. In this study we used the same micro-rheometer to compare animal and plant single cell rheology. We found that wall-less plant cells exhibit the same weak power law rheology as animal cells, with comparable values of elastic and loss moduli. Remarkably, microtubules primarily contributed to the rheological behavior of wall-less plant cells whereas rheology of animal cells was mainly dependent on the actin network. Thus, plant and animal cells evolved different molecular strategies to reach a comparable cytoplasmic mechanical core, suggesting that evolutionary convergence could include the internal biophysical properties of cells.
Introduction
Although morphogenesis has long been studied by biologists and physicists in two distinct research communities, the role of cell mechanics is being increasingly revisited in biology, thanks to new micromechanical developments and imaging technologies. Beyond the structural role of cell mechanics in shape changes, evidence also shows that mechanical signals, channeled by growth, in turn contribute to the robustness of animal and plant shapes (1–5). Thus, the analysis of the cell mechanical properties is becoming central to developmental biology.
The rheological properties of animal cells have been investigated in many studies (6–10). Among all living organisms, animal cells are unique in that they do not exhibit cell walls. They indeed rely on a cortical contractile cytoskeleton to control their mechanical properties and shapes (7–9,11–13). In contrast, the cells of most living organisms are surrounded by a rigid cell wall, from prokaryotes, to eukaryotes such as fungi and plants. Plant cells exhibit very stiff pecto-cellulosic walls, notably because of the presence of cellulose microfibrils, the stiffness of which compares to that of steel. Plant cells are usually under high turgor pressure notably during growth and when turgid, the plant cell shape is restricted by their wall. Several micromechanical and nano-indentation methods, coupled with modeling, have been developed to characterize the mechanical properties of plant cell walls (14–19). However, whereas the plant cytoskeleton—in particular the cortical microtubules—indirectly controls the structure and mechanical properties of the cell wall (20–22), its contribution to plant cell rheology remains unknown. Furthermore, when plant cells are plasmolyzed because of drought or osmotic stress, the protoplasts are detached from the wall. In this context, the cell wall cannot account for the protoplast shape stabilization and it is unknown whether the cytoskeleton could play a mechanical role in this context.
Because plant and animal cells share many cytoplasmic components, such as cytoskeletal proteins, the question arises of whether wall-less plant cells and animal cells have a similar mechanical behavior or not. However, studies on animal and plant cells have been conducted independently, on different setups, and focus on different features, thus hindering any comparative quantitative analysis between the two kingdoms. In this study we used a single cell uniaxial rheometer (7,23) to characterize the typical mechanical properties of a wall-less plant cell and compare it with that of an animal cell.
Materials and Methods
Callus initiation and maintenance
Arabidopsis thaliana (Col-0 accession) calli were prepared from 2-weeks-old seedlings grown in vitro under sterile conditions. Roots were collected, transferred to a petri dish containing liquid Murashig and Skoog (24) culture medium (1× MS + vitamin containing 30 g/L sucrose, 0.5 g/L MES, pH 5.7), chopped into thin sections of ∼ 1 mm in length, and then transferred onto solid callus induction medium (1× MS-vitamin, 30 g/L sucrose, 0.5 g/L MES, 0.5 mg/L 2,4-D, 2 mg/L IAA, 0.5 mg/L cytokinin [6-(y,y-Dimethylallyamino) purine Riboside], 7g/L plant agar, pH 5.7) at 25°C. The calli were then transferred to a new medium every 2 weeks. Before measurement, calli were transferred to liquid MS culture medium (without agar) and maintained at 25°C in a dark incubator at 40 rpm. Cells from 9-days-old culture were isolated and used for measurements.
Protoplasts preparation
Protoplasts were obtained by a combination of cell wall degradation and hypo-osmotic shock. Calli in liquid medium were collected by pipetting and then filtered to obtain a volume of packed cells of 0.2 mL. Packed cells were gently mixed, in a 2 mL eppendorf tube, with 1.1 mL of enzyme solution containing 2 mM CaCl2, 2mM MgCl2, 10mM MES, 1 mM L-ascorbic acid, pH 5.5 with KOH, 17 mg/mL Cellulysin (Calbiochem, La Jolla, CA), 17 mg/mL Cellulase RS (Yakult, Co. Ltd., Tokyo, Japan), 0.4 mg/mL Pectolyase Y-23 (Seishin Pharmaceutical Co. Ltd., Nihombashi, Japan), 3.5 mg/mL Bovine Serum Albumin (Sigma, St. Louis, MO), and 600 mOsm with mannitol, sterilized by filtration. Cells were then incubated for 15 min with linear shaking (40 rpm) at 21°C. After 3 min spinning at 800 rpm, the supernatant was discarded and cells were resuspended (5 min shaking) in washing medium (2 mM CaCl2, 2 mM MgCl2, 10 mM MES, pH 5.5 with KOH, 600 mOsm with mannitol). Cells were pelleted again (3 min 800 rpm), the supernatant was removed and 1 mL of hypoosmotic medium (same as washing medium, osmolariry 280 mOsm with mannitol) was added to release protoplasts. After 10 min of gentle shacking (30 rpm), protoplasts were sorted from aggregates by filtration on a 300 μm mesh. Rheological measurements on protoplasts were performed around 5 min after cell wall removal and for no more than 4 h to keep the protoplast wall-less (synthesis of a new cell wall generally takes 24 h after cell wall removal (25,26)).
C2-7 culture and preparation
The C2-7 myogenic cell line is a subclone of the C2 line derived from the skeletal muscle of adult CH3 mice. They were grown in 25-cm2 culture flasks using Dulbecco′s modified eagle′s medium (DMEM) supplemented with 10% heat-inactivated fetal calf serum, 2 mM glutamin, 50 units/mL penicillin, and 50 μg/mL streptomycin and until confluence reached 50%. All cultures were maintained at 37°C under humidified 5% CO2 atmosphere. Cells at 50% confluence were trypsinized, centrifuged at 140 × g for 3 min, resuspended in DMEM supplemented with 15 mM HEPES, and then used for mechanical tests.
Drug treatments
Protoplasts and C2-7 cells were treated with 2 μM cytochalasin D (Sigma-Aldrich) for 30 min to depolymerize actin microfilaments (27,28) and then used for rheological experiments. Protoplasts were treated with 20 μM oryzalin (Sigma-Aldrich) for 30 min to depolymerize microtubules and then used for rheological tests. Oryzalin is thought to sequester the dimer of plant tubulin at the plus end, and because depolymerization happens at the minus end, this leads to progressive elimination of microtubules (29). C2-7 cells were treated with 5 μM nocodazole (Sigma-Aldrich) for 30 min to depolymerize microtubules and they were then used for rheological tests (30–34). All drugs were dissolved in dimethyl sulfoxide (DMSO) and the final concentration of DMSO was 0.02% for experiments.
Medium osmolarity measurement
Osmolarity of the different medium were measured using an osmometer (micro-osmometer type 6, Löser, Berlin, Germany). The mechanical behavior of a single plant cell was measured in a liquid culture medium at 180 mOsm/L. The osmolarity of the medium used for protoplasts measurement was 280 and 300 mOsm/L for C2-7 cells measurements.
Complex modulus measurement
To measure the mechanical properties of isolated Arabidopsis single cells, we used a uniaxial rheometer that we previously developed to characterize animal cells (7,23). More precisely, we measured the storage (G': elastic properties) and loss (G'': dissipative, viscous-like features) moduli at the whole cell scale by performing dynamical oscillations tests in the range of 0.05 to 6.4 Hz. The complex modulus thus quantitatively describes the way the cell deforms and flows when it is subjected to a calibrated compressive oscillating stress. The cell mechanical behavior as function of the frequency can thus be represented by G'(f) and G''(f); or, alternatively, by the overall viscoelastic modulus and the loss tangent tanδ(f) = G''(f)/G'(f) representing the relative contributions of dissipative (viscous-like) and elastic behaviors. The latter was shown to be convenient for the analysis of animal cell rheology, the signature of which is a weak power law of the frequency with a constant ratio between G'' and G', tanδ(f) = tan(απ/2), at low frequencies (6,8,9,35). In that case, the characteristic moduli at the reference frequency f0 = 1Hz express as G0' = G0 cos(απ/2) and G0' = G0 sin(απ/2) and can thus be deduced from the power law fit of |G∗|(f), i.e., from the values of G0 and α.
In practice, a single cell was captured between two custom-made glass microplates under a bright-field microscope (Fig. 1 A). One microplate is stiff compared with the cell and the other one is flexible with a calibrated stiffness k (1-10000 nN/μm). A sinusoidal displacement D(t) = D0 sin(ωt), with ω = 2πf, was imposed to the basis of the flexible microplate, leading thus to a sinusoidal compressive stress applied on the cell. To determine the cell deformation, the displacement d(t) = d0 sin(ωt+ϕ) of the tip of the flexible microplate, with ϕ the phase shift between d(t) and D(t), was measured through a S3979 position-sensitive detector (resolution ∼ 200 nm). The instantaneous stress applied to the cell is given by σ(t) = k[D(t)-d(t)]/A, where A is the cell-plates mean contact area, while the strain expresses as ε(t) = d(t)/L0, where L0 is the cell length perpendicular to the plates. Fig. 1 B shows typical D(t) and d(t) signals measured at 1.6 Hz, and Fig. 1 C details the procedure for the contact area estimation. Both D(t) and d(t) signals were well fitted by a sinus function. The storage and loss moduli were then given by and (see (23) for details). The process was repeated for different frequencies on the same cell to assess the storage and loss moduli of the cell as functions of the frequency. All results presented were performed for strains < 4.5% to avoid nonlinear response because of too large strains. Compared with other techniques previously used to analyze plant cell mechanics, the parallel plates method allows us to measure a broad range of values of stiffness (unlike aspiration), and it provides an integrated cell-scale measurement of cell mechanics (unlike nano-indentation). Cells between the microplates were visualized under bright light illumination with a Plan Fluotar L 63×/0.70 objective and a Micromax digital CCD camera (Princeton Instruments, Roper Scientific, Trenton, NJ). The setup, enclosed in a Plexiglas box, was maintained at 25 ± 1°C for plant protoplasts, or 37 ± 1°C for C2-7 animal cells, by an Air-Therm heater controller (World Precision Instruments, Sarasota, FL). Vibration isolation was achieved by a TS-150 active antivibration table (HWL Scientific Instruments, Tübingen, Germany).
Figure 1.
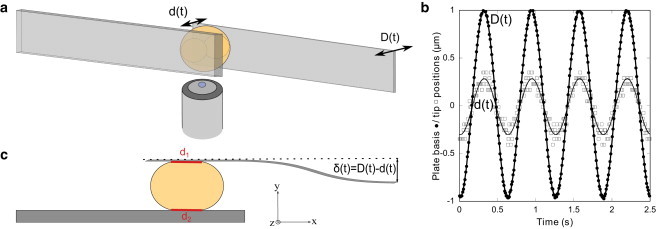
Principle of single cell complex modulus measurement. (A) A single cell is trapped between two parallel microplates. One microplate is stiff whereas the other is flexible with a calibrated stiffness k. An oscillating displacement D(t) is applied at the basis of the flexible microplate and the resulting displacement d(t) at the tip of this microplate is recorded. (B) Recorded signals for an Arabidopsis protoplast submitted to an oscillating stress at 1.6 Hz. Black circles correspond to the basis displacement D of the flexible microplate. Open squares correspond to the resulting tip displacement d of the flexible microplate. Signals are well fitted by sinus functions. (C) Estimation of the contact area. The force applied to the cell is F(t) = kδ(t), with k the stiffness of the flexible microplate and δ(t) = D(t)-d(t) its instantaneous deflection. The stress was defined as , where A is the mean contact area between the cell and the plates. Plant protoplasts and animal cells were spherical in shape. As we could not directly measure the contact areas between the cell and the plates, we assumed they were disk-shaped, with diams. d1 and d2 given by the apparent contact lines between the cell and each of the glass plates measured from video-microscopy pictures. Thus, the contact areas were given by , and the mean contact area . To see this figure in color, go online.
Microplates surface treatment
Plant protoplasts tend to slide between the microplates during the complex modulus measurement. Thus, the microplates were coated with 0.01% Poly-L-Lysin (Sigma 70 000-150 000Da) during 30 min before the experiments. For experiments on C2-7 animal cells, the microplates were not coated to avoid, as much as possible, spreading and contractile activity of these myoblasts cells (36,37).
Real time monitoring of the volume and complex modulus of protoplasts
First, protoplasts were suspended in 4 mL of the control medium. At time t = 0 min, 0.8 mL of oryzalin at 30 μM were added to reach a final concentration of 20 μM. Then a cell was rapidly captured between the microplates and a first measurement of the complex modulus was performed, generally at t = 2 min or less. We then performed additional complex modulus measurements on the same cell at t =15 and 30 min. The volumes of the protoplasts were measured via ImageJ. Video microscopy images of the protoplasts were fitted with discoid (region of interest) ROIs. The areas of the ROI were then used to calculate the radius and the volume of each protoplast assuming they have spherical shapes. We repeated this procedure on images at different times (2, 15, and 30 min) after drug treatment. Thus we assessed the time evolutions of the volume of protoplasts as well as its complex modulus.
Results and Discussion
Building on our previous work on animal cells, we used a single cell uniaxial rheometer (Fig. 1 A) (7,23) to measure the complex modulus of an isolated plant cell with no wall (protoplast) and compared it with that of an animal cell. Briefly, a cell is captured between two parallel microplates, one of which is rigid, and the other one is flexible, with a calibrated stiffness. The flexible plate serves as a force sensor and allows applying forces in a range of 1 nN to 1 mN. Here, cells were submitted to oscillating compressive forces, allowing thus to assess their storage (G': elastic properties) and loss moduli (G'': dissipative or viscous features) in the frequency range 0.05 to 6.4 Hz, (see Materials and Methods). In the parallel-plates geometry, the cells are globally deformed, so the moduli measured reflect the effective mechanical response at the whole cell scale.
A wall-less plant cell displays similar mechanical properties as an animal single cell
Typical elastic and loss moduli measured for an isolated Arabidopsis protoplast are presented in Fig. 2 A. From these values of G' and G'' we could also represent the viscoelastic modulus and the loss tangent tanδ(f) = G''(f)/G'(f), which quantifies the relative contributions of dissipation (viscous-like behavior) and elasticity (Fig. 2 C). |G∗| was found to be a weak power law of the frequency, |G∗|(f) = G0 (f/f0)α, whereas tanδ was almost constant in the investigated frequency range (Fig. 2 C). These are features of a complex mechanical behavior with a broad range of characteristic time scales, qualitatively similar to what has been usually reported for animal cells (6,10,38–41), and to the response of C2.7 animal cells tested again with the same setup (Fig. 2 D). In the following, to quantify the viscoelastic behavior of plant protoplasts, we focused on the characteristic values of G' and G'' at the reference frequency f0 = 1 Hz, G0' = G0 cos(απ/2) and G0' = G0 sin(απ/2), deduced from a power law fit of |G∗|, |G∗|(f) = G0 (f/f0)α (solid lines in Fig. 2 C and D).
Figure 2.
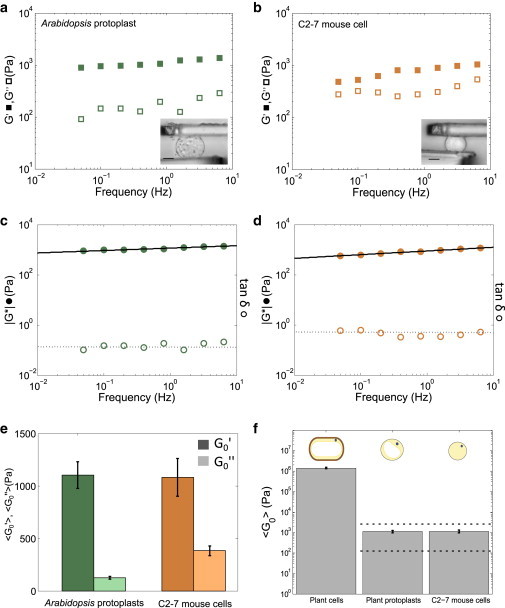
Comparison of the mechanical behaviors of Arabidopsis protoplasts and C2-7 animal cells. (A) Elastic (solid squares) and loss (open squares) moduli of a representative Arabidopsis protoplast. Inset: picture of a protoplast between the two microplates; bar 9 = μm. (B) Elastic (solid squares) and loss (open squares) moduli of a representative C2-7 cell. Inset: picture of a C2-7 cell between the two microplates; bar = 9 μm. (C) Viscoelastic modulus (solid circles) and loss tangent (open circles) of a representative Arabidopsis protoplast. Solid line represents a power law fit of the viscoelastic modulus. (D) Viscoelastic modulus (solid circles) and loss tangent (open circles) of a representative C2-7 cell. (E) Diagram comparing the mean of elastic (dark color) and loss moduli (light color) of Arabidopsis protoplasts (green, n = 29) and of C2-7 mouse cells (orange, n = 7). Error bars are standard errors of the mean. (F) Comparison of the effective rigidities G0 found for individual Arabidopsis cells with wall (n = 38), Arabidopsis protoplasts (n = 29), and C2-7 animal cells (n = 7). Dotted lines represent the range of G0 reported for animal cells (8). The upper part of the panel represents schematic drawings of the cells in each case. Error bars are standard errors of the mean. To see this figure in color, go online.
The mean values of the elastic and loss moduli of plant protoplasts at 1 Hz are presented in Fig. 2 E. We found G0' = 1100 ± 125 Pa and G0'' = 125 ± 13 Pa (n = 29 protoplasts, see the distributions in Fig. S1 in the Supporting Material). This shows that protoplasts are three orders of magnitude softer than plant cells with wall (Fig. S2). To compare the rheological behavior of protoplasts with animal cells, we measured the complex modulus of C2-7 mouse myoblasts. Typical elastic and loss moduli of C2-7 cells are reported in Fig. 2 B, while the viscoelastic modulus and loss tangent are shown in Fig. 2 D. We found an elastic modulus G0' of 1080 ± 180 Pa and a loss modulus G0'' of 380 ± 45 Pa for C2-7 cells (Fig. 2 C; n = 7 cells, see the distributions Fig. S1). These values are surprisingly close to those found for plant protoplasts, suggesting that plant protoplasts behave rheologically as animal cells.
To further compare the rheology of plant protoplasts with that of animal cells, we next focused on the characteristic viscoelastic modulus of both cell types at 1Hz (Fig. 2 F) as well as on the ratio G0''/G0' representing the relative contributions of dissipative (viscous-like) and elastic behaviors. For C2-7 cells, we found an effective rigidity G0 of ∼ 1150 Pa and a ratio G0''/G0' of around 0.35. These results are in agreement with the viscoelastic behavior reported for various animal cell types and with different techniques (8,9,35): G0 is typically in the range of 100 to 2000 Pa (G0 extrema found in literature for animal cells are notified with dotted lines in Fig. 2 F) and the ratio G0''/G0' of 0.2 to 0.5. For plant protoplasts, G0 is ∼ 1100 Pa, and it is noteworthy that the difference in overall effective rigidity between plant protoplasts and C2-7 cells was much smaller than the difference between protoplasts and plant cells with their wall (Fig. 2 F). Nevertheless, for plant protoplasts, we found a ratio G0''/G0' of around 0.11, which suggests a more solid-like behavior for plant protoplasts than for animal cells. Indeed, this difference can be directly observed on the frequency dependence of the viscoelastic modulus (weak power laws of Fig. 2 C and d). The exponent of the power law (slope of |G∗|(f)) reflects the balance between viscous- and elastic-like behavior (α = 0 purely elastic solid, α = 1 viscous liquid). For the plant protoplasts the power law exponent was found around 0.08 whereas it was around 0.24 for C2-7 animal cells.
The difference in the relative contributions of viscous and elastic components might reflect that different molecular determinants are involved in the mechanical behavior of plant protoplasts and animal cells. Indeed, the similar modulus values we found for plant protoplasts and animal cells were unexpected since the cortex of both cell types is quite different. In animal cells, cell rheology mainly relies on a dense network of cortical actin. Microtubules are much more scattered in animal cells and are instead mainly involved in intracellular vesicle trafficking during interphase (39,42,43). Conversely, plant cells display a dense network of cortical microtubule that has notably been involved in cell wall synthesis (20,44). The actin cytoskeleton in plant cells is mostly found within more central regions of the cytoplasm, notably within cytoplasmic strands. Nevertheless, actin cytoskeleton in living tobacco protoplasts can be located near the plasma membrane (45). Thus it is unclear which cytoskeletal network contributes to protoplast rheology. Therefore, we investigated whether the similar rheology of plant protoplasts and animal cells could be uncoupled by dissecting the contribution of the cytoskeleton in these two contexts.
Wall-less plant cell mechanics primarily depends on microtubules, in contrast to animal cells
First, we determined the complex moduli of plant protoplasts after treatments with cytoskeletal-destabilizing drugs. Fig. 3 A compares the typical complex moduli either measured on untreated protoplasts, or on protoplasts treated for 30 min with 2 μM cytochalasin D or 20 μM oryzalin. Cytochalasin D, which promotes actin filaments depolymerization, had no significant effect on the mechanical response of plant protoplasts. In contrast, the depolymerization of microtubules with oryzalin led to a significant decrease of the effective rigidity of protoplasts. The mean values of the elastic and of the loss moduli measured on protoplasts treated with cytoskeletal drugs are shown in Fig. 3 B. Our results demonstrate that the elastic modulus of plant protoplasts is divided by two when microtubules are depolymerized, whereas the alteration of the actin network has no significant effect (G0' = 450 ± 80 Pa for protoplasts treated with oryzalin, n = 11, whereas G0' = 1100 ± 270 Pa for protoplasts treated with cytochalasin D, n = 13; distributions in Fig. S3). We first confirmed that the final concentration of the solvent DMSO used in the experiments (0.02%) had no significant effect on the elastic and loss moduli of plant protoplasts (Fig. S4). Then, we checked the presence of cortical microtubules in these conditions using protoplasts from the p35S::GFP-MBD lines (4) (Fig. S5). We also confirmed that microtubules were depolymerized after oryzalin treatment (Fig. S5). Our data suggest that, in contrast to animal cells, cortical microtubules are the main contributors of plant protoplast rheology. It is well known that the rheology of animal cells mainly depends on actin and myosin activity (6,10,38–41,43,46). Consistently, we found that the elastic modulus of C2-7 animal cells was divided by five when cells were treated with 2 μM of cytochalasin D for 30 min (see Fig. S6). In contrast, for C2-7 cells treated with the microtubule depolymerizing agent nocodazole, no significant difference were found when compared with the control condition (Fig. S6). Altogether these results demonstrate that a similar rheological behavior is achieved through different cytoskeletal networks in plant and animal.
Figure 3.
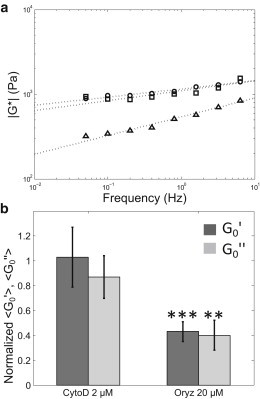
Depolymerizing microtubules decreases the rigidity of Arabidopsis protoplasts. (A) Typical viscoeleastic moduli () measured for an untreated protoplast (circles), a protoplast treated with 2 μM of cytochalasin D (squares), and a protoplast treated with 20 μM of oryzalin (triangles). Dotted lines represent power law fits of the data. (B) Diagram comparing the effects of 2 μM of actin depolymerizing drug cytochalasin D (left, n = 13) and 20 μM of microtubule depolymerizing drug oryzalin (right, n = 11) on the values of the elastic (dark gray) and loss (light gray) moduli of protoplasts. The mean values of elastic and loss moduli of treated cells are respectively normalized by the mean value of elastic and loss moduli measured for untreated cells. Error bars are normalized standard errors of the mean, ∗P value < 0.05, ∗∗P < 0.01, ∗∗∗P < 0.001, Student’s t-test.
Importantly, the external osmolarity of plant protoplasts and animal cells media during the measurements were roughly similar (280 mOsm/L for protoplasts and 300 mOsm/L for C2-7 cells; see Materials and Methods) and both cell types were spherical in shape. According to the Laplace law, the spherical shape indicates that each cell type is under pressure and that a surface tension balances the pressure difference between inside and outside the cell. Indeed, it has been demonstrated that in animal cells, the plasma membrane alone cannot bear such a pressure difference, this pressure is more likely balanced by the tension generated by the acto-myosin cortex, which also controls the cell mechanical properties (47,48). Our result with oryzalin strongly suggests that the rigidity of protoplasts is in contrast mainly controlled by microtubules. If true, we reasoned that osmotic pressure in plant protoplasts should be balanced by the microtubules cortex stiffness. Although the microtubule cortex is not contractile, the flexural rigidity of microtubules is indeed about three orders of magnitude higher than that of actin microfilaments (49). To test this hypothesis, we measured the time evolutions of the volume and the complex modulus of individual plant protoplasts after addition of oryzalin (Fig. 4 A and B; distributions in Fig. S7 and S8). As the overall effective rigidity decreased, the volume slightly increased of around 5%, suggesting that microtubules could indeed resist osmotic pressure. When plant cell are plasmolyzed, the protoplast is detached from the wall. The wall cannot be responsible for the plant cell shape in this context. Our results suggest that the microtubule cortex mechanically contributes to stabilize the shape of the plant protoplast.
Figure 4.
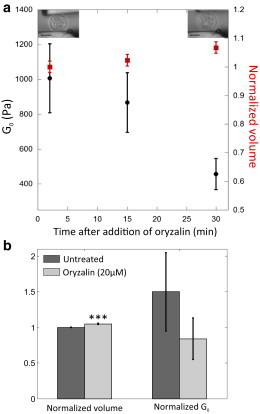
Dynamics of the volume and overall effective rigidity of individual plant protoplasts after oryzalin addition. (A) Evolutions of the overall effective rigidity (black circles) and volume (red squares, the volume is normalized by its value at t = 2 min) of an individual protoplast after addition of 20 μM of microtubule depolymeryzing agent oryzalin. Error bars represent the estimated uncertainties of measurements. Pictures show a protoplast before oryzalin treatment on the left and 30 min after treatment on the right; scale bar = 10 μm. (B) Diagram representing the mean values of the normalized volume (for each cell tested, the volume at t = 30 min is divided by the volume at t = 2 min) and the normalized overall effective rigidity (for each cell tested, G0 at t = 30 min is divided by G0 at t = 2 min) for untreated protoplasts (dark gray, n = 10) and protoplasts treated with 20 μM of oryzalin (light gray, n = 10). Error bars are standard errors of the mean. ∗∗∗P < 0.001, Student’s t-test. To see this figure in color, go online.
To conclude, our results suggest that plant cells and animal cells have developed different strategies to converge to the same intracellular mechanical behavior. Interestingly, although the overall rigidity of animal cells is not significantly different from that of plant protoplasts, the slightly more dissipative behavior of animal cells (more important viscous-like component with G0''/G0' ∼ 0.35 vs. G0''/G0' ∼ 0.11 in protoplasts) may relate to the involvement of different cytoskeletal networks in the two kingdoms. In particular, the actin cortex associated with myosin motors in animal cells is likely to exhibit a slightly more viscous-like dissipation than the microtubule network at the plant cell cortex (41). Interestingly it was found that in vitro gels of actin exhibit more liquid-like behavior in the presence of active myosin motors (50). More importantly, the ratio G0''/G0' is around 0.6 for in vitro actin gels (51), whereas it reaches only 0.25 for microtubule networks (52). These lower value of G0''/G0' for microtubule networks as compared with actin gels in vitro is in line with our results on single plant and animal cells. This observation supports what we found with drug treatment, namely that the microtubules are the main determinants for plant protoplasts rheology, whereas animal cell mechanics depend mainly on actin. Note, however, that in both kingdoms, the overall rheology of the cell is dominated by its elastic modulus, which is roughly the same in both plant and animal cells.
In this context, it is also noteworthy that plant cells and plant protoplasts display large vacuoles, in comparison with animal cells. Actually, in turgor conditions, the cytoplasm of differentiated plant cells is compressed by the vacuole against the cell wall, probably leading to increased viscosity and jamming (53). Future investigations should test whether or not this confinement of the cytoplasm could explain why many mechanical processes usually controlled by actin in animal cells are microtubule-dependent in plants (54). For instance, it has now been established that microtubules serve as tracks for the cellulose synthase (20) and can dynamically reorient plant cell growth directions, via their impact on the mechanical anisotropy of the wall (22). Because of their higher persistence length, microtubules might be more effective than actin filaments to establish pattern and to reorient in a highly confined and crowded environment.
Acknowledgments
We would like to thank Alexis Peaucelle, Sylvie Hénon, Sophie Asnacios, Jean-Pierre Henry, and Elisabeth Charrier for fruitful discussions and help with experiments. This work was supported by funding from the French “Agence Nationale de Recherche” (ANR-09-BLAN-0006 to M. B.; ANR-10-BLAN-1516 “Mechastem” to O. H., ANR-12-BSV5-0007-01 “ImmunoMeca” to A.A.). A.A., A.B., and O.H. are members of the “groupe de recherche GDR 3070: Physique de la Cellule au Tissu”.
Supporting Material
References
- 1.Desprat N., Supatto W., Farge E. Tissue deformation modulates twist expression to determine anterior midgut differentiation in Drosophila embryos. Dev. Cell. 2008;15:470–477. doi: 10.1016/j.devcel.2008.07.009. [DOI] [PubMed] [Google Scholar]
- 2.Farge E. Mechanical induction of Twist in the Drosophila foregut/stomodeal primordium. Curr. Biol. 2003;13:1365–1377. doi: 10.1016/s0960-9822(03)00576-1. [DOI] [PubMed] [Google Scholar]
- 3.Engler A.J., Sen S., Discher D.E. Matrix elasticity directs stem cell lineage specification. Cell. 2006;126:677–689. doi: 10.1016/j.cell.2006.06.044. [DOI] [PubMed] [Google Scholar]
- 4.Hamant O., Heisler M.G., Traas J. Developmental patterning by mechanical signals in Arabidopsis. Science. 2008;322:1650–1655. doi: 10.1126/science.1165594. [DOI] [PubMed] [Google Scholar]
- 5.Lecuit T., Lenne P.-F. Cell surface mechanics and the control of cell shape, tissue patterns and morphogenesis. Nat. Rev. Mol. Cell Biol. 2007;8:633–644. doi: 10.1038/nrm2222. [DOI] [PubMed] [Google Scholar]
- 6.Fabry B., Maksym G.N., Fredberg J.J. Time scale and other invariants of integrative mechanical behavior in living cells. Phys. Rev. E Stat. Nonlin. Soft Matter Phys. 2003;68:041914. doi: 10.1103/PhysRevE.68.041914. [DOI] [PubMed] [Google Scholar]
- 7.Desprat N., Richert A., Asnacios A. Creep function of a single living cell. Biophys. J. 2005;88:2224–2233. doi: 10.1529/biophysj.104.050278. [DOI] [PMC free article] [PubMed] [Google Scholar]
- 8.Balland M., Desprat N., Gallet F. Power laws in microrheology experiments on living cells: Comparative analysis and modeling. Phys. Rev. E Stat. Nonlin. Soft Matter Phys. 2006;74:021911. doi: 10.1103/PhysRevE.74.021911. [DOI] [PubMed] [Google Scholar]
- 9.Fabry B., Maksym G.N., Fredberg J.J. Scaling the microrheology of living cells. Phys. Rev. Lett. 2001;87:148102. doi: 10.1103/PhysRevLett.87.148102. [DOI] [PubMed] [Google Scholar]
- 10.Stamenovic D., Suki B., Fredberg J.J. Rheology of airway smooth muscle cells is associated with cytoskeletal contractile stress. J. Appl. Physiol. 2004;96:1600–1605. doi: 10.1152/japplphysiol.00595.2003. [DOI] [PubMed] [Google Scholar]
- 11.Smith B.A., Tolloczko B., Grütter P. Probing the viscoelastic behavior of cultured airway smooth muscle cells with atomic force microscopy: stiffening induced by contractile agonist. Biophys. J. 2005;88:2994–3007. doi: 10.1529/biophysj.104.046649. [DOI] [PMC free article] [PubMed] [Google Scholar]
- 12.Hoffman B.D., Massiera G., Crocker J.C. The consensus mechanics of cultured mammalian cells. Proc. Natl. Acad. Sci. USA. 2006;103:10259–10264. doi: 10.1073/pnas.0510348103. [DOI] [PMC free article] [PubMed] [Google Scholar]
- 13.Pullarkat P.A., Fernandez P.A., Ott A. Rheological properties of the Eukaryotic cell cytoskeleton. Phys. Rep. 2007;449:29–53. [Google Scholar]
- 14.Blewett J., Burrows K., Thomas C. A micromanipulation method to measure the mechanical properties of single tomato suspension cells. Biotechnol. Lett. 2000;22:1877–1883. [Google Scholar]
- 15.Wang C.X., Wang L., Thomas C.R. Modelling the mechanical properties of single suspension-cultured tomato cells. Ann. Bot. (Lond.) 2004;93:443–453. doi: 10.1093/aob/mch062. [DOI] [PMC free article] [PubMed] [Google Scholar]
- 16.Hayot C.M., Forouzesh E., Turner J.A. Viscoelastic properties of cell walls of single living plant cells determined by dynamic nanoindentation. J. Exp. Bot. 2012;63:2525–2540. doi: 10.1093/jxb/err428. [DOI] [PMC free article] [PubMed] [Google Scholar]
- 17.Peaucelle A., Braybrook S.A., Höfte H. Pectin-induced changes in cell wall mechanics underlie organ initiation in Arabidopsis. Curr. Biol. 2011;21:1720–1726. doi: 10.1016/j.cub.2011.08.057. [DOI] [PubMed] [Google Scholar]
- 18.Milani P., Gholamirad M., Hamant O. In vivo analysis of local wall stiffness at the shoot apical meristem in Arabidopsis using atomic force microscopy. Plant J. 2011;67:1116–1123. doi: 10.1111/j.1365-313X.2011.04649.x. [DOI] [PubMed] [Google Scholar]
- 19.Radotić K., Roduit C., Kasas S. Atomic force microscopy stiffness tomography on living Arabidopsis thaliana cells reveals the mechanical properties of surface and deep cell-wall layers during growth. Biophys. J. 2012;103:386–394. doi: 10.1016/j.bpj.2012.06.046. [DOI] [PMC free article] [PubMed] [Google Scholar]
- 20.Paredez A.R., Somerville C.R., Ehrhardt D.W. Visualization of cellulose synthase demonstrates functional association with microtubules. Science. 2006;312:1491–1495. doi: 10.1126/science.1126551. [DOI] [PubMed] [Google Scholar]
- 21.Baskin T.I. On the alignment of cellulose microfibrils by cortical microtubules: a review and a model. Protoplasma. 2001;215:150–171. doi: 10.1007/BF01280311. [DOI] [PubMed] [Google Scholar]
- 22.Baskin T.I., Meekes H.T., Sharp R.E. Regulation of growth anisotropy in well-watered and water-stressed maize roots. II. Role Of cortical microtubules and cellulose microfibrils. Plant Physiol. 1999;119:681–692. doi: 10.1104/pp.119.2.681. [DOI] [PMC free article] [PubMed] [Google Scholar]
- 23.Desprat N., Guiroy A., Asnacios A. Microplates-based rheometer for a single living cell. Rev. Sci. Instrum. 2006;77:055111. [Google Scholar]
- 24.Murashige T., Skoog F. A revised medium for rapid growth and bio assays with tobacco tissue cultures. Physiol. Plant. 1962;15:473–497. [Google Scholar]
- 25.Nagata T., Takebe I. Cell wall regeneration and cell division in isolated tobacco mesophyll protoplasts. Planta. 1970;92:301–308. doi: 10.1007/BF00385097. [DOI] [PubMed] [Google Scholar]
- 26.Cuddihy A.E., Bottino P.J. Winged-bean protoplasts: isolation and culture to callus. Plant Cell Tissue Organ Cult. 1982;209:201–209. [Google Scholar]
- 27.Wakatsuki T., Schwab B., Elson E.L. Effects of cytochalasin D and latrunculin B on mechanical properties of cells. J. Cell Sci. 2001;114:1025–1036. doi: 10.1242/jcs.114.5.1025. [DOI] [PubMed] [Google Scholar]
- 28.Ketelaar T., de Ruijter N.C.A., Emons A.M.C. Unstable F-actin specifies the area and microtubule direction of cell expansion in Arabidopsis root hairs. Plant Cell. 2003;15:285–292. doi: 10.1105/tpc.007039. [DOI] [PMC free article] [PubMed] [Google Scholar]
- 29.Morejohn L.C., Bureau T.E., Fosket D.E. Oryzalin, a dinitroaniline herbicide, binds to plant tubulin and inhibits microtubule polymerization in vitro. Planta. 1987;172:252–264. doi: 10.1007/BF00394595. [DOI] [PubMed] [Google Scholar]
- 30.Danowski B.A. Fibroblast contractility and actin organization are stimulated by microtubule inhibitors. J. Cell Sci. 1989;93:255–266. doi: 10.1242/jcs.93.2.255. [DOI] [PubMed] [Google Scholar]
- 31.Moeendarbary E., Valon L., Charras G.T. The cytoplasm of living cells behaves as a poroelastic material. Nat. Mater. 2013;12:253–261. doi: 10.1038/nmat3517. [DOI] [PMC free article] [PubMed] [Google Scholar]
- 32.Titushkin I., Cho M. Modulation of cellular mechanics during osteogenic differentiation of human mesenchymal stem cells. Biophys. J. 2007;93:3693–3702. doi: 10.1529/biophysj.107.107797. [DOI] [PMC free article] [PubMed] [Google Scholar]
- 33.Takai E., Costa K.D., Guo X.E. Osteoblast elastic modulus measured by atomic force microscopy is substrate dependent. Ann. Biomed. Eng. 2005;33:963–971. doi: 10.1007/s10439-005-3555-3. [DOI] [PubMed] [Google Scholar]
- 34.Fernández P., Pullarkat P.A., Ott A. A master relation defines the nonlinear viscoelasticity of single fibroblasts. Biophys. J. 2006;90:3796–3805. doi: 10.1529/biophysj.105.072215. [DOI] [PMC free article] [PubMed] [Google Scholar]
- 35.Alcaraz J., Buscemi L., Navajas D. Microrheology of human lung epithelial cells measured by atomic force microscopy. Biophys. J. 2003;84:2071–2079. doi: 10.1016/S0006-3495(03)75014-0. [DOI] [PMC free article] [PubMed] [Google Scholar]
- 36.Mitrossilis D., Fouchard J., Asnacios A. Single-cell response to stiffness exhibits muscle-like behavior. Proc. Natl. Acad. Sci. USA. 2009;106:18243–18248. doi: 10.1073/pnas.0903994106. [DOI] [PMC free article] [PubMed] [Google Scholar]
- 37.Fouchard J., Bimbard C., Asnacios A. Three-dimensional cell-body shape dictates the onset of traction force generation and growth of focal adhesions. Proc. Natl. Acad. Sci. USA. 2014;111:13075–13080. doi: 10.1073/pnas.1411785111. [DOI] [PMC free article] [PubMed] [Google Scholar]
- 38.Roca-Cusachs P., Almendros I., Navajas D. Rheology of passive and adhesion-activated neutrophils probed by atomic force microscopy. Biophys. J. 2006;91:3508–3518. doi: 10.1529/biophysj.106.088831. [DOI] [PMC free article] [PubMed] [Google Scholar]
- 39.Stamenović D., Liang Z., Wang N. Effect of the cytoskeletal prestress on the mechanical impedance of cultured airway smooth muscle cells. J. Appl. Physiol. 2002;92:1443–1450. doi: 10.1152/japplphysiol.00782.2001. [DOI] [PubMed] [Google Scholar]
- 40.Kollmannsberger P., Mierke C.T., Fabry B. Nonlinear viscoelasticity of adherent cells is controlled by cytoskeletal tension. Soft Matter. 2011;7:3127–3132. [Google Scholar]
- 41.Balland M., Richert A., Gallet F. The dissipative contribution of myosin II in the cytoskeleton dynamics of myoblasts. Eur. Biophys. J. 2005;34:255–261. doi: 10.1007/s00249-004-0447-7. [DOI] [PubMed] [Google Scholar]
- 42.Vignaud T., Blanchoin L., Théry M. Directed cytoskeleton self-organization. Trends Cell Biol. 2012;22:671–682. doi: 10.1016/j.tcb.2012.08.012. [DOI] [PubMed] [Google Scholar]
- 43.Zhou E.H., Quek S.T., Lim C.T. Power-law rheology analysis of cells undergoing micropipette aspiration. Biomech. Model. Mechanobiol. 2010;9:563–572. doi: 10.1007/s10237-010-0197-7. [DOI] [PubMed] [Google Scholar]
- 44.Crowell E.F., Bischoff V., Vernhettes S. Pausing of Golgi bodies on microtubules regulates secretion of cellulose synthase complexes in Arabidopsis. Plant Cell. 2009;21:1141–1154. doi: 10.1105/tpc.108.065334. [DOI] [PMC free article] [PubMed] [Google Scholar]
- 45.Hohenberger P., Eing C., Nick P. Plant actin controls membrane permeability. Biochim. Biophys. Acta. 2011;1808:2304–2312. doi: 10.1016/j.bbamem.2011.05.019. [DOI] [PubMed] [Google Scholar]
- 46.Lim C.T., Zhou E.H., Quek S.T. Mechanical models for living cells—a review. J. Biomech. 2006;39:195–216. doi: 10.1016/j.jbiomech.2004.12.008. [DOI] [PubMed] [Google Scholar]
- 47.Stewart M.P., Helenius J., Hyman A.A. Hydrostatic pressure and the actomyosin cortex drive mitotic cell rounding. Nature. 2011;469:226–230. doi: 10.1038/nature09642. [DOI] [PubMed] [Google Scholar]
- 48.Tinevez J.-Y., Schulze U., Paluch E. Role of cortical tension in bleb growth. Proc. Natl. Acad. Sci. USA. 2009;106:18581–18586. doi: 10.1073/pnas.0903353106. [DOI] [PMC free article] [PubMed] [Google Scholar]
- 49.Gittes F., Mickey B., Howard J. Flexural rigidity of microtubules and actin filaments measured from thermal fluctuations in shape. J. Cell Biol. 1993;120:923–934. doi: 10.1083/jcb.120.4.923. [DOI] [PMC free article] [PubMed] [Google Scholar]
- 50.Humphrey D., Duggan C., Käs J. Active fluidization of polymer networks through molecular motors. Nature. 2002;416:413–416. doi: 10.1038/416413a. [DOI] [PubMed] [Google Scholar]
- 51.Gardel M.L., Nakamura F., Weitz D.A. Stress-dependent elasticity of composite actin networks as a model for cell behavior. Phys. Rev. Lett. 2006;96:088102. doi: 10.1103/PhysRevLett.96.088102. [DOI] [PubMed] [Google Scholar]
- 52.Lin Y.-C., Koenderink G.H., Weitz D.A. Viscoelastic properties of microtubule networks. Macromolecules. 2007;40:7714–7720. [Google Scholar]
- 53.Zhou E.H., Trepat X., Fredberg J.J. Universal behavior of the osmotically compressed cell and its analogy to the colloidal glass transition. Proc. Natl. Acad. Sci. USA. 2009;106:10632–10637. doi: 10.1073/pnas.0901462106. [DOI] [PMC free article] [PubMed] [Google Scholar]
- 54.Asnacios A., Hamant O. The mechanics behind cell polarity. Trends Cell Biol. 2012;22:584–591. doi: 10.1016/j.tcb.2012.08.005. [DOI] [PubMed] [Google Scholar]
Associated Data
This section collects any data citations, data availability statements, or supplementary materials included in this article.