

Abstract
In the mammalian plasma membrane, cholesterol can translocate rapidly between the exoplasmic and cytoplasmic leaves, so that its distribution between them should be given by the equality of its chemical potential in the leaves. Due to its favorable interaction with sphingomyelin, which is almost entirely in the outer leaf, one expects the great majority of cholesterol to be there also. Experimental results do not support this, implying that there is some mechanism attracting cholesterol to the inner leaf. We hypothesize that it is drawn there to reduce the bending free energy of the membrane caused by the presence of PE (phosphatidylethanolamine). It does this in two ways: first by simply diluting the amount of PE in the inner leaf, and second by ordering the tails of the PE to reduce its spontaneous curvature. Incorporating this mechanism into a model free energy for the bilayer, we find that between 50 and 60% of the total cholesterol should be in the inner leaf of human erythrocytes.
Introduction
The importance of cholesterol in the regulation of the properties of mammalian cells is widely recognized, and it has been the subject of intense research (1,2). Nonetheless, some very basic questions about it remain unanswered. Among these is its distribution between the two leaves of the plasma membrane. It is well known that cholesterol can translocate rapidly between these leaves (3–5). Consequently, its distribution should be determined from the equilibrium requirement that the chemical potential of cholesterol be the same in both leaves. Given this, the well-known preference of cholesterol for SM (sphingomyelin) among phospholipids (6), and the fact that almost all of the SM is in the exoplasmic leaf of the plasma membrane (7), one might expect that the free energy of the system would decrease with an increase in the concentration of cholesterol in the outer leaf, and that the cholesterol would be found predominantly in that leaf. Indeed, molecular-dynamics simulations of some simple models of asymmetric bilayers incorporating SM and cholesterol do find the majority of cholesterol in the outer leaf (8,9), just as early experiments did (10).
However, since 1982, experiments have consistently reported distributions of cholesterol that run contrary to these expectations. There is less agreement on what the actual distribution is. Some estimate that the cholesterol is rather evenly divided between leaves (4,11), others that it is found to a greater extent in the inner, cytoplasmic, leaflet of the plasma membrane of various cells (12–16). Initial observations were made on human erythrocytes (12,13) with 75–80% of the cholesterol reported to be in the inner leaf. Similar observations were then made in plasma membranes of other cells, such as neurons in mice (14,15), ovaries in Chinese hamsters (16), and the endocytotic recycling compartment of the latter (16). Nonetheless, because the experimental evidence can be characterized as indirect, and a rationale for the results is absent, a 2011 review could describe the situation by stating that “…the transbilayer orientation of the sterols that make up one-third of the lipids in the eukaryotic plasma membrane has still not been resolved satisfactorily” (17).
In this article, we propose two related mechanisms that would counteract the attraction of cholesterol for the SM in the outer, exoplasmic, leaflet and would draw it to the inner, cytoplasmic, one. We begin with the observation that almost all of the PE (phosphatidylethanolamine) is in the cytoplasmic leaf (7). PE has a small headgroup, and thus a relatively large spontaneous curvature (18). Because of this, PE forms inverted hexagonal phases at high temperatures, at which the entropy of its hydrocarbon tails dominates, and forms lamellar phases only at lower temperatures (19). Thus, the free energy of bilayers containing PE in the inner leaf must encompass a significant amount of bending energy. This bending energy is quadratic in the concentration of PE, and therefore acts as a repulsive interaction between PE molecules. Such an interaction is equivalent to an attractive interaction between PE and all other components, and affects their distribution. In particular, the bending energy can be reduced simply by diluting the PE and replacing it with any other component that does not increase the spontaneous curvature of the leaf. We assume that this is true of cholesterol, due to its small size and its placement below the headgroups of the phospholipids, as in the umbrella model (20).
In addition to this, the bending energy penalty is also quadratic in the spontaneous curvature of the PE, which increases with the disorder of its tails. But cholesterol is known to decrease the disorder of hydrocarbon tails of phospholipids (21). In particular, in excess of 0.35 mol fraction cholesterol, POPE (palmitoyloleoylphosphatidylethanolamine) bilayers are very well ordered, comparable to those of POPC (palmitoyloleoylphosphatidylcholine) cholesterol bilayers (22). Thus cholesterol will be drawn to the inner leaflet to reduce the bending energy penalty of PE by decreasing its spontaneous curvature. That this bending energy penalty is reduced by a sufficient concentration of cholesterol is in accord with the sterol’s effect on the temperature of transition of PE from the high-temperature hexagonal phase to the low-temperature lamellar one. Whereas the initial addition of cholesterol decreases this transition temperature and stabilizes the inverted-hexagonal phase, amounts greater than 0.3 mol fraction increase the transition temperature and stabilize the lamellar phase (23,24). Some lipids, like POPS (palmitoyloleoylphosphatidylserine) and POPC, also stabilize a lamellar phase in mixtures with PE (25), but do so because their own architecture and interactions favor a lamellar phase, and not because they order the chains of PE. Thus, in contrast to cholesterol, they are not expected to relieve the bending energy penalty of incorporating PE into bilayers.
In sum, we suggest that the free energy of the system is decreased if cholesterol is drawn to the cytoplasmic leaf of the plasma membrane because it reduces the bending energy caused by the inclusion of PE. It does this in two ways: first, by simply diluting the PE in the inner leaf; second, by actually reducing the magnitude of the spontaneous curvature of the PE itself.
We incorporate this hypothesis into a model of an asymmetric membrane consisting of PC (phosphatidylcholine), SM, and cholesterol in the outer leaf and PS (phosphatidylserine), PE, and cholesterol in the inner leaf. We take from experiment on erythrocytes the ratios of SM to PC and of PE to PS as well as the ratio of the total amount of cholesterol to the total amount of lipid. Requiring that the chemical potential of cholesterol in the two leaves be the same, we determine the fraction of cholesterol in the inner leaf. For reasonable values of the interaction parameters we find, in the absence of the bending energy penalty, that only about 25% of the cholesterol is in the inner leaf. The majority is in the outer leaf due to the presence of SM there. Including the bending energy, but ignoring any effect of cholesterol on the spontaneous curvature of PE, we determine that about 39% of cholesterol is now in the inner leaf. Finally, taking into account the ordering effect of cholesterol on PE, we find that between 50 and 60% of the cholesterol should be found in the cytoplasmic leaf of the human erythrocyte membrane.
Theoretical Model
Procedure
We consider a bilayer of which the outer, exoplasmic, leaf consists of NSM molecules of sphingomyelin, NPC molecules of phosphatidylcholine, and NCo molecules of cholesterol; and the inner, cytoplasmic leaf, consists of NPE molecules of phosphatidylethanolamine, NPS molecules of phosphatidylserine, and NCi molecules of cholesterol. We assume that the glycerophospholipids are, for the most part, unsaturated in the sn-2 chain. We denote the total number of molecules in the outer leaf by No, the total number of molecules in the inner leaf by Ni, and the total number of molecules in the bilayer by Nbi. We assume that each leaf is a liquid with the areas of the outer leaf, Ao, and of the inner leaf, Ai, directly related to their molecular compositions. If the area per molecule of the phospholipids be denoted by a and that of cholesterol by raa, then
| (1) |
In the absence of lateral pressure, the Helmholtz free energy of the bilayer, Fbi, depends only on the temperature, T, and the numbers of molecules of each component. Inasmuch as the free energy is an extensive quantity, it can be written in the form
| (2) |
where Nbi = No + Ni and xSM = NSM/Nbi comprise the mol fraction of SM in the bilayer; this is similar for the other components as well. By definition, the sum of the mol fractions of all components is unity.
It will be more convenient to express quantities in terms of the mol fractions of a component in the inner or outer leaf rather than the mol fraction in the bilayer. Thus, we introduce
| (3) |
| (4) |
By definition, ySM + yPC + yCo = 1 and yPE + yPS + yCi = 1, so that only four of these mol fractions are independent. We take the areas of the two leaves to be equal as the fractional area difference, being of the order of the ratio of the membrane thickness to the cell diameter, is small, of order 10−3. Although this difference can be of importance for the gross morphology of cells (26), it is not of importance here. From the equality of areas, the fractions Nbi/Ni and Nbi/No can be obtained, and the mol fractions x can be expressed in terms of the mol fractions y and vice versa. In particular, the total mol fraction of cholesterol in the bilayer, xC, is given by
| (5) |
The four independent mol fractions, then, are determined by the requirement that the chemical potentials of cholesterol in the two leaves be the same; that the ratios of SM to PC in the outer leaf, ySM/yPC; and PS to PE, in the inner leaf, yPS/yPE be equal to their experimental values; and that the total mol fraction of cholesterol in the bilayer (Eq. 5) be equal to its experimental value. Then the distribution of cholesterol between leaves is determined.
We now turn to three models for the free energy of the bilayer. In the first model, we consider each leaf to be described by a phenomenological, regular solution, free energy (27). The coupling between leaves is provided solely by the equality of the cholesterol chemical potentials in the two leaves. We do this because it is not only unclear what other coupling mechanisms are important (28), but also because none of them so directly affect the cholesterol distribution as the one we do incorporate.
In the second model, we include a bending energy due to the presence of PE in the inner layer. This draws the cholesterol to the cytoplasmic leaf where it reduces the bending energy penalty caused by the presence of PE simply by diluting it.
In the third model, we include the effect on the spontaneous curvature of PE due to cholesterol, which draws additional amounts of it to the inner leaf to further reduce the bending energy caused by the presence of PE.
Regular solution free energy
We take as the model free energy a sum of the free energies of the two leaves in the form
| (6) |
| (7) |
We have assumed an average of six nearest-neighbor interactions per molecule. From this free energy we calculate the chemical potential of the cholesterol in the inner and outer leaves:
| (8) |
| (9) |
Again, to determine the six mol fractions, we equate these two chemical potentials, utilize the two constraints
| (10) |
| (11) |
and set to their experimental values the ratios of SM to PC in the outer leaf, ySM/yPC, of PS to PE in the inner leaf, yPS/yPE, and the total mol fraction of cholesterol in the bilayer (xC) (Eq. 5). Once yCi and yCo, the mol fractions of cholesterol in each leaf are obtained, the percentage of the total cholesterol in the inner leaf follows from
where the ratio of the number of molecules in each leaf is determined by the equality of the areas (Eq. 1).
We must now set the parameters of our model. For the ratio of the area per molecule of cholesterol to the area per molecule of the other phospholipids, we take ra = 0.6 because the average area per molecule of phospholipids is ∼a = 0.7 nm2 and that of cholesterol is ∼0.4 nm2 (21,29). For the binary interactions, we choose ϵSM,C = −0.58 kBT, ϵPC,C = 0.2 kBT, ϵSM,PC = 0.30 kBT, ϵPS,C = −0.06 kBT, ϵPE,C = 0.28 kBT, and ϵPS,PE = 0. We discuss the selection of these values in the Appendix.
We must also specify the membrane. We assume that it is at a temperature T = 37°C. We take the ratios of the components to be those of the human erythrocyte as given by Zachowski (30). There we find that the SM accounts for 0.22 of phospholipids in the outer leaf and 0.02 in the inner leaf, whereas PC accounts for 0.20 of the phospholipids in the outer leaf and 0.07 in the inner. For simplicity, we assume that all the SM and PC are in the outer leaf and take the ratio ySM/yPC = 0.22:0.20 = 1.1. Similarly, PS accounts for 0.13 of phospholipids in the inner leaf and 0.02 in the outer, whereas PE accounts for 0.25 in the inner leaf and 0.08 in the outer. Assuming that all PS and PE are in the inner leaf, we take the ratio yPS/yPE = 0.13:0.25 = 0.52. Lastly, we set the total mol fraction of cholesterol in the bilayer to be xC = 0.4 (17).
It is now straightforward to carry out our program, and we find a single solution of our equations. By examining the matrix of second derivatives of the free energy, we have verified that this solution is stable. The inner leaf contains a mol fraction of cholesterol yCi = 0.22. This corresponds to only 25% of the total cholesterol being in the inner leaf. This is easy to understand, inasmuch as the energy of cholesterol is reduced if it goes to the outer layer where it can interact favorably with the SM concentrated there. It is easy to understand, but clearly not in accord with the reported results of experiment. What physics is missing?
Addition of the bending energy
It is our hypothesis that what is missing is that cholesterol can ameliorate the bending energy cost of having PE in the cytoplasmic leaf both by diluting the PE and by increasing the order of its tails, reducing its curvature.
We incorporate this hypothesis into our model by adding to the free energy of the flat bilayer a bending energy. Because absolute values of the spontaneous curvatures of SM, PC, and PS are an order-of-magnitude smaller than that of PE (18,31–33), we consider the curvature only of PE and write the bending energy as
| (12) |
| (13) |
with κ the bending modulus. We shall take κ = 44 kBT, which is appropriate for red blood cells (34).
Our model free energy is now
| (14) |
with fi and fo given by Eqs. 6 and 7 and fb by Eq. 13. We calculate the chemical potential of the cholesterol in the outer and inner layers. We then set the areas of the two leaves, Eq. 1, to be equal, after which we obtain
| (15) |
| (16) |
We must now specify the intrinsic curvature of PE. We first take its value to be that in the absence of cholesterol,
| (17) |
one which has been measured to be H0PE = −0.316 nm−1 (18). Repeating our procedure, we now find a solution corresponding to a stable bilayer in which the inner layer contains a mol fraction yCi = 0.32. This corresponds to 38.6% of the total cholesterol now being found in the inner leaf. As stated above, the reason for this increase from the previous 25% is simple. The bending energy penalty due to the presence of the PEs is equivalent to a pairwise repulsion between them, and thus an attraction between them and all other components. Cholesterol in the outer layer responds, decreasing the free energy of the system by going to the inner layer and diluting the effect of the PE.
We now consider the additional effect of cholesterol acting on the tails of PE which, for sufficient mol fraction, will order the tails of PE and further reduce the bending energy cost of having PE in a planar bilayer. We incorporate this effect by having the spontaneous curvature of PE depend upon the cholesterol mol fraction. We choose
| (18) |
with B = 0.05, ymin = 0.3, and λ = 8. This description is dictated by the following considerations:
-
1.
From the behavior of the temperature of transition of PE from the inverted-hexagonal to lamellar phase (23), we know that the addition of cholesterol initially stabilizes the former phase with respect to the latter. This could result from the cholesterol decreasing the free energy of the inverted-hexagonal phase, or increasing the free energy of the lamellar phase, or a combination of the two. We choose the second of these possibilities by having the spontaneous curvature of PE become more negative with the initial addition of cholesterol. This leads to the second term in Eq. 18 above.
-
2.
Again from the behavior of the temperature of transition of PE from the inverted-hexagonal to lamellar phase (23), we expect that the magnitude of the spontaneous curvature HPE(yCi) no longer increases for mol fractions of cholesterol > ymin ≈ 0.3.
-
3.
Finally, the observation that, with a mol fraction cholesterol of 0.35, the tails of PE are as well ordered as those of PC with cholesterol (22), dictates a choice of λ such that the magnitude of the spontaneous curvature of PE in the presence of cholesterol decreases rapidly for values of y somewhat larger than 0.35. The behavior of the spontaneous curvature HPE(y) is shown in Fig. 1 for values of λ = 6, 8, 10, and 12. We choose λ = 8. The dependence of our results on our choice of λ will be shown below.
Figure 1.
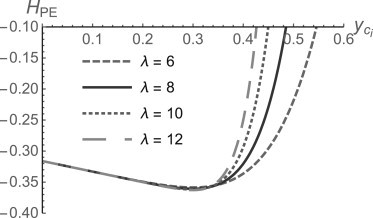
Spontaneous curvature of PE, in inverse nanometers, in the presence of cholesterol as modeled by Eq. 18 for four values of λ.
With the above cholesterol-dependent PE spontaneous curvature, we now find that the inner leaf contains yCi = 0.45 mol fraction of cholesterol, which corresponds to 58% of the total cholesterol being in the inner leaf. We note that the mol fraction of cholesterol in the inner leaf is below the maximum solubility of cholesterol in PE, 0.51 (20). With our solution, the mol fractions of the other components in the plasma membrane are yPS = 0.19 and yPE = 0.36 in the inner leaf, and yCo = 0.35, ySM = 0.34, and yPC = 0.31 in the outer leaf.
Because our hypothesis depends so directly upon the bending energy penalty, our results are clearly a function of the magnitude of the bending modulus. We have taken it to be κ = 44 kBT, appropriate for mammalian red blood cells (34). The dependence of the fraction of cholesterol in the inner leaf upon the bending modulus is shown in Fig. 2.
Figure 2.
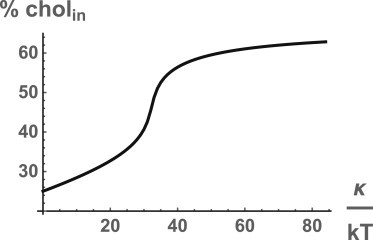
Percentage of cholesterol in the inner leaf as a function of the bending modulus κ.
We have taken the total cholesterol content of the membrane to be xC = 0.4, appropriate for the plasma membrane of erythrocytes (17). As for membranes of other cells, only the plasma membrane and late-stage endosomes are characterized by such large levels of cholesterol (35), whereas other membranes contain much less cholesterol. It is of interest, therefore, to determine the dependence of the percentage of total cholesterol in the inner leaf as a function of total cholesterol content. This is shown in Fig. 3.
Figure 3.
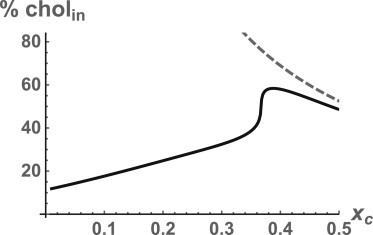
Percentage of total cholesterol in the inner leaf as a function of the total cholesterol mol fraction xC. (Dashed line) Solubility limit of cholesterol.
There are a few things to note:
-
1.
When the total amount of cholesterol is small, the percentage in the inner leaf is also small. Hence, for those membranes with small amounts of cholesterol, we find that most of it will be in the outer leaf.
-
2.
The percentage of cholesterol in the inner leaf initially increases linearly. This is because of the reduction of the bending energy penalty due to the dilution of the PE by cholesterol. The sharp increase reflects the reduction by additional cholesterol of the PE spontaneous curvature.
-
3.
There is a maximum in the percentage of cholesterol in the inner leaf as a function of total cholesterol content. This follows from the fact that we have found that the percentage in the inner leaf can exceed 50% and that this percentage must approach 50 in the limit in which xC → 1. It is interesting that the maximum occurs near xC ≈ 0.35, not very different from the value characterizing erythrocytes.
Discussion
We have proposed that cholesterol is drawn to the cytoplasmic leaf of the plasma membrane in the plasma membrane because that is where the phosphatidylethanolamine is; that by going there, it reduces in two ways the bending energy penalty of incorporating PE into a planar bilayer:
-
1.
By simply diluting the PE mol fraction, cholesterol reduces the penalty, which is quadratic in the PE mol fraction; and
-
2.
In sufficient quantity, cholesterol orders the tails of PE, thereby further reducing the penalty of incorporating PE into the bilayer.
By these means, the chemical potential of cholesterol in the inner leaf will be negative, and matches the chemical potential of cholesterol in the outer leaf, which is negative due to the presence of sphingomyelin. We employed a simple model to show that in the absence of bending energy considerations, only ∼25% of the cholesterol would be in the cytoplasmic leaf, again due to the presence of sphingomyelin in the exoplasmic leaf. Including the bending energy penalty simply of incorporating the PE, i.e., without any effect of cholesterol on its tails, we found that the fraction of total cholesterol in the inner leaf would increase to 39%. Finally, by including the ordering effect of cholesterol on PE, we obtained a fraction of total cholesterol in the inner leaf of some 58%.
Several comments are in order. The additional increase in the fraction of cholesterol in the inner leaf due to the ordering of the PE tails by cholesterol depends upon our phenomenological modeling of this effect by our choice of the cholesterol-dependent spontaneous curvature of PE, as given in Eq. 18. The effect of varying the parameter B, reflecting the coupling of the cholesterol to the order of the PE tails, is simple. Were B = 0, then the spontaneous curvature of PE would be constant, equal to H0PE, and the only response of cholesterol to the bending energy would be to dilute the PE. The fraction of the total cholesterol that is in the inner leaf would be 39%. This corresponds to a mol fraction of cholesterol in the inner leaf of 0.32, too little to order the tails of PE. For small values of B, this remains the case even though the spontaneous curvature does depend on the amount of cholesterol in the inner leaf. For values of B > 0.045, however, the amount of cholesterol drawn to the inner leaf is 0.45 mol fraction, sufficient to order the tails of the PE and greatly reduce its curvature. The fraction of total cholesterol in the inner leaf is 58%, and is not very sensitive to further increases in B. As to the parameter λ, we argued that a range of values was permissible. We show in Fig. 4 that the fraction of cholesterol in the inner leaf exceeds 50% for the values of λ in this range. In principle, one should be able to go beyond this phenomenological modeling by utilizing more microscopic, analytic theories that include an explicit description of the lipid tails and can describe not only the polymorphism of PE (36), but also the effect of cholesterol upon the tails (37). Alternatively simulations similar to, but larger than, those of Mori et al. (38) should evince the effect we have described.
Figure 4.
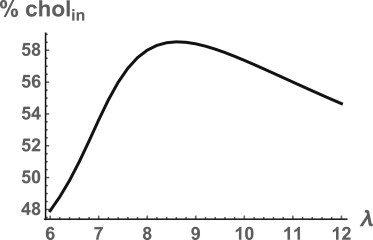
Percentage of cholesterol in the inner leaf as a function of the power λ in the modeling of the spontaneous curvature, Eq. 18.
We have checked the dependence of our results on other assumptions that we have made. The effect of reducing the number of nearest-neighbor interactions from six to four is small; the percentage of total cholesterol in the inner leaf increases from 58 to 61%.
Because the cholesterol is driven to the leaf in which the PE is located, the largest effect on our result for the cholesterol distribution comes from including the amount of PE in the outer leaf, which is a fraction 0.08, compared to 0.25 in the inner leaf (30). If we do this, as well as include the 0.07 PC in the inner leaf, compared to 0.20 in the outer leaf, we find that for xC = 0.4 the percentage of total cholesterol in the inner leaf decreases from 58 to 51%.
Even this modest majority, however, demonstrates our major point: that the long-standing expectation that cholesterol should be found predominantly in the exoplasmic leaf of the plasma membrane, because that is where the sphingomyelin is located, is very likely incorrect. The presence of PE in the cytoplasmic leaf at the cost of a bending energy penalty attracts cholesterol there to reduce that penalty. The specific percentage of cholesterol in the inner leaf depends on several factors that we have tried to illustrate, but values on the order, or in excess, of 50% can be understood.
We close with some observations concerning possible experiments:
-
1.
The effect of total cholesterol content on the percentage of cholesterol in the inner leaf, as shown in Fig. 3, should be measurable in model asymmetric membranes that mimic the plasma membrane (39).
-
2.
As noted earlier, our model is consistent with results on the effect of cholesterol on the inverted-hexagonal to lamellar phase transition temperature in mixtures of cholesterol and POPE (23). There are some correlations clearly expected between cholesterol content and the specific form of PE in the membrane. Because the trans double bond in DEPE (dielaidoylphosphatidylethanolamine) is more easily ordered by cholesterol than is a cis double bond (23,24), one expects the asymmetry in the cholesterol distribution to be less. It would be interesting to know how cholesterol affects a lipid with a polyunsaturated tail such as 18:0/20:4 PE, inasmuch as these polyunsaturated tails make up a nonnegligible fraction, perhaps 18%, of the chains of PE in the plasma membrane (40).
-
3.
It is of interest to note that the effects of ergosterol on PE membranes is not the same as the effect of cholesterol on them. Although the chain order of PE keeps increasing with cholesterol content to fractions of ∼0.45 mol fraction (22), the order saturates at ergosterol mol fractions of ∼0.1 (41). Thus, as Richard Epand (McMaster University, Hamilton, Ontario, Canada) has kindly pointed out to us, one might expect the fraction of cholesterol in the inner leaf of yeast plasma membrane to be rather different from that in mammalian cells. To our knowledge, the distribution of ergosterol between the leaves of the yeast plasma membrane has not been measured. The result of such an experiment would certainly be of interest and relevant to the considerations we have put forth here.
Acknowledgments
We thank Paulo Almeida, Fred Maxfield, Alex Merz, and Richard Epand in particular for useful correspondence and stimulating conversations. M.S. thanks William Clay and Josh Zimmerberg for their insights.
This work is supported in part by the National Science Foundation under grant No. DMR-1203282.
Appendix
The free energy of a binary mixture of molecules of species A and B, as obtained from regular solution theory, is simply the mean-field approximation to the exact free energy obtained from a from a lattice-gas Hamiltonian of form
| (19) |
where niA = 1 if there is a molecule of species A at the site i and is zero otherwise, and similarly for niB. The sum is over all distinct nearest-neighbor pairs of molecules. This Hamiltonian is easily mapped to that of an Ising model
| (20) |
via the relation Si = 2niA – 1 = 1 – 2niB, so that the presence of an A molecule is related to an up-spin, and a B molecule to a down-spin. With this mapping, the interaction J of the Ising model is then J = ωA,B/2 with ωA,B ≡ EA,B – (EA,A + EB,B)/2. The exact transition temperature of the two-dimensional Ising on a triangular lattice is known to be kBTc = 4J/ln 3 = 2ωA,B/ln 3 (42). Thus, if a physical system is known to undergo a phase separation at a critical temperature T, then the interaction parameter in a model including fluctuations should be positive, and taken to be ωA,B = (1/2)ln 3 kBT ≈ 0.55 kBT.
Regular solution theory, however, does not include fluctuations. Within this theory, the free energy per particle of a binary mixture on a triangular lattice can be written
It yields a transition kBTrsc = 3ϵA,B. Therefore, to obtain in regular solution theory the same transition temperature as the exact result, one must choose ϵA,B = (2/3 ln 3)ωA,B ≈ 0.6 ωA,B.
The values of the interaction parameters, ωA,B, for many pairs of lipids can be estimated from experiment and have been collected by Almeida (43). In particular for the interactions between components of the outer leaf at T = 37°C, ωPC,C = 0.34 kBT, ωSM,C = −0.97 kBT, and ωSM,PC = 0.51 kBT. Because ωPC,C is positive, we use in our regular solution theory the estimate ϵPC,C/kBT = 0.6, ωPC,C/kBT = 0.20. If we take the ratios of the other interactions parameters to be the same as in the table, i.e., ϵSM,C/ϵPC,C = ωSM,C/ωPC,C, then ϵSM,C/kBT = −0.58 and similarly ϵSM,PC/kBT = 0.30.
The interactions relevant to the inner leaf, those between PE and cholesterol, between PS and cholesterol, and between PE and PS, are not included in the table of Almeida (43). To obtain an estimate for them, we proceed as follows: Cholesterol and PE do not phase-separate at T = 37°C, so that we should take ϵPE,C/kBT < 1/3. We choose ϵPE,C/kBT = 0.28.
Next, we estimate the interaction between PS and cholesterol. Niu and Litman (6) have measured the differences ΔSM ≡ ωSM,C − ωPC,C = −1181 cal/mol = −1.92 kBT at 37°C, and ΔPS ≡ ωPS,C − ωPC,C = −0.65 kBT.
We assume that
so that ϵPS,C/kBT = ϵPC,C + 0.34(ϵSM,C – ϵPC,C) = −0.06.
Lastly, because the tails of PE and PS lipids are similar, we take ϵPE,PS/kBT = 0. This completes the specification of the interactions.
References
- 1.Yeagle P.L. Cholesterol and the cell membrane. Biochim. Biophys. Acta. 1985;822:267–287. doi: 10.1016/0304-4157(85)90011-5. [DOI] [PubMed] [Google Scholar]
- 2.Maxfield F.R., van Meer G. Cholesterol, the central lipid of mammalian cells. Curr. Opin. Cell Biol. 2010;22:422–429. doi: 10.1016/j.ceb.2010.05.004. [DOI] [PMC free article] [PubMed] [Google Scholar]
- 3.Lange Y., Dolde J., Steck T.L. The rate of transmembrane movement of cholesterol in the human erythrocyte. J. Biol. Chem. 1981;256:5321–5323. [PubMed] [Google Scholar]
- 4.Müller P., Herrmann A. Rapid transbilayer movement of spin-labeled steroids in human erythrocytes and in liposomes. Biophys. J. 2002;82:1418–1428. doi: 10.1016/S0006-3495(02)75496-9. [DOI] [PMC free article] [PubMed] [Google Scholar]
- 5.Steck T.L., Ye J., Lange Y. Probing red cell membrane cholesterol movement with cyclodextrin. Biophys. J. 2002;83:2118–2125. doi: 10.1016/S0006-3495(02)73972-6. [DOI] [PMC free article] [PubMed] [Google Scholar]
- 6.Niu S.-L., Litman B.J. Determination of membrane cholesterol partition coefficient using a lipid vesicle-cyclodextrin binary system: effect of phospholipid acyl chain unsaturation and headgroup composition. Biophys. J. 2002;83:3408–3415. doi: 10.1016/S0006-3495(02)75340-X. [DOI] [PMC free article] [PubMed] [Google Scholar]
- 7.Devaux P.F. Static and dynamic lipid asymmetry in cell membranes. Biochemistry. 1991;30:1163–1173. doi: 10.1021/bi00219a001. [DOI] [PubMed] [Google Scholar]
- 8.Perlmutter J.D., Sachs J.N. Interleaflet interaction and asymmetry in phase separated lipid bilayers: molecular dynamics simulations. J. Am. Chem. Soc. 2011;133:6563–6577. doi: 10.1021/ja106626r. [DOI] [PubMed] [Google Scholar]
- 9.Polley A., Vemparala S., Rao M. Atomistic simulations of a multicomponent asymmetric lipid bilayer. J. Phys. Chem. B. 2012;116:13403–13410. doi: 10.1021/jp3032868. [DOI] [PubMed] [Google Scholar]
- 10.Fisher K.A. Analysis of membrane halves: cholesterol. Proc. Natl. Acad. Sci. USA. 1976;73:173–177. doi: 10.1073/pnas.73.1.173. [DOI] [PMC free article] [PubMed] [Google Scholar]
- 11.Lange Y., Slayton J.M. Interaction of cholesterol and lysophosphatidylcholine in determining red cell shape. J. Lipid Res. 1982;23:1121–1127. [PubMed] [Google Scholar]
- 12.Brasaemle D.L., Robertson A.D., Attie A.D. Transbilayer movement of cholesterol in the human erythrocyte membrane. J. Lipid Res. 1988;29:481–489. [PubMed] [Google Scholar]
- 13.Schroeder F., Nemecz G., Devaux P.F. Transmembrane distribution of sterol in the human erythrocyte. Biochim. Biophys. Acta. 1991;1066:183–192. doi: 10.1016/0005-2736(91)90185-b. [DOI] [PubMed] [Google Scholar]
- 14.Wood W.G., Schroeder F., Nemecz G. Asymmetric distribution of a fluorescent sterol in synaptic plasma membranes: effects of chronic ethanol consumption. Biochim. Biophys. Acta. 1990;1025:243–246. doi: 10.1016/0005-2736(90)90103-u. [DOI] [PubMed] [Google Scholar]
- 15.Igbavboa U., Avdulov N.A., Wood W.G. Increasing age alters transbilayer fluidity and cholesterol asymmetry in synaptic plasma membranes of mice. J. Neurochem. 1996;66:1717–1725. doi: 10.1046/j.1471-4159.1996.66041717.x. [DOI] [PubMed] [Google Scholar]
- 16.Mondal M., Mesmin B., Maxfield F.R. Sterols are mainly in the cytoplasmic leaflet of the plasma membrane and the endocytic recycling compartment in CHO cells. Mol. Biol. Cell. 2009;20:581–588. doi: 10.1091/mbc.E08-07-0785. [DOI] [PMC free article] [PubMed] [Google Scholar]
- 17.van Meer G. Dynamic transbilayer lipid asymmetry. Cold Spring Harb. Perspect. Biol. 2011;3:1–11. doi: 10.1101/cshperspect.a004671. [DOI] [PMC free article] [PubMed] [Google Scholar]
- 18.Kollmitzer B., Heftberger P., Pabst G. Monolayer spontaneous curvature of raft-forming membrane lipids. Soft Matter. 2013;9:10877–10884. doi: 10.1039/C3SM51829A. [DOI] [PMC free article] [PubMed] [Google Scholar]
- 19.Tilcock C.P., Bally M.B., Cullis P.R. Influence of cholesterol on the structural preferences of dioleoylphosphatidylethanolamine-dioleoylphosphatidylcholine systems: a phosphorus-31 and deuterium nuclear magnetic resonance study. Biochemistry. 1982;21:4596–4601. doi: 10.1021/bi00262a013. [DOI] [PubMed] [Google Scholar]
- 20.Huang J., Buboltz J.T., Feigenson G.W. Maximum solubility of cholesterol in phosphatidylcholine and phosphatidylethanolamine bilayers. Biochim. Biophys. Acta. 1999;1417:89–100. doi: 10.1016/s0005-2736(98)00260-0. [DOI] [PubMed] [Google Scholar]
- 21.Hung W.-C., Lee M.-T., Huang H.W. The condensing effect of cholesterol in lipid bilayers. Biophys. J. 2007;92:3960–3967. doi: 10.1529/biophysj.106.099234. [DOI] [PMC free article] [PubMed] [Google Scholar]
- 22.Paré C., Lafleur M. Polymorphism of POPE/cholesterol system: a 2H nuclear magnetic resonance and infrared spectroscopic investigation. Biophys. J. 1998;74:899–909. doi: 10.1016/S0006-3495(98)74013-5. [DOI] [PMC free article] [PubMed] [Google Scholar]
- 23.Epand R.M., Bottega R. Modulation of the phase transition behavior of phosphatidylethanolamine by cholesterol and oxysterols. Biochemistry. 1987;26:1820–1825. doi: 10.1021/bi00381a005. [DOI] [PubMed] [Google Scholar]
- 24.Takahashi H., Sinoda K., Hatta I. Effects of cholesterol on the lamellar and the inverted hexagonal phases of dielaidoylphosphatidylethanolamine. Biochim. Biophys. Acta. 1996;1289:209–216. doi: 10.1016/0304-4165(95)00170-0. [DOI] [PubMed] [Google Scholar]
- 25.Epand R.M., Bottega R. Determination of the phase behavior of phosphatidylethanolamine admixed with other lipids and the effects of calcium chloride: implications for protein kinase C regulation. Biochim. Biophys. Acta. 1988;944:144–154. doi: 10.1016/0005-2736(88)90427-0. [DOI] [PubMed] [Google Scholar]
- 26.Lim H., Wortis M., Mukhopadhyay R. Red blood cell shapes and shape transformations: Newtonian mechanics of a composite membrane. In: Gompper G., Schick M., editors. Soft Matter, Vol. 4: Lipid Bilayers and Red Blood Cells. Wiley-VCH; Weinheim, Germany: 2008. pp. 83–249. [Google Scholar]
- 27.Furman D., Dattagupta S., Griffiths R. Global phase diagram for a three-component model. Phys. Rev. B. 1977;15:441–464. [Google Scholar]
- 28.May S. Trans-monolayer coupling of fluid domains in lipid bilayers. Soft Matter. 2009;5:3148–3156. [Google Scholar]
- 29.Phillips M. The physical state of phospholipids and cholesterol in monolayers, bilayers, and membranes. Prog. Surf. Membrane Sci. 1971;5:139–222. [Google Scholar]
- 30.Zachowski A. Phospholipids in animal eukaryotic membranes: transverse asymmetry and movement. Biochem. J. 1993;294:1–14. doi: 10.1042/bj2940001. [DOI] [PMC free article] [PubMed] [Google Scholar]
- 31.Byström T., Lindblom G. Molecular packing in sphingomyelin bilayers and sphingomyelin/phospholipid mixtures. Spectrochim. Acta A Mol. Biomol. Spectrosc. 2003;59:2191–2195. doi: 10.1016/s1386-1425(03)00014-3. [DOI] [PubMed] [Google Scholar]
- 32.Fuller N., Benatti C.R., Rand R.P. Curvature and bending constants for phosphatidylserine-containing membranes. Biophys. J. 2003;85:1667–1674. doi: 10.1016/s0006-3495(03)74596-2. [DOI] [PMC free article] [PubMed] [Google Scholar]
- 33.Boulgaropoulos B., Rappolt M., Pabst G. Lipid sorting by ceramide and the consequences for membrane proteins. Biophys. J. 2012;102:2031–2038. doi: 10.1016/j.bpj.2012.03.059. [DOI] [PMC free article] [PubMed] [Google Scholar]
- 34.Evans E.A. Bending elastic modulus of red blood cell membrane derived from buckling instability in micropipet aspiration tests. Biophys. J. 1983;43:27–30. doi: 10.1016/S0006-3495(83)84319-7. [DOI] [PMC free article] [PubMed] [Google Scholar]
- 35.van Meer G., Voelker D.R., Feigenson G.W. Membrane lipids: where they are and how they behave. Nat. Rev. Mol. Cell Biol. 2008;9:112–124. doi: 10.1038/nrm2330. [DOI] [PMC free article] [PubMed] [Google Scholar]
- 36.Li X., Schick M. Theory of lipid polymorphism: application to phosphatidylethanolamine and phosphatidylserine. Biophys. J. 2000;78:34–46. doi: 10.1016/s0006-3495(00)76570-2. [DOI] [PMC free article] [PubMed] [Google Scholar]
- 37.Elliott R., Szleifer I., Schick M. Phase diagram of a ternary mixture of cholesterol and saturated and unsaturated lipids calculated from a microscopic model. Phys. Rev. Lett. 2006;96:098101. doi: 10.1103/PhysRevLett.96.098101. [DOI] [PubMed] [Google Scholar]
- 38.Mori K., Hata M., Hoshino T. MD simulations of asymmetric phospholipid bilayers with ions and cholesterols. Chem. Biol. Informatics J. 2004;4:15–26. [Google Scholar]
- 39.Lin Q., London E. Preparation of artificial plasma membrane mimicking vesicles with lipid asymmetry. PLoS ONE. 2014;9:e87903. doi: 10.1371/journal.pone.0087903. [DOI] [PMC free article] [PubMed] [Google Scholar]
- 40.Keenan T.W., Morré D.J. Phospholipid class and fatty acid composition of Golgi apparatus isolated from rat liver and comparison with other cell fractions. Biochemistry. 1970;9:19–25. doi: 10.1021/bi00803a003. [DOI] [PubMed] [Google Scholar]
- 41.Hsueh Y.-W., Weng C.-J., Zuckermann M. Deuterium NMR study of the effect of ergosterol on POPE membranes. Biophys. J. 2010;98:1209–1217. doi: 10.1016/j.bpj.2009.12.4279. [DOI] [PMC free article] [PubMed] [Google Scholar]
- 42.Wannier G. The statistical problem in cooperative phenomena. Rev. Mod. Phys. 1945;17:50–60. [Google Scholar]
- 43.Almeida P.F. Thermodynamics of lipid interactions in complex bilayers. Biochim. Biophys. Acta. 2009;1788:72–85. doi: 10.1016/j.bbamem.2008.08.007. [DOI] [PubMed] [Google Scholar]