Abstract
In this study, we examine the relationship between the physical structure and dissolution behavior of olanzapine (OLZ) prepared via hot-melt extrusion in three polymers [polyvinylpyrrolidone (PVP) K30, polyvinylpyrrolidone-co-vinyl acetate (PVPVA) 6:4, and Soluplus® (SLP)]. In particular, we examine whether full amorphicity is necessary to achieve a favorable dissolution profile. Drug–polymer miscibility was estimated using melting point depression and Hansen solubility parameters. Solid dispersions were characterized using differential scanning calorimetry, X-ray powder diffraction, and scanning electron microscopy. All the polymers were found to be miscible with OLZ in a decreasing order of PVP>PVPVA>SLP. At a lower extrusion temperature (160°C), PVP generated fully amorphous dispersions with OLZ, whereas the formulations with PVPVA and SLP contained 14%–16% crystalline OLZ. Increasing the extrusion temperature to 180°C allowed the preparation of fully amorphous systems with PVPVA and SLP. Despite these differences, the dissolution rates of these preparations were comparable, with PVP showing a lower release rate despite being fully amorphous. These findings suggested that, at least in the particular case of OLZ, the absence of crystalline material may not be critical to the dissolution performance. We suggest alternative key factors determining dissolution, particularly the dissolution behavior of the polymers themselves.
Keywords: olanzapine, dissolution, solid dispersion, polymer, amorphous, crystallinity, particle size
INTRODUCTION
The oral bioavailability enhancement of poorly soluble active pharmaceutical ingredients (APIs) continues to represent a significant issue in drug development. One strategy to overcome this obstacle is the development of amorphous solid dispersion formulations using hydrophilic polymers. The term “solid dispersion” was described by Chiou and Riegelman1 as “the dispersion of one or more active ingredients in an inert carrier matrix at solid state prepared by melting (fusion), solvent, or melting–solvent method.” This definition is still applicable despite the field having developed considerably to include a wider range of manufacturing techniques [e.g., hot-melt extrusion (HME)] and new concepts in structural characteristics, particularly involving the recognition of complexities of molecular dispersion of drugs in polymers.
The mechanisms underpinning the dissolution increase of these formulations are still not yet clearly understood. Currently, there is a belief that the fundamental critical factor is the molecular dispersion of the drug in the polymer, thereby representing the ultimate in particle size reduction and lattice energy negation. A number of papers have addressed these and associated issues such as wetting and reduction in agglomeration.2,3 In addition, earlier work in the pre-HME solid dispersion field suggested that the drug dissolution may be controlled by the behavior of the carrier (so-called “carrier controlled dissolution”), by implication suggesting that the physical state of the drug may not be important in such systems.4,5
The specific issue of whether full amorphization (in terms of either molecular dispersion or amorphous phase generation) is actually necessary to achieve fast and complete dissolution has been addressed by previous authors. For example, Verheyen et al.6 observed that the dissolution rate of diazepam and temazepam could be enhanced when formulated into solid dispersions with polyethylene glycol (PEG) 6000, although both drugs remained in a highly crystalline state. The reason for this behavior was attributed to the existence of a microenvironment created by the polymer at the surface of the drug particles leading to a better wetting and solubilization properties.
In this study, we focused on the physical state properties of the dispersions prepared with olanzapine (OLZ) and their influence on the dissolution performance. OLZ was formulated with three hydrophilic polymers, polyvinylpyrrolidone (PVP) K30, polyvinylpyrrolidone-co-vinyl acetate (PVPVA) 6:4, and polyvinyl caprolactam-polyvinylacetate-PEG graft copolymer (Soluplus®, SLP) via HME. HME is a widely used technology in which API and carrier are converted into a product of uniform shape and density by the effect of heat and mechanical stress.7,8 HME represents a continuous solvent-free manufacturing method and is relatively easy to scale-up, hence presenting a commercially viable approach to dosage form development.
Olanzapine is an atypical antipsychotic agent used to treat both negative and positive symptoms of schizophrenia, acute mania with bipolar disorder, agitation, and psychotic symptoms in dementia.9 According to Biopharmaceutical Classification System (BCS), OLZ is classified as a Class II drug (low solubility, high permeability) with water solubility around 43 mg/L.10 OLZ has been suggested to crystallize in more than 50 different crystalline forms, including anhydrates, hydrates, and solvates.11,12 In this study, anhydrous OLZ Form I, the most stable form and currently used in pharmaceutical formulations, was selected for study. In terms of the polymers used in this work, numerous studies have been conducted on the solubility enhancement of water-insoluble compounds, in particular using PVP and its derivatives as carriers,13–16 with high solubilization effects and the ability to establish hydrogen bonds with APIs being well-recognized properties of these polymers.17,18 However, there are also issues associated with the use of these materials, for example, PVP K30 has a high glass transition temperature (Tg) and a relatively low degradation temperature (Tdeg), which can represent an issue during processing via HME because of the narrow temperature window of operation. Moreover, PVP is classified as an extremely hygroscopic substance, which is attributed to the electronegative groups (C═O) in the pyrrolidone structure being able to establish hydrogen bonding with water.19 The copolymer PVPVA 6:4 has a 40% replacement with lipophilic vinyl acetate functional groups and therefore it is less hygroscopic than the homopolymer system.20 SLP on the other hand is a synthetic polymer that combines both hydrophilic and hydrophobic components in its structure that facilitates increased solubilization of drugs and thus the preparation of fully amorphous solid dispersions. Moreover, the low Tg (≈70°C) compared with the PVP-based polymers permits easier processing of thermolabile APIs, whereas its low hygroscopicity has favorable stability implications. The chemical structures of OLZ and each polymer are presented in Figure1.
Figure 1.
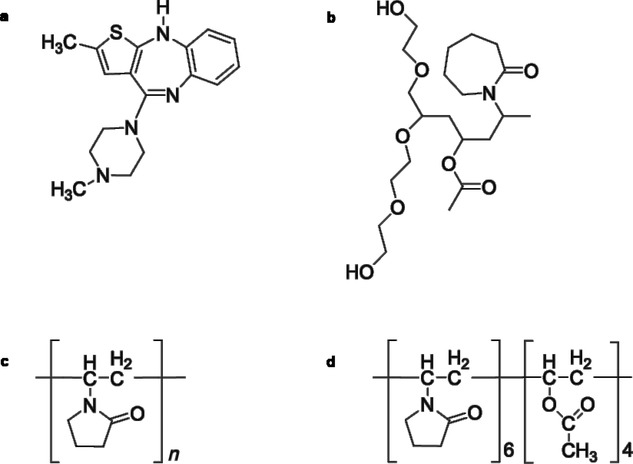
Chemical structures of OLZ (a), SLP (b), PVP K30 (c), and PVPVA 6:4 (d).
In this study, the freshly prepared HME systems were characterized with particular reference to the miscibility and crystallinity of OLZ; the influence of drug physical state on the dissolution performance was evaluated accordingly. At first, we evaluated the optimal extrusion temperatures for the OLZ–polymer systems based on the properties of each material (i.e., Tg, Tm, and Tdeg). In addition, the thermodynamic solubility/miscibility and interaction of OLZ in each polymer were assessed using melting point depression (MPD)21,22 and solubility parameter23–25 approaches. The physicochemical properties and the morphology of the extrudates were evaluated using differential scanning calorimetry (DSC), X-ray powder diffraction (XRPD), and scanning electron microscopy (SEM). In this manner, it is intended that the association between the miscibility, processing characteristics, physical structure, and dissolution behavior of OLZ may be determined and compared for three polymer systems, in turn leading to insights into the critical factors determining performance.
EXPERIMENTAL
Materials
Olanzapine [molecular weight (Mw) = 312.43 g/mol, density (ρ) = 1.30 g/cm3] was purchased from Myjoy Ltd. (India); PVP K30 (Mw = 41.550 g/mol, ρ = 1.16 g/cm3), PVPVA 6:4 (Mw = 57.500 g/mol, ρ = 1.17 g/cm3), and SLP (Mw = 118.000 g/mol, ρ = 1.20 g/cm3) were kindly donated by BASF Chemicals (Germany). Methanol (analytical grade) was obtained from Sigma–Aldrich (UK) . Phosphate buffer, pH 6.8 (Ph Eur), used in the dissolution studies was prepared with potassium dihydrogen orthophosphate (Fischer Scientific, UK) and sodium phosphate dibasic (Sigma–Aldrich).
Methods
Preparation of HMEs
Hot-melt extrudates were prepared using a corotating twin screw extruder Thermo Scientific HAAKE MiniLab II (Thermo Scientific, UK). Formulations of OLZ with PVPVA and SLP were prepared with ratios of 20:80 and 50:50 (w/w) and extruded at 160°C and 180°C; the OLZ–PVP formulation was only successfully prepared at 50:50 (w/w) and extruded at 160°C. Each system was prepared using a total weight of 5 g at a speed of 100 rotations/min and mixed inside the barrel for 10 min. A round die with a diameter of 2 mm was attached to the extruder.
Drug–Polymer Miscibility Prediction
Melting Point Depression
Olanzapine and polymers were passed through a combination of sieves, and a fraction between 63 and 106 μm was used in all MPD experiments. Polymers were dried over P2O5 for 48 h prior to usage. Physical mixtures (PMs) with a drug ratio of 70%, 75%, 80%, 85%, 90%, and 100% (w/w) were prepared at least in triplicate. The melting temperature of OLZ both in the absence and presence of polymers was measured using DSC at a scan rate of 10°C/min in standard pans.
Melting point depression results can be used to predict the drug–polymer Flory–Huggins (FH) interaction parameter, χ, using Eq. 1,
| 1 |
where  and ΔHfus are the melting point and the enthalpy of fusion of the drug, respectively;
  is the melting point of the drug when mixed with the polymer; ϕ is the volume fraction of the drug or polymer depending on the subscript and m is the molar volume ratio of a polymer molecule to a drug molecule.21,22
Gibbs Free Energy Change
The Flory–Huggins lattice theory accounts for the entropy (ΔSmix) and enthalpy (ΔHmix) of mixing between large (polymers) and small molecules (APIs in the case of solid dispersions).22,26 One way to express this relationship is by considering the free energy of mixing, ΔGmix, at absolute temperature (T), as expressed by Eq. 2,
| 2 |
The Flory–Huggins interaction parameter, χ, which is related to the enthalpy and entropy of mixing, can be described by Eq. 3,
| 3 |
where ndrug and npolymer are the number of moles of drug and polymer, respectively. The first two terms on the right hand side of the equation represent the entropy of mixing, whereas the third term represents the enthalpy of mixing.
Hansen Solubility Parameter
The Hansen solubility parameters, δ, of drugs and polymers were calculated from their chemical structures using the van Krevelen and Hoftyzer method according to Eqs. 4 and 5.25 The total solubility parameter (δt) was determined from the interactions between dispersion forces (δd), polar interactions (δp), and hydrogen bonding (δh) of the functional groups in the parent molecule divide by the molar volume, V. The units of the solubility parameters are MPa1/2.
| 4 |
 |
5 |
where Fdi, Fpi, and Ehi are the group contributions for different component (dispersion forces, polar interactions, and hydrogen bonding, respectively) of structural groups that are reported in the literature at 25°C.25
The drug–polymer interaction parameter, χ, using the solubility parameters difference between the drug and the polymer, can be estimated as following,25
| 6 |
where V0 is the volume of the lattice site, R is the gas constant, and T is the absolute temperature.
Crystallinity Quantification
The amount of crystalline OLZ present in the fresh extrudates was estimated by constructing a calibration curve using the enthalpy of melting of OLZ in the presence of the polymer versus the ratio of the drug in the mixture. This was performed in order to account for changes in the melting behavior and enthalpy caused by the presence of the polymer. PMs were prepared by mixing OLZ and each polymer with a mortar and pestle in ratios of 10:90, 20:80, 30:70, 50:50, 70:30, and 90:10 (w/w) and analyzed in DSC. All the PMs were used with 63–106 μm particle size range.
Thermal Analysis
Standard DSC (Q2000; TA Instruments, New Castle, Delaware) analysis was performed at a heating rate of 10°C/min. Modulated temperature DSC (Q2000; TA Instruments) analysis was conducted using a heating rate of 2°C/min, amplitude ±0.318°C and a period of 60 s. Scans were carried out within the temperature range 0°C–220°C and TA standard crimped pans were used in all experiments. Nitrogen purge gas was used with a flow rate of 50 mL/min. Calibration was performed using n-octadecane, benzoic acid, indium, and tin. For each sample, measurements were repeated at least in triplicate.
Thermogravimetric analysis (TGA Q5000; TA Instruments) was used to measure the degradation temperature (Tdeg) of the raw materials and the water content of the fresh extrudates. Analyses were conducted at 10°C/min from room temperature to 300°C. Aluminum open pans were used.
X-Ray Powder Diffraction
X-ray powder diffraction (Thermo-ARL Xtra; Thermo Scientific) spectra were collected from scans within the range 5.0°–40.0° at 2θ with a step size of 0.01° and time per step of 1 s. Extrudates were premilled by mortar and pestle before the tests, transferred into sample holders with a zero background and placed onto a spinner stage. The X-ray source used was Cu Kα1 with a voltage of 45 kV and current of 40 mA.
Scanning Electron Microscopy
Scanning electron microscopy (JSM 4900LV; JEOL Ltd., Japan) was used to acquire microphotographs on the surface and cross-section of the freshly prepared extrudates. To improve conductivity prior to examination, samples were coated with gold using a Polaron SC7640 sputter gold coater (Quorum Technologies, UK).
Dissolution Studies
The drug content of each formulation was determined by UV detection (Lambda XLS UV/Vis; Perkin-Elmer) at 253 nm. Samples were dissolved in methanol and diluted with the same solvent as appropriate.
Dissolution studies were carried out on a Copley CIS 8000 dissolution bath (Copley Scientific, UK). The USP paddle method with a rotation speed of 50 rpm was employed and 900 mL of phosphate buffer pH 6.8 (Ph Eur) at the temperature of 37.0 ± 0.5°C was used. Samples (pure OLZ and HME) equivalent to 12 mg of OLZ (based on the drug loading of each formulation) were used with a 63–106-μm sieve fraction. At predetermined intervals, 10 mL of solution was withdrawn and filtered through a 0.45-μm filter. Subsequently, the filtrate was analyzed spectrophotometrically at 253 nm. All the dissolution experiments were performed under sink conditions.
To compare the dissolution performances between the different systems, a similarity factor (f2) was used. This is an independent model that measures the similarity in percentage between two profiles of dissolution27; f2 is a logarithmic reciprocal square root transformation of the square error, which can be expressed by Eq. 7,
| 7 |
where n is the number of time points, Rt is the percentage of drug release of a reference batch at the time t and Tt is the percentage of drug release of the comparison batch at time t. When f2 is greater than 50 (i.e., 50–100), this indicates the sameness or equivalence of the both compared profiles. Conversely, when f2 is less than 50, then it is taken as both the profiles are different. In this study, the similarity factor was used to assess differences in the dissolution profiles acquired up to a maximum of 45 min, depending on the system, as only one measurement should be considered after both products have reached 85% dissolution.27
RESULTS
Estimation of Drug–Polymer Miscibility
We investigated the thermodynamic miscibility between OLZ and each polymer by using two different approaches (described earlier in the Experimental section): melting point depression and Hansen solubility parameter. The former method describes the drug–polymer miscibility based on the Flory–Huggins theory,28 which delineates entropy and enthalpy components at a given temperature.29 Considering the lattice-based models, the entropy of mixing is predicted to be relatively constant (and favorable to mixing), being the balance between adhesive and cohesive interactions that determines miscibility. As a result, the mixing can be exothermic (Flory–Huggins interaction parameter, χ < 0), endothermic (χ > 0), or athermal (χ = 0), which leads to different reduction magnitudes in the melting point of the drug.21,22
The MDP results obtained for OLZ and each polymer system are shown in Figure 2. In our study, all the interaction parameters, χ, were found to be negative, indicating that all the three polymers were miscible with OLZ and can be presented as following: −3.34 (R2 = 0.984) for OLZ–PVP, −3.26 (R2 = 0.998) for OLZ–PVPVA, and finally −2.54 (R2 = 0.995) for the OLZ–SLP system. On the basis of these results, the degree of miscibility and interaction between OLZ and each polymer was suggested to follow the decreasing rank order PVP>PVPVA>SLP.
Figure 2.
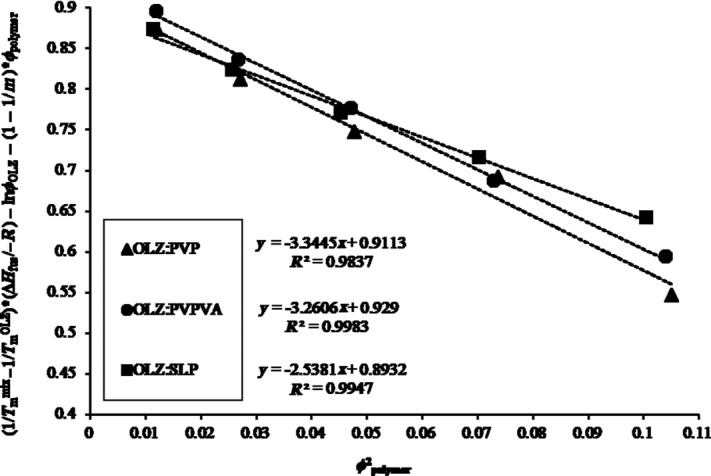
Melting point depression results obtained for each OLZ–polymer system (PVP, PVPVA, and SLP). Slope of each curve included for subsequent calculation of the Flory–Huggins interaction parameter (χ).
Figure 3 shows the changes in the Gibbs free energy for the three systems. For small values of the interaction parameter, the free energy of mixing is negative and shows a concave dependence on composition indicating miscibility. As expected and according to Eq. 3, the ΔGmix is negative for all the OLZ–polymer systems. However, lower values were seen for the OLZ–PVP and OLZ–PVPVA systems when compared with OLZ–SLP, thereby indicating greater miscibility for these two systems.
Figure 3.
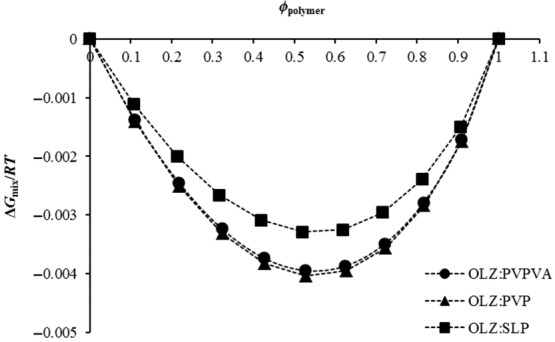
Free energy-composition phase diagrams of OLZ and each polymer system (PVP, PVPVA, and SLP).
The second approach in analyzing OLZ–polymer system miscibility was by using Hansen solubility parameters (δ), which were calculated based on van Krevelen and Hoftyzer group contribution (Eq. 5). The δ for each component, difference between drug and each polymer (Δδ), and interaction parameter (χ) are provided in Table1. It is reported that compounds with similar values of solubility parameter, nominally Δδ < 7.0 MPa1/2, are more likely to be miscible, whereas if Δδ > 10.0 MPa1/2 the compounds are most probably immiscible.30 From the presented results, OLZ had a solubility parameter (25.68 MPa1/2) closer to PVP (26.28 MPa1/2), whereas PVPVA and SLP had a slightly lower solubility parameter values, 24.37 and 23.07 MPa1/2, respectively. In the present case, the difference between the solubility parameter of OLZ and each polymer was lower than 7.0 MPa1/2, indicating good miscibility for all systems.
Table 1.
Calculated Solubility Parameters and Interaction Parameters Using Hansen Group Contribution Theory for OLZ and Each Polymer
| Compound | δ (MPa)1/2 | Δδ (MPa)1/2 | χ |
|---|---|---|---|
| OLZ | 25.68 | ||
| PVP | 26.28 | 0.60 | 0.03 |
| PVPVA | 24.37 | 1.31 | 0.16 |
| SLP | 23.07 | 2.61 | 0.62 |
The value of χ, calculated based on Eq. 6, refers to the square of the difference in solubility parameters that were calculated from the values of group contributions at 25°C. A closer value of χ to zero suggests greater interaction between the drug and the polymer.25 According to the results in Table1, the miscibility between OLZ and each polymer is likely to follow the same order as observed with MPD experiments (PVP>PVPVA>SLP).
These two methods used here to predict drug–polymer miscibility have concomitant strengths and limitations, as has been discussed extensively in the literature. In brief, the MPD approach is temperature and composition dependent, whereas the calculation of solubility parameters allows the estimation of the degree of miscibility based on the chemical structure of the drug and polymer at room temperature.31,32 Moreover, MPD methods may not be performed properly if the drug degrades at the melting temperature, whereas the group contribution method for the calculation of Hansen solubility is not applicable for drug–polymer systems presenting strong intermolecular interactions.33 In this work, the two approaches used to predict the miscibility between OLZ and each polymer were in good agreement, with PVP being identified by both as the polymer presenting the greatest degree of miscibility with OLZ, followed by PVPVA and finally SLP. The agreement between the two approaches lends weight to the applicability of the theoretical approaches used, although clearly experimental measurements, as performed below, are ultimately the most reliable means of testing miscibility.
Characterization of the Raw Materials
The optimal extrusion temperature has to be carefully determined based on the melting temperature (Tm) of the drug, the Tg of the amorphous carrier, and the thermoplastic properties of the mixture.34 In particular, the temperature should be higher than the glass transition temperature (Tg) of the carrier in order to decrease the viscosity and promote an adequate mixing with the drug and a suitable flow through the extruder. Therefore, it is imperative that the thermal properties of drug substances and excipients are well understood prior to extrusion.
Table2 shows the main thermal properties of OLZ and each polymer. PVP has the highest Tg and the lowest degradation temperature (Tdeg, measured by using TGA as the onset temperature) when compared with PVPVA and SLP. Neither OLZ nor the polymers appeared to degrade at the extrusion temperatures used in this study (160°C for all the three systems and 180°C for PVPVA and SLP as PVP degraded at this temperature). Particular attention was paid to PVP because of the smaller temperature interval between its Tg, Tdeg, and the processing temperature. However, holding PVP isothermally in the TGA at 160°C for 30 min resulted in only a 0.8 ± 0.1% loss of mass, suggesting that 160°C might be a suitable temperature for the extrusion of the OLZ–PVP formulation.
Table 2.
Experimental Thermal Properties of OLZ and Polymers
| Material | Tm onset ± SD (°C) | Tg ± SD (°C) | Tdeg ± SD (°C) |
|---|---|---|---|
| OLZ | 193.6 ± 0.3 | 71.4 ± 0.4a | 265.3 ± 4.0 |
| PVP | 161.6 ± 0.2 | 179.8 ± 1.6 | |
| PVPVA | 105.6 ± 1.4 | 282.3 ± 1.0 | |
| SLP | 72.9 ± 0.3 | 309.1 ± 1.3 |
Tg value obtained from heat-cool-heat cycle inside the DSC at 2°C/min in crimped pans.
Physical Characterization of HME Systems
Attempts to extrude PVP with a low drug loading of 20% were unsuccessful. It is well known that the use of PVP in HME formulations is limited because of its high Tg (≈160°C) and low Tdeg that is below 180°C. Therefore, the incorporation of small molecules of API allows the polymer segments to have greater mobility because of plasticization effects and hence be extruded at lower temperatures.35 Studies with ibuprofen and ethyl cellulose showed that higher drug loadings of ibuprofen not only eased the extrusion behavior of ethyl cellulose by decreasing its Tg but also improved the physical properties of the prepared films.36,37 In the present study, the low drug loading of 20% (w/w) did not elicit a suitable plasticization effect for PVP and thus did not allow extrusion. However, when the drug loading was increased to 50% (w/w), the extrusion process was difficult but possible. As a result, the extrudates were prepared in block-like shape with a rough appearance instead of thin spaghetti-like strands as usually obtained in a smooth extrusion process. Despite these difficulties, this formulation (50% OLZ–PVP) appeared to be completely amorphous with a single Tg value and no evidence of recrystallization or melting of OLZ was seen when analyzed in DSC, as shown in Figure 4.
Figure 4.
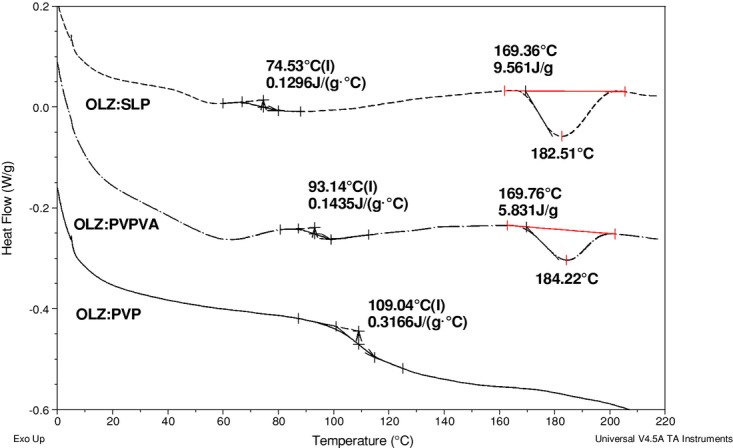
Differential scanning calorimetry curves of 50% drug-loaded formulations with SLP, PVPVA, and PVP (from top to bottom) extruded at 160°C and run at 10°C/min in crimped pans.
The data in Figure 4 show an initial water loss peak reflecting the approximately 1%–2% water content of these systems, as measured by TGA, followed by a glass transition and, in some cases, melting of the crystalline drug. Formulations of PVPVA and SLP with 20% drug loading were easily extruded even at 160°C as the Tg of these polymers is much lower (Tg (PVPVA) = 105°C; Tg (SLP) = 70°C). Therefore, their liquid-like state at that temperature allowed an appropriate mixing with OLZ and a consistent flow of the material through the barrel. However, in contrast to the 50% OLZ–PVP system, the 50% drug-loaded PVPVA and SLP formulations extruded at 160°C were not fully but only partially amorphous, which was confirmed by the melting of OLZ at ≈170°C.
The quantification of crystalline OLZ in those extrudates was calculated using calibration curves of the melting enthalpy of OLZ when physically mixed with PVPVA or SLP in different ratios, as shown in Figure 5. The percentage of drug crystallinity was calculated to be 14.5 ± 1.6% and 16.5 ± 0.1% for the OLZ–PVPVA and OLZ–SLP systems, respectively. These findings are evidence of the high solubilization effect of PVP previously predicted by the MPD and Hansen methods when compared with other polymers.
Figure 5.
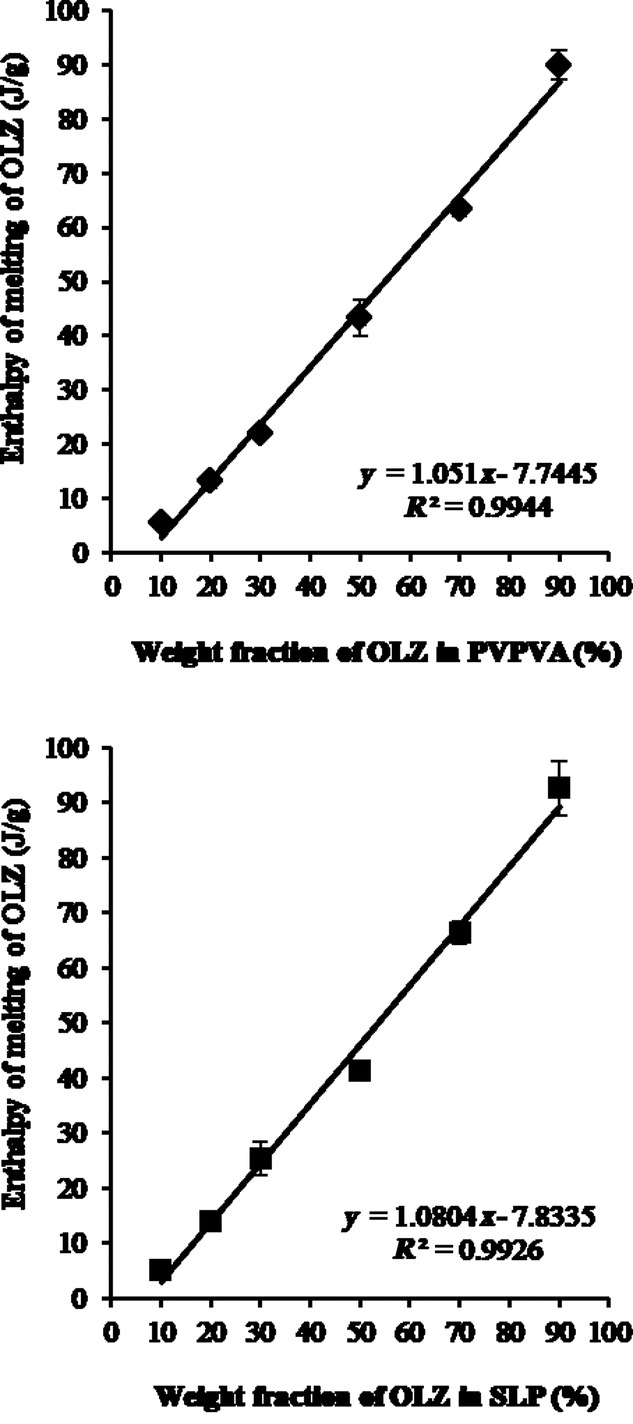
Calibration curves of the enthalpy of melting of OLZ in the presence of PVPVA (top) or SLP (bottom) versus the ratio of crystalline OLZ in the PMs. Measurements were carried out at 10°C/min in crimped pans. Error bars represent the range for n = 3 measurements.
In terms of the PVPVA and SLP systems with a 50% drug loading, when the temperature was increased to 180°C, fully amorphous solid dispersion systems were prepared without any evidence of crystalline OLZ observed in DSC. Figure 6 shows the measured Tg for all the formulated systems. The difference in the processing conditions (extrusion temperature) and consequently the existence of crystalline OLZ in the final extrudates did not have a great influence on the measured Tg of the PVPVA and SLP systems. As expected, 50% OLZ–PVP showed the highest Tg (≈108°C), followed by the formulations with PVPVA (≈90°C) and finally SLP (≈74°C).
Figure 6.
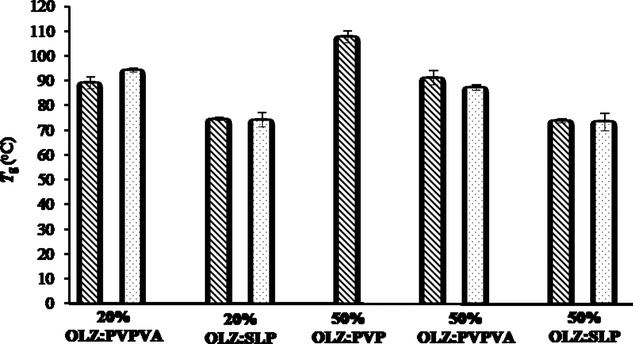
Measured Tg values for all the freshly prepared formulations using DSC (total heat flow) at 10°C/min in crimped pans. Dashed and dotted bars represent formulations extruded at 160°C and 180°C, respectively.
The DSC findings outlined above were supported by the XRPD studies that showed a considerable presence of crystalline OLZ (Fig. 7a) for the 50% drug-loaded PVPVA and SLP extruded at 160°C (Fig. 7b). Although the XRPD peaks in those systems were relatively broad and with significant background noise associated, it is still possible to confirm that the diffraction peaks did correspond to OLZ Form I. It was noted that the diffraction peaks were broader than for the pure drug, possibly indicating a reduction in crystal size. In contrast, no distinct intensity peaks were observed in the diffractograms of the PVP 50% and in all 20% extruded formulations, confirming the formation of fully amorphous solid dispersions.
Figure 7.
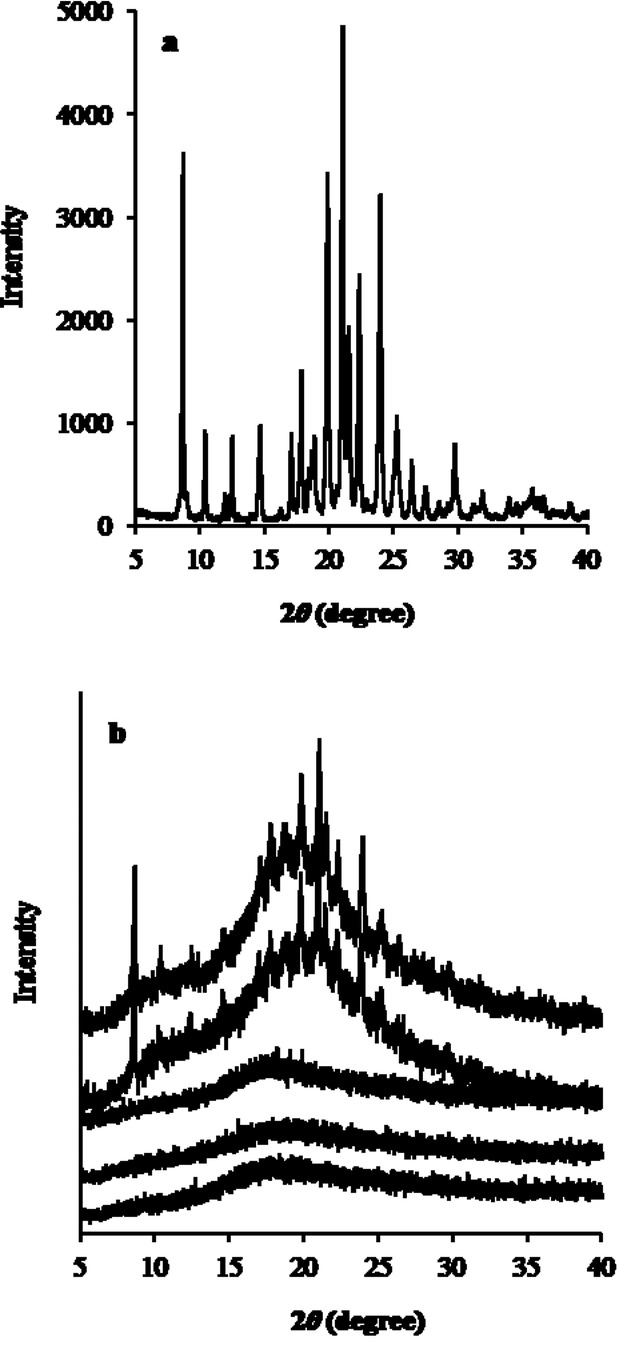
X-ray powder diffraction spectra of (a) pure OLZ and (b) 50% drug-loaded formulations from top to bottom: SLP, PVPVA, and PVP extruded at 160°C and SLP and PVPVA extruded at 180°C.
Figure 8 depicts the scanning electron micrographs of the surface and internal (cross-section surface) appearance of the 50% drug-loaded extrudates. The extrudates prepared with PVPVA and SLP at 160°C showed a distribution of OLZ crystals, either on the surface and cross-section, confirming the incomplete melting of the drug during extrusion. In contrast, the formulations extruded at 180°C showed a complete smooth surface without any evidence of crystalline OLZ. For the system prepared with PVP, although no crystals were identified, the surfaces of these extrudates were not completely smooth as a consequence of the difficult extrusion process of this formulation. For all the 20% drug-loaded formulations, no sign of crystallinity was observed (data not shown). These observations were therefore in complete agreement with the results obtained with DSC and XRPD.
Figure 8.
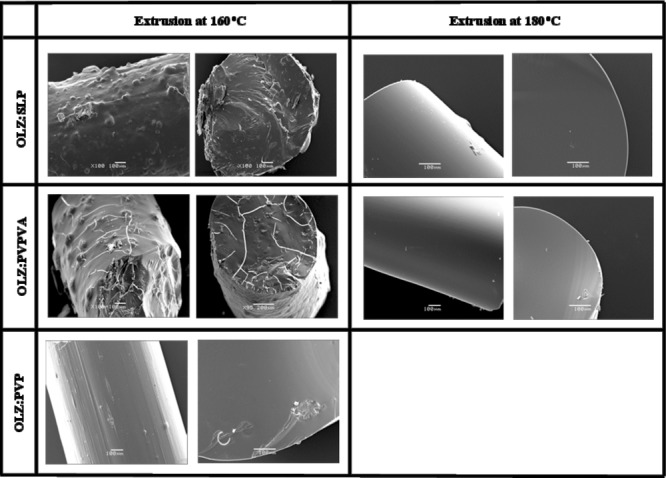
Photomicrographs of 1:1 fresh solid dispersion systems (surface and cross-section). Scale bar represents 100 μm.
Overall, following the physical characterization of the different solid dispersion systems prepared with OLZ, we can mainly divide them into two major groups:
Fully amorphous solid dispersions: 50% OLZ–PVP extruded at 160°C, 50% OLZ with PVPVA and SLP extruded at 180°C, and all the 20% drug-loaded formulations prepared with PVPVA and SLP;
Partially amorphous solid dispersions: 50% OLZ with PVPVA and SLP extruded at 160°C. NB author comment gap before and after on pdf larger than necessary
It is noted that the greater miscibility of OLZ with PVP, suggested by the MPD approach and solubility parameter calculations, is supported by these findings. The question then arises as to whether the variability in the degree of crystallinity will have an influence on the associated drug release behavior.
Dissolution Studies
The drug content of all formulations was at 95.6%–104.0% of the theoretical values. Figures 9 and 10 show the dissolution curves of pure OLZ and freshly prepared HME formulations at 50% and 20% drug loading, respectively. A significant enhancement in the dissolution rate was observed for all solid dispersion systems prepared by HME compared with the pure crystalline OLZ. More specifically, in the case of the 50% drug-loaded formulations, the T50 values were approximately 3 min for the dispersions with PVPVA and SLP (either extruded at 160°C or 180°C) compared with 10 min for the OLZ–PVP and finally 30 min for the drug alone. The formulations containing 20% OLZ extruded with PVPVA and SLP showed an even faster dissolution rate with T50 values between 1 and 2 min at both processing temperatures. It was interesting to observe in Figure 9 that with a constant drug loading (50%) and processing temperature (160°C), the decreasing order of drug release rate from different polymer-based systems was PVPVA (partially amorphous) > SLP (partially amorphous) > PVP (fully amorphous). This indicates that drug release may not always be faster from a fully amorphous state than a partially amorphous structure with crystal domains.
Figure 9.
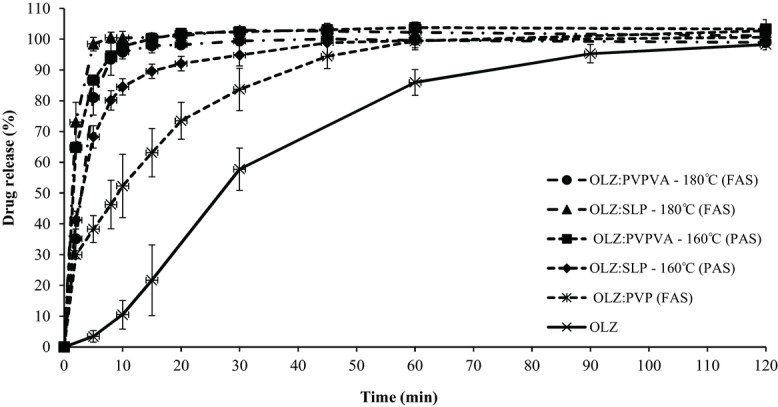
Dissolution profiles of pure OLZ and HME formulations with PVP, PVPVA, and SLP with 50% drug loading extruded at 160°C and 180°C (FAS, fully amorphous systems; PAS, partially amorphous systems). The legend on the right hand side follows the same order as the curves in the plot (top to bottom).
Figure 10.
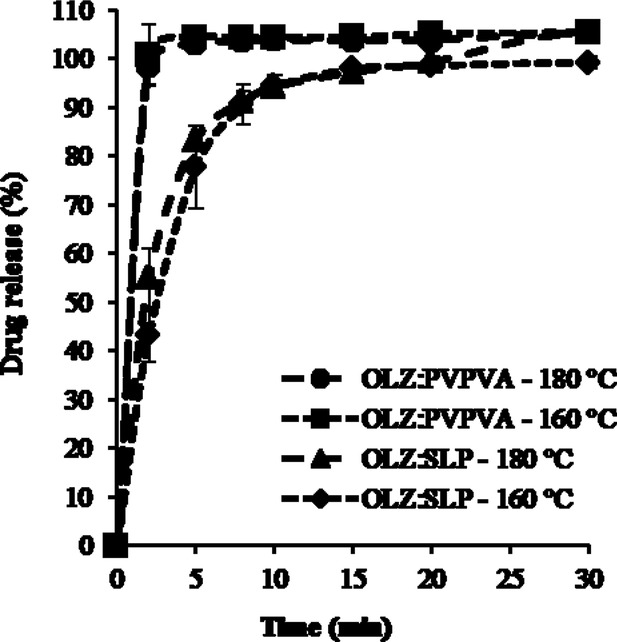
Dissolution profiles of 20% drug-loaded HME formulations with PVPVA and SLP extruded at 160°C and 180°C (all systems were characterized as fully amorphous systems). The legend on the right hand side follows the same order as the curves in the plot (top to bottom).
In addition, PVPVA and SLP systems extruded at the two different temperatures produced very similar dissolution profiles. More specifically, the similarity factor, f2, for the 50% OLZ–PVPVA systems was calculated to be 65.6, whereas for the case of OLZ–SLP f2 had a borderline value of 50.5. Nevertheless, in both cases, f2 was greater than 50 indicating that the release profile of the drug from the partially (extrusion at 160°C) and fully (extrusion at 180°C) amorphous solid dispersions was comparable in this specific case.
The dissolution curves of the 20% drug-loaded formulations extruded at the different temperatures were found to be superimposable for each polymer system (Fig. 10). Furthermore, the release profile was controlled by the type of polymer with the formulations prepared with SLP showing a slower release rate when compared with PVPVA. However, at this drug loading, fully amorphous solid solutions were obtained with both processing temperatures and therefore these results are not surprising.
DISCUSSION
Overall, the predicted miscibility and interaction between OLZ and each polymer calculated based on both MPD and Hansen solubility parameters agreed with the experimental results in that at the same extrusion temperature (160°C) and drug loading (50%); PVP was found to have the greatest miscibility with OLZ leading to the molecular dispersion of OLZ. In contrast, the formulations prepared with PVPVA and SLP, under the same conditions, crystalline OLZ was detected via DSC, XRPD, and SEM observations. At a higher extrusion temperature, both formulations with PVPVA and SLP were characterized as one-phase systems with a single Tg value observed in DSC. This therefore demonstrates the complex interplay between miscibility and processing but also demonstrates that there is a role for MPD and solubility parameter predictions in anticipating experimental findings.
In terms of the dissolution performance, the general assumption that a higher dissolution rate is obtained when the drug is completely converted to an amorphous form is not consistent with our findings. In this specific case, it was noted that at 50% loading and 160°C processing, PVP showed the slowest release despite being the only fully amorphous system. Clearly, therefore, the nature of the polymer is an important determinant of dissolution as well as the degree of crystallinity. However, what is particularly interesting is that the two 50% dispersions in PVPVA and SLP at 160°C and 180°C also showed no differences, despite these being the same polymers but with differing degrees of drug crystallinity.
Earlier work in the solid dispersion literature4,5 has suggested that dissolution rates of some or many binary systems may be determined by the dissolution of the carrier polymer and not the drug at all. More specifically, it has been suggested that the polymer may form a concentrated layer adjacent to the solid surface into which the drug may dissolve rapidly; hence, it is the dissolution of the polymer-rich layer that determines drug release and not the actual dissolution of the drug itself. The results presented here are consistent with this hypothesis; hence, we suggest that this is an area that requires further study, as at present the emphasis on storage stability has been focused on the physical characteristics of the drug and the tendency to phase separation. We suggest that it may in fact be the characteristics of the polymer that are changing and the drug structure may, in some cases at least, be incidental and irrelevant to performance.
CONCLUSIONS
In this study, we have shown that the differences in the physical structure of the extruded systems prepared with OLZ are a consequence of the physicochemical properties of the choice of polymer, the drug loading, and the processing temperature. We have demonstrated that MPD and solubility parameter approaches may play a role in predicting miscibility and that there is an interplay between processability and the tendency to form molecular dispersions, with low and high temperatures resulting in poor processing or degradation, respectively, whereas higher temperatures favor molecular dispersion. It was interesting to note that no clear relationship was found between dissolution and drug crystallinity or indeed with processing temperature, with the release rates being much more dependent on the choice of polymer. We suggest that, in this case at least, it may be the behavior of the polymer that determines dissolution performance rather than the physical state of the drug.
Acknowledgments
Fundação para a Ciência e a Tecnologia is acknowledged for a grant to M. F. Pina (SFRH/BD/46697/2008) and a grant to J. F. Pinto (PTDC/CTM/098688/2008).
REFERENCES
- 1.Chiou WL, Riegelman S. Pharmaceutical applications of solid dispersion systems. J Pharm Sci. 1971;60:1281–1302. doi: 10.1002/jps.2600600902. [DOI] [PubMed] [Google Scholar]
- 2.Janssens S, den Mooter G Van. Review: Physical chemistry of solid dispersions. J Pharm Pharmacol. 2009;61:1571–1586. doi: 10.1211/jpp/61.12.0001. [DOI] [PubMed] [Google Scholar]
- 3.Vasconcelos T, Sarmento B, Costa P. Solid dispersions as strategy to improve oral bioavailability of poor water soluble drugs. Drug Discov Today. 2007;12:1068–1075. doi: 10.1016/j.drudis.2007.09.005. [DOI] [PubMed] [Google Scholar]
- 4.Corrigan OI. Mechanisms of dissolution of fast release solid dispersions. Drug Dev Ind Pharm. 1985;11:697–724. [Google Scholar]
- 5.Craig DQM. The mechanisms of drug release from solid dispersions in water-soluble polymers. Int J Pharm. 2002;231:131–144. doi: 10.1016/s0378-5173(01)00891-2. [DOI] [PubMed] [Google Scholar]
- 6.Verheyen S, Blaton N, Kinget R, Den Mooter G Van. Mechanism of increased dissolution of diazepam and temazepam from polyethylene glycol 6000 solid dispersions. Int J Pharm. 2002;249:45–58. doi: 10.1016/s0378-5173(02)00532-x. [DOI] [PubMed] [Google Scholar]
- 7.Crowley MM, Zhang F, Repka MA, Thumma S, Upadhye SB, Battu SK, McGinity JW, Martin C. Pharmaceutical applications of hot-melt extrusion: Part I. Drug Dev Ind Pharm. 2007;33:909–926. doi: 10.1080/03639040701498759. [DOI] [PubMed] [Google Scholar]
- 8.Repka MA, Battu SK, Upadhye SB, Thumma S, Crowley MM, Zhang F, Martin C, McGinity JW. Pharmaceutical applications of hot-melt extrusion: Part II. Drug Dev Ind Pharm. 2007;33:1043–1057. doi: 10.1080/03639040701525627. [DOI] [PubMed] [Google Scholar]
- 9.Burns MJ. The pharmacology and toxicology of atypical antipsychotic agents. J Toxicol Clin Toxicol. 2001;39:1–14. doi: 10.1081/clt-100102873. [DOI] [PubMed] [Google Scholar]
- 10.Thakuria R, Nangia A. Polymorphic form IV of olanzapine. Acta Crystallographica Section C. 2011;67:o461–o463. doi: 10.1107/S0108270111043952. [DOI] [PubMed] [Google Scholar]
- 11.SM Reutzel-Edens, Bush JK, Magee PA, Stephenson GA, Byrn SR. Anhydrates and hydrates of olanzapine: Crystallization, solid-state characterization, and structural relationships. Cryst Growth Des. 2003;3:897–907. [Google Scholar]
- 12.Bhardwaj RM, Price LS, Price SL, SM Reutzel-Edens, Miller GJ, Oswald IDH, Johnston BF, Florence AJ. Exploring the experimental and computed crystal energy landscape of olanzapine. Cryst Growth Des. 2013;13:1602–1617. [Google Scholar]
- 13.Moneghini M, Carcano A, Zingone G, Perissutti B. Studies in dissolution enhancement of atenolol. Part I. Int J Pharm. 1998;175:177–183. [Google Scholar]
- 14.Hülsmann S, Backensfeld T, Keitel S, Bodmeier R. Melt extrusion—An alternative method for enhancing the dissolution rate of 17β-estradiol hemihydrate. Eur J Pharm Biopharm. 2000;49:237–242. doi: 10.1016/s0939-6411(00)00077-1. [DOI] [PubMed] [Google Scholar]
- 15.Tantishaiyakul V, Kaewnopparat N, Ingkatawornwong S. Properties of solid dispersions of piroxicam in polyvinylpyrrolidone K-30. Int J Pharm. 1996;143:59–66. doi: 10.1016/s0378-5173(99)00070-8. [DOI] [PubMed] [Google Scholar]
- 16.Tantishaiyakul V, Kaewnopparat N, Ingkatawornwong S. Properties of solid dispersions of piroxicam in polyvinylpyrrolidone. Int J Pharm. 1999;181:143–151. doi: 10.1016/s0378-5173(99)00070-8. [DOI] [PubMed] [Google Scholar]
- 17.Konno H, Taylor LS. Influence of different polymers on the crystallization tendency of molecularly dispersed amorphous felodipine. J Pharm Sci. 2006;95:2692–2705. doi: 10.1002/jps.20697. [DOI] [PubMed] [Google Scholar]
- 18.Trasi NS, Taylor LS. Effect of polymers on nucleation and crystal growth of amorphous acetaminophen. CrystEngComm. 2012;14:5188–5197. [Google Scholar]
- 19.Callahan JC, Cleary GW, Elefant M, Kaplan G, Kensler T, Nash RA. Equilibrium moisture-content of pharmaceutical excipients. Drug Dev Ind Pharm. 1982;8:355–369. [Google Scholar]
- 20.Bühler V. Polyvinylpyrrolidone excipients for pharmaceuticals: Povidone, crospovidone, and copovidone. Berlin, Germany: Springer; 2005. [Google Scholar]
- 21.Marsac P, Li T, Taylor L. Estimation of drug–polymer miscibility and solubility in amorphous solid dispersions using experimentally determined interaction parameters. Pharm Res. 2009;26:139–151. doi: 10.1007/s11095-008-9721-1. [DOI] [PubMed] [Google Scholar]
- 22.Marsac P, Shamblin S, Taylor L. Theoretical and practical approaches for prediction of drug-polymer miscibility and solubility. Pharm Res. 2006;23:2417–2426. doi: 10.1007/s11095-006-9063-9. [DOI] [PubMed] [Google Scholar]
- 23.Kontogeorgis GM. The Hansen solubility parameters (HSP) in thermodynamic models for polymer solutions. In: Hansen CM, editor. Hansen solubility parameters, a user's handbook. 2. London, UK: CRC Press; 2007. pp. 75–93. Hansen CM, Ed. [Google Scholar]
- 24.Hansen CM. Solubility parameters—An introduction. In: Hansen CM, editor. Hansen solubility parameters, a user's handbook. 2. London, UK: CRC Press; 2007. pp. 1–24. Hansen CM, Ed. [Google Scholar]
- 25.DWv Krevelen, Nijenhuis KT. Properties of polymers, 4th Edition. Oxford, UK: Elsevier; 2009. [Google Scholar]
- 26.Baird JA, Taylor LS. Evaluation of amorphous solid dispersion properties using thermal analysis techniques. Adv Drug Del Rev. 2012;64:396–421. doi: 10.1016/j.addr.2011.07.009. [DOI] [PubMed] [Google Scholar]
- 27.FDA. 1997. Guidance for Industry: Dissolution Testing of Immediate Release Solid Oral Dosage Forms U.S. Department of Health and Human Services Food and Drug Administration Center for Drug Evaluation and Research (CDER). http://www.fda.gov/downloads/Drugs/GuidanceComplianceRegulatoryInformation/Guidances/ucm070237.pdf.
- 28.Flory PJ. Thermodynamics of high polymer solutions. J Chem Phys. 1942;10:51–61. [Google Scholar]
- 29.Qian F, Huang J, Hussain MA. Drug–polymer solubility and miscibility: Stability consideration and practical challenges in amorphous solid dispersion development. J Pharm Sci. 2010;99:2941–2947. doi: 10.1002/jps.22074. [DOI] [PubMed] [Google Scholar]
- 30.Greenhalgh DJ, Williams AC, Timmins P, York P. Solubility parameters as predictors of miscibility in solid dispersions. J Pharm Sci. 1999;88:1182–1190. doi: 10.1021/js9900856. [DOI] [PubMed] [Google Scholar]
- 31.Forster A, Hempenstall J, Tucker I, Rades T. Selection of excipients for melt extrusion with two poorly water-soluble drugs by solubility parameter calculation and thermal analysis. Int J Pharm. 2001;226:147–161. doi: 10.1016/s0378-5173(01)00801-8. [DOI] [PubMed] [Google Scholar]
- 32.Hancock BC, York P, Rowe RC. The use of solubility parameters in pharmaceutical dosage form design. Int J Pharm. 1997;148:1–21. [Google Scholar]
- 33.Zhao Y, Inbar P, Chokshi HP, Malick AW, Choi DS. Prediction of the thermal phase diagram of amorphous solid dispersions by Flory–Huggins theory. J Pharm Sci. 2011;100:3196–3207. doi: 10.1002/jps.22541. [DOI] [PubMed] [Google Scholar]
- 34.Srinarong P, Waard H De, Frijlink HW, Hinrichs WLJ. Improved dissolution behavior of lipophilic drugs by solid dispersions: The production process as starting point for formulation considerations. Expert Opin Drug Deliv. 2011;8:1121–1140. doi: 10.1517/17425247.2011.598147. [DOI] [PubMed] [Google Scholar]
- 35.Lakshman JP, Cao Y, Kowalski J, Serajuddin ATM. Application of melt extrusion in the development of a physically and chemically stable high-energy amorphous solid dispersion of a poorly water-soluble drug. Mol Pharm. 2008;5:994–1002. doi: 10.1021/mp8001073. [DOI] [PubMed] [Google Scholar]
- 36.Brabander C De, Vervaet C, Remon JP. Development and evaluation of sustained release mini-matrices prepared via hot melt extrusion. J Control Release. 2003;89:235–247. doi: 10.1016/s0168-3659(03)00075-0. [DOI] [PubMed] [Google Scholar]
- 37.Brabander C De, Den Mooter G Van, Vervaet C, Remon JP. Characterization of ibuprofen as a nontraditional plasticizer of ethyl cellulose. J Pharm Sci. 2002;91:1678–1685. doi: 10.1002/jps.10159. [DOI] [PubMed] [Google Scholar]


