Abstract
Purpose:
Quantitative analysis of right ventricle (RV) motion is important for study of the mechanism of congenital and acquired diseases. Unlike left ventricle (LV), motion estimation of RV is more difficult because of its complex shape and thin myocardium. Although attempts of finite element models on MR images and speckle tracking on echocardiography have shown promising results on RV strain analysis, these methods can be improved since the temporal smoothness of the motion is not considered.
Methods:
The authors have proposed a temporally diffeomorphic motion estimation method in which a spatiotemporal transformation is estimated by optimization of a registration energy functional of the velocity field in their earlier work. The proposed motion estimation method is a fully automatic process for general image sequences. The authors apply the method by combining with a semiautomatic myocardium segmentation method to the RV strain analysis of three-dimensional (3D) echocardiographic sequences of five open-chest pigs under different steady states.
Results:
The authors compare the peak two-point strains derived by their method with those estimated from the sonomicrometry, the results show that they have high correlation. The motion of the right ventricular free wall is studied by using segmental strains. The baseline sequence results show that the segmental strains in their methods are consistent with results obtained by other image modalities such as MRI. The image sequences of pacing steady states show that segments with the largest strain variation coincide with the pacing sites.
Conclusions:
The high correlation of the peak two-point strains of their method and sonomicrometry under different steady states demonstrates that their RV motion estimation has high accuracy. The closeness of the segmental strain of their method to those from MRI shows the feasibility of their method in the study of RV function by using 3D echocardiography. The strain analysis of the pacing steady states shows the potential utility of their method in study on RV diseases.
Keywords: motion estimation, strain analysis, 3D echocardiography, temporally diffeomorphic registration
1. INTRODUCTION
Study of the right ventricle (RV) function is important for understanding the mechanism of congenital heart disease,1,2 pulmonary hypertension,3 cardiomyopathy,4 and biventricular relation.5,6 Motion analysis is critical for study of RV function since its motion abnormality is an important indicator of these conditions.7 Although large amount of quantitative motion analysis methods on the left ventricle (LV) has been reported,8–10 studies of RV motion mostly focus on qualitative analysis.11–16 Quantitative analysis of RV motion is more difficult because of its irregular shape, trabeculated endocardium, and thin myocardium wall in the image.
Early attempts for RV strain analysis were made by using MRI. Tagged-MRI provides intrinsic tagged-lines which can be used to estimate RV strains. 1D tagged-lines have been used to estimate the RV regional shortening in 2D planes.17–19 3D modeling has been used for RV motion estimation in later works. Young et al.20 used a finite element based method to track the mid myocardium surface motion from tagged-MR image sequences. Haber et al.21 used a volumetric finite element model to analyze the 3D motion of the myocardium from tagged-MR images. Tustison and Amini22 proposed a nonuniform rational B-spline based biventricular model and its parameters were estimated by fitting them to the corresponding points extracted from the tagged-lines and the contours.
Recently, with the development of transducer and computing technology, echocardiography has become one of the fastest-growing image modalities to study the RV motion.23 It has advantages over other modalities in terms of its availability, portability, low cost, and minimal adverse secondary effects. Tissue Doppler imaging (TDI) has been a popular method to estimate the RV strain24–28 because it can effectively provide quantitative evaluation of myocardial dynamics. However, this technique is angle-dependent so that only strains along directions which are parallel to the ultrasound wave propagation can be estimated. It is difficult to evaluate the strains along different directions within one image sequence. Alignment of the strain estimations of different view directions is difficult and tedious. Speckle tracking image (STI) has been an alternative technique to analysis the RV strains.6,29–34 It depends on the assumption that the speckle pattern in the consecutive frames is preserved.35,36 Most of the above studies use 2D echocardiography because of its high temporal resolution. It has limitations that the through-plane motion cannot be estimated and low efficiency in analyzing the whole RV volume. 3D echocardiography can provide a unified framework to estimate in-plane and through-plane strains and one-time strain analysis of the whole RV. However, 3D speckle tracking is challenging because the increased image size reduces the spatial and temporal resolutions so that the speckle patterns are not stable in consecutive frames.36–38 3D speckle tracking of the RV is even more challenging in several points. First, RV has a very complex shape. Shape modeling methods in LV such as truncated ellipse or superquadrics8 do not work for RV analysis. Second, the endocardium rich of highly variable trabeculae muscles and the thin myocardial wall lead to fuzzy boundary and further degrade the STI quality, which means that higher tracking ability is required in RV analysis.
In our earlier work, we have proposed a temporally diffeomorphic motion estimation method for RV strain analysis and presented preliminary results in the conference of Functional Imaging and Modeling of the Heart (FIMH’13).39 To our best knowledge, it is the first time that the full volume 3D echocardiography sequences are used to estimate the right ventricular free wall (RVFW) strains. In this study, we extend the RVFW modeling and present more detailed segmental strain results. We first validate the accuracy of our motion estimation method using sonomicrometry. Then we apply the method to image sequences of five open-chest pigs under different steady states. The steady states include baseline under normal condition and those induced by stimulating the RV myocardial wall from the different pacing sites. The RVFW is divided into 12 segments and the average segmental strains along the radial (RS), circumferential (CS), and longitudinal (LS) directions and the principal strains are analyzed. We present the difference of the average segmental strains in each steady states and possible explanation in biomechanics are made.
2. METHOD
2.A. Diffeomorphic motion estimation
We provide a review of the diffeomorphic registration based motion estimation method proposed in our earlier work. Assume that we have an image sequence In, n = 0, 1, …, Ns. We embed it into a time range of [0, T], T = Ns − 1, with each frame sequentially located at the integer time points. The diffeomorphism is defined by a velocity field with a differential equation of dϕ/dt = v(ϕ(x, t), t), ϕ(x, 0) = x, with t ∈ [0, T] and x ∈ Ω ⊂ R3. The deformation between any two time points is a diffeomorphism if the velocity field v is smooth. The motion estimation problem is stated as an optimization of a variational energy of the velocity field v(x, t)
| (1) |
with the first term being a regularizer to evaluate the spatiotemporal smoothness and the second term being a similarity measurement which evaluates the summed squared difference (SSD) of the voxel intensity between In−1 and the unwarped frame In(ϕn−1,n), with ϕn−1,n being the deformation from In−1 to In. The regularization term is defined as weighted sum of a spatial and a temporal regularization term
| (2) |
with the first term being the magnitude of second order spatial derivative of the velocity field, which is denoted as Esr, and the second term being the second order time derivative of the velocity field, which is denoted as Etr. Optimization of Eq. (1) searches a spatiotemporally smooth function which minimizes the SSD similarity between all consecutive frames.
The optimization is solved by using numerical method. We use a parameterized function for velocity field.40,41 It is discretized temporally into a series of 3D cubic B-spline functions at time tk, k = 0, 1, …, Nt, tk = kΔt, Δt = 1/Nf, with Nf being the number of time steps between two consecutive frames and Nt = Nf∗(Ns − 1) being the total number of B-spline functions. The B-spline function at time point tk is defined as v(x, tk) = ∑cm;kβ(x − xm), with cm;k being the control vectors located on a uniform grid of xm at tk and β(x − xm) being the 3D B-spline kernel function at xm which is the tensor product of the 1D B-spline functions. Then ϕ(x, t) can be expressed as the forward Euler integral of velocity field v(x, t) by assuming that the velocity of each point is piecewise constant within a time step. The transformation ϕ0, tk is related with ϕ0, tk−1 by
| (3) |
with Id being the identity transformation and vk = v(x, tk) the velocity field at tk. The transformation ϕn−1,n is denoted by composition of all small deformation under the velocity field between time t(n−1)∗Nf and tn∗Nf
| (4) |
By using Eq. (4), each SSD summand term in Eq. (1) is related only to the velocity field parameters within the time of consecutive frames, so the derivative of the each SSD summand with respect to the velocity field can be evaluated independently. The temporal regularization term at a time point [Eq. (2)] makes the velocity field temporally second-order smooth and its derivative with respect to velocity field parameters at the time point depends on the velocity field parameters before and after it. The integral of the temporal regularization at all time points makes the velocity field to be globally smooth.
2.B. Optimization
We use the steepest descent method to optimize Eq. (1).
The derivatives of the total energy with respect to the B-spline parameters are calculated analytically. The derivative of ESSD(In−1(x), In(ϕn−1,n)) with respect to the B-spline parameters cm;k is
 |
(5) |
with Ωs being the domain which is controlled by cm;k and for other value of k the derivative is zero. For the derivative of the spatial regularization with respect to the pth component of cm;k, we have
| (6) |
For the derivative of the temporal regularization term, we approximate the result by assuming the small displacement between two time steps
| (7) |
2.C. Strain analysis
We use Green–Lagrange strain42 in our study and the strain tensor is defined by
| (8) |
with F being the transformation gradient matrix (Jacobian matrix) and I being the 3 × 3 identity matrix. The strainalong direction d is estimated by projecting the strain tensor to it using equation
| (9) |
It reflects the elongation of an elastic body along the direction d. In cardiac function analysis, we usually evaluate strains in local cardiac coordinate system along RS, CS, and LS directions.
In addition to the strains estimated along directions of local cardiac coordinate axes, the principal strains are also frequently used. Principal strains are estimated by projecting the strain tensor along the directions of its eigenvectors. The eigenvectors describe a coordinate system in which there are only normal strain components and no shear strain components. In our study, we denote the three principal strains as E1 (maximum principal strain), E2 (secondary principal strain), and E3 (minimum principal strain) in descending order of the eigenvalues. The E1 and E3 define the largest and smallest stretch of the elastic body.
2.D. Implementation
In our implementation, we used a series of B-spline transformations with grid spacing of six voxels in each dimension to represent the velocity field. The values of λ and wt were experimentally chosen to be 0.01 and 0.001. The algorithm was implemented in matlab (Ref. 43) with a Windows XP 64-bit system on an eight-core 2.13 GHz Xeon CPU machine with 30GB RAM. The most frequently called subroutines such as the 3D B-spline interpolation of the displacement field and the trilinear interpolation of the image were implemented by using OpenMP44 to effectively support multiprocessors. The typical execution time for a 3D sequence of 24 frames with frame size of 131 × 123 × 104 was about 2 h.
3. DATASETS AND EXPERIMENT
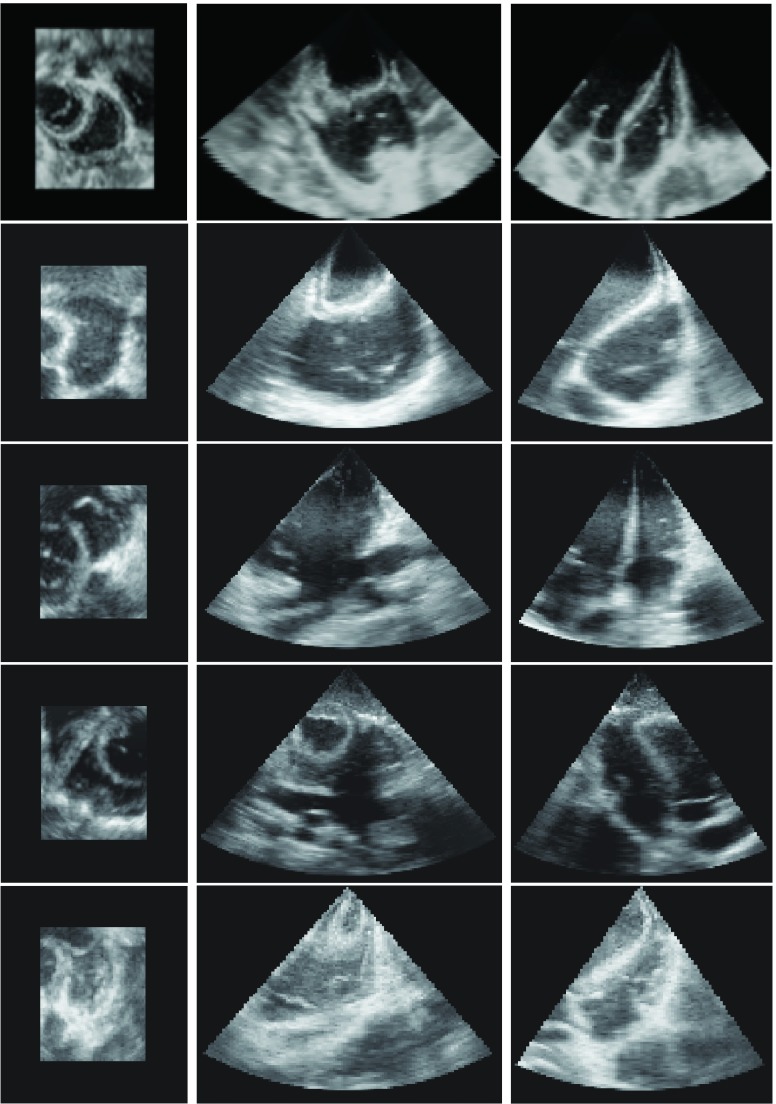
We validated the motion estimation method by using 3D echocardiography sequences of five open-chest young adult pigs (about 15 Kg) under different steady states. Each pig was placed in supine position during the experiment under anesthesia. A median sternotomy was performed under hemodynamic monitoring and the pericardium was split from apex to base to expose the heart. All experiments were approved by the institutional animal care and use committee. We acquired image sequences of steady states of baseline under normal condition and three others with a pacemaker connected to the myocardium. In this study, we used pacing sites at RV, RV apex, and RV outflow duct (RVOT), respectively. We used the Medtronic45 5348 single chamber temporary pacemaker for our experiment. There was at least 15 min to recover to normal after each pacing steady state. The images were acquired by using a Philips IE33 system with an X7-2 matrix array transducer transmitting at a frequency of 3.5 MHz. ECG-gating is used to combine a series of wedge-shaped subvolumes to create reconstructed full volume image. The average frame rate of the ECG-gating is 33 (FPS). A typical echocardiography sequence has 24 frames with frame size 131 × 123 × 104 and voxel size of 0.96 mm3. The 3D orthogonal views of the end-diastolic (ED) frames of the five pigs are shown in Fig. 1.
FIG. 1.
The axial, sagittal, and coronal views of the ED frame of the five open-chest pigs.
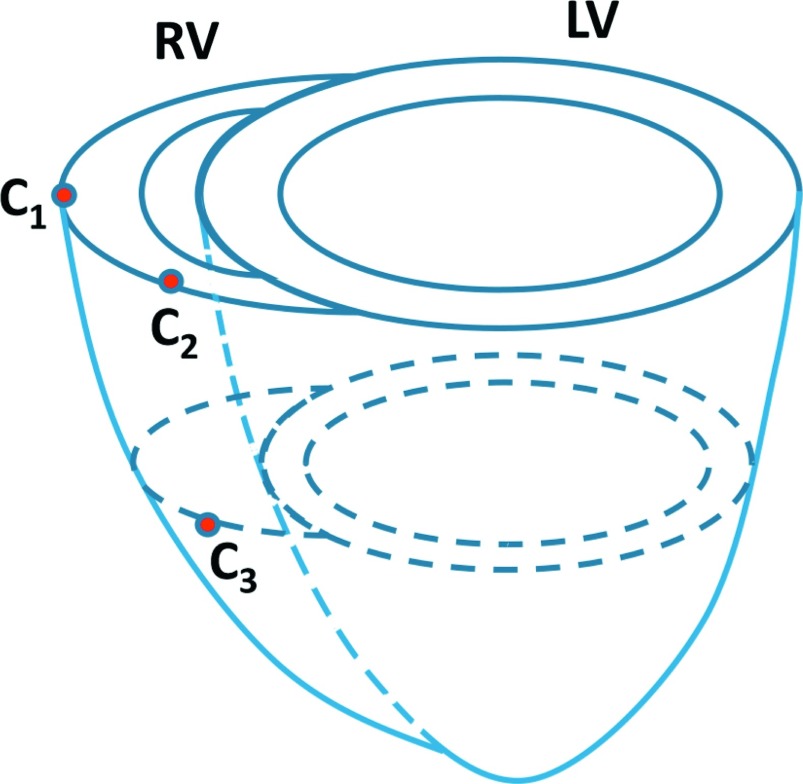
We first validated the RV motion estimation method by using sonomicrometry.46 Sonomicrometry utilizes piezoelectric transducers (crystals) to measure distances within the myocardium. We implanted three sonomicrometers in the myocardium of each pig. The position of the sonomicrometers is illustrated in Fig. 2. For each steady state, two pairs of points distance (C1 − C2, C2 − C3) varying with time were recorded with a 70 Hz sample rate in the sonomicrometry by using SonoSOFT software (Sonometrics46). At least three cardiac cycles were recorded. Digital data were inspected for correct identification of end-diastolic and end-systolic points using SonoView software (Sonometrics) and then the data of three cardiac cycles were averaged. The echocardiography image sequence was acquired immediately after the record of the sonomicrometry. The sonomicrometry distances data were interpolated to have same number of samples as the number of echocardiography frame. We compared the image-derived peak two-point strains, which were defined as the ratio of the maximum relative shortening to the initial distance, with those derived from sonomicrometry.
FIG. 2.
Illustration of the sonomicrometer positions on the myocardium.
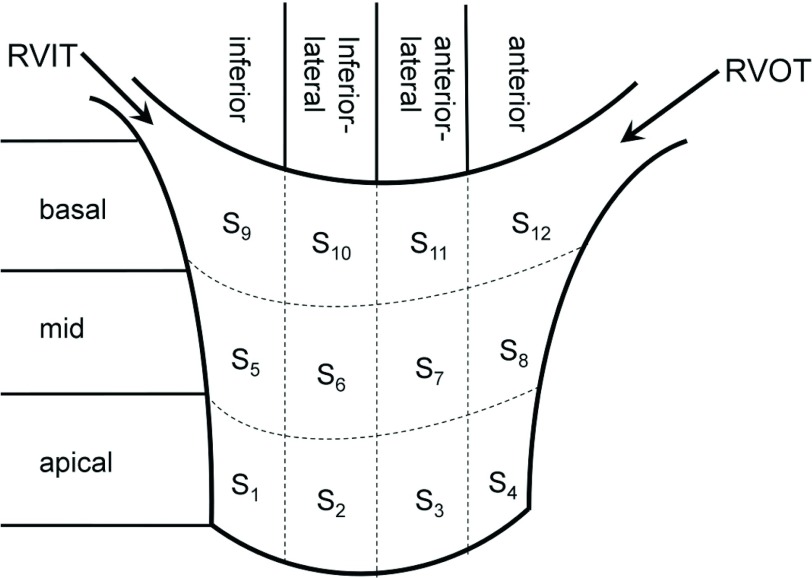
Subsequently, we evaluated the strain on RV myocardium under different steady states. The variation of the strain patterns in different steady states was analyzed. For each steady state, we used an affine registration to normalize the RV pose of the five pigs. The image sequence of one pig was chosen as the reference, and the image sequences of other four pigs were aligned with the reference sequence so that the RV short-axis and long-axis planes were parallel with the xy-plane and the z-axis, respectively, in all sequences. The RV endocardium and epicardium in the ED frame were segmented using a semiautomatic method. The short-axis segmentation begins from the most apical plane to the plane where tricuspid valve appears. We first labeled the contours of the RV endocardium and epicardium in each short-axis planes by using smooth and closed B-spline curves. We manually picked some points along the RV endocardium and epicardium and then a constant number of points were uniformly sampled on each contours (see Fig. 4 as an example of endocardium segmentation). Triangle meshes were then generated by connecting points in each two neighboring contours anticlockwisely. Transmurally intermediate meshes were interpolated linearly from the endocardium to the epicardium. In order to analyze the RVFW strain in detail, the RVFW was divided horizontally as inferior, inferiorlateral, anteriorlateral, and anterior (1, 2, 3, 4) and vertically as apical, mid, and basal (1, 2, 3) segments. The specific names and positions of the 12 RV segments used in our study are shown in Fig. 3.
FIG. 4.
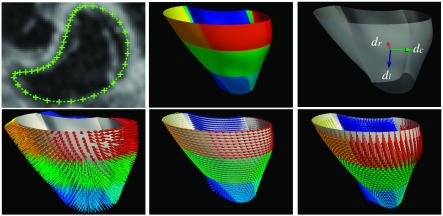
The cardiac coordinate system in our experiments. The left top figure shows the endocardium contour. The mid top figure shows the 12 endocardium segments in colors. The top right figure shows the radial (dr), circumferential (dc), and longitudinal (dl) directions in a vertex of the endocardium. The bottom row shows the dr, dc, and dl directions in all mesh vertices.
FIG. 3.
The names and positions of 12 RV segments used in our study.
In order to evaluate the strains by using Eq. (9), we need to define radial, circumferential, and longitudinal directions at each vertex of the triangle mesh. The radial direction dr of a vertex was defined as the averaged normal direction of the triangles which joined at the vertex. We defined the normal direction of short-axis planes as nsa, the circumferential direction dc was defined as the cross-product of nsa with dr, and the longitudinal direction was defined as the cross-product of dr with dc. We illustrate the cardiac coordinate system in Fig. 4 and the bottom row of it shows the three orthogonal directions in an example RV mesh.
4. RESULTS
4.A. Validation with sonomicrometry
We first show the result of the sonomicrometry validation in Fig. 5. The left figure shows the scatter plot of the 40 peak two-point strains estimated from our method and those from the sonomicrometry. The 40 peak strains in each measurement come from the two point pairs in each of the five pigs under the four steady states. The correlation between the peak strains is 0.82. The middle and right plots show two example two-point strain curves in sonomicrometry and in our methods. We can see the curves are similar. The correlations of the sono strain curve with the echocardiography strain curve are 0.91 and 0.92, indicate that our method has good temporal consistency with the ground truth.
FIG. 5.

The result from the sonomicrometry validation. Left figure shows the peak two-point strains estimated from the sonomicrometry and echocardiography. The middle and right figures show the correlation between the sonomicrometry-derived and echocardiography-derived two-point strains of two pairs of sonomicrometers.
4.B. Global motion
The global motion was measured by the displacement field. A typical RV myocardium point trajectories in 2D orthogonal planes in a cardiac cycle and the 3D myocardium points displacement at end-systole (ES) are shown in Fig. 6. We can see that the estimated point trajectories are spatiotemporally smooth. The motion of myocardium points is mainly along the radial and longitudinal directions. The average segmental displacements in five pigs are listed in Table I. The numbers show that the average displacement is dominant in the radial and longitudinal directions while the circumferential displacement is smaller. Among the radial and longitudinal directions, the displacement increases in order of apical, mid, and basal segments. The magnitude of the displacement also increases from apical to the basal segments.
FIG. 6.
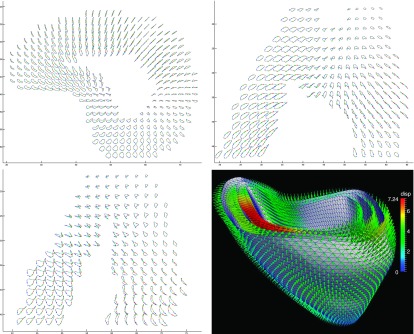
The myocardium point trajectories in the 2D orthogonal views and the 3D displacement field in the ES (arrow points from the ED coordinates to the ES coordinates).
TABLE I.
The average radial, circumferential, longitudinal, and total displacement (mm) of five pigs in 12 segments at ES. The displacement is represented in form of mean(SD). S1 to S12 stand for the RVFW segments. , , and are the mean displacements of the apical, mid, and basal segments.
| Apex | Mid | Base | |||||||||||||
|---|---|---|---|---|---|---|---|---|---|---|---|---|---|---|---|
| Displacement | S1 | S2 | S3 | S4 | S5 | S6 | S7 | S8 | S9 | S10 | S11 | S12 | |||
| Radial | 1.82 | 1.55 | 1.00 | 0.81 | 1.29 | 1.89 | 2.88 | 2.61 | 1.51 | 2.22 | 1.75 | 3.12 | 2.95 | 1.26 | 2.27 |
| (1.25) | (0.63) | (1.06) | (0.51) | (0.92) | (1.06) | (0.97) | (0.53) | (0.88) | (0.97) | (1.22) | (1.32) | (0.56) | (0.39) | (1.18) | |
| Circumferential | −0.46 | 0.49 | 0.71 | 1.01 | 0.44 | −1.41 | 0.07 | 1.03 | 0.92 | 0.15 | −1.27 | −0.37 | 0.70 | −0.09 | −0.26 |
| (1.07) | (1.15) | (0.44) | (0.77) | (0.99) | (1.11) | (1.63) | (1.08) | (0.90) | (1.48) | (0.90) | (2.16) | (1.10) | (1.01) | (1.44) | |
| Longitudinal | 0.57 | 0.64 | 0.62 | 0.43 | 0.56 | 1.72 | 1.48 | 1.52 | 1.13 | 1.47 | 2.07 | 2.29 | 1.95 | 1.32 | 1.91 |
| (0.83) | (0.53) | (0.60) | (0.61) | (0.59) | (1.77) | (1.31) | (1.51) | (0.83) | (1.27) | (0.58) | (1.12) | (2.10) | (1.63) | (1.37) | |
| Magnitude | 2.50 | 2.08 | 1.68 | 1.63 | 1.97 | 3.42 | 3.79 | 3.74 | 2.56 | 3.38 | 3.48 | 4.62 | 4.21 | 2.72 | 3.76 |
| (1.54) | (0.91) | (0.94) | (0.78) | (1.03) | (1.75) | (1.38) | (0.66) | (0.73) | (1.21) | (0.79) | (1.44) | (1.03) | (0.76) | (1.20) | |
4.C. Local motion
The local motion of RVFW was described by its segmental strains. We obtained similar ES segmental strain patterns for the five pigs. The average segment RS, CS, and LS are shown in Table II. We can see that RS and CS decrease in order of mid, basal, and apical segments. The LS decreases in order of mid, apical, and basal segments in the endocardium, while in the midwall and epicardium it decreases in order of apical, mid, and basal segments. The RS increases from the endocardium through the midwall to the epicardium in apical segments, while in the mid and basal segments, midwall have the largest RS, followed by the epicardium and endocardium. The six lateral segments (S2, S3, S6, S7, S10, S11) have much larger RS than the other side segments. This indicates that RS is stimulated from the mid segments of the midwall. The CS and LS decrease from endocardium through the midwall to the epicardium. This indicates that the LS and CS are stimulated from the endocardium segments.
TABLE II.
The average RS, CS, and LS (%) in the 12 segments of five pigs at ES. The strains are in form of mean(SD). S1 to S12 stand for the RVFW segments. , , and are the mean of the four apical, mid, and basal segments.
| Apex | Mid | Base | ||||||||||||||
|---|---|---|---|---|---|---|---|---|---|---|---|---|---|---|---|---|
| Strains | S1 | S2 | S3 | S4 | S5 | S6 | S7 | S8 | S9 | S10 | S11 | S12 | ||||
| Endo | 9.0 | 18.1 | 10.3 | 11.6 | 12.3 | 8.6 | 35.5 | 23.5 | 13.5 | 20.3 | 4.8 | 32.6 | 24.2 | 3.8 | 16.4 | |
| (13.0) | (17.7) | (5.8) | (9.9) | (11.7) | (9.6) | (21.5) | (19.0) | (19.5) | (19.3) | (9.5) | (6.8) | (11.3) | (21.5) | (17.6) | ||
| RS | Midwall | 13.2 | 25.4 | 15.4 | 15.3 | 17.3 | 15.6 | 48.3 | 43.6 | 22.6 | 32.5 | 13.8 | 47.1 | 29.9 | 4.5 | 23.8 |
| (14.1) | (18.7) | (8.1) | (14.1) | (13.7) | (10.1) | (18.1) | (20.4) | (27.9) | (22.9) | (9.4) | (7.5) | (10.5) | (19.9) | (20.3) | ||
| Epi | 17.1 | 26.4 | 18.9 | 14.8 | 19.3 | 19.8 | 40.9 | 39.8 | 19.3 | 30.0 | 18.9 | 36.7 | 22.4 | 0.5 | 19.4 | |
| (15.7) | (14.1) | (12.5) | (12.4) | (13.1) | (10.4) | (11.8) | (13.4) | (27.4) | (18.8) | (12.1) | (3.4) | (5.2) | (13.7) | (16.2) | ||
| Endo | −7.0 | −12.3 | −10.2 | −6.4 | −9.0 | −12.3 | −14.7 | −18.9 | −13.2 | −14.8 | −15.1 | −11.3 | −15.6 | −7.5 | −12.3 | |
| (4.5) | (3.7) | (2.1) | (2.4) | (3.9) | (3.7) | (3.4) | (2.3) | (2.9) | (3.8) | (4.9) | (8.0) | (3.3) | (7.9) | (6.6) | ||
| CS | Midwall | −3.9 | −10.2 | −7.6 | −5.7 | −6.9 | −8.9 | −10.2 | −13.4 | −8.6 | −10.3 | −11.2 | −6.3 | −11.8 | −7.1 | −9.1 |
| (5.9) | (3.7) | (2.0) | (2.8) | (4.3) | (4.4) | (4.0) | (1.8) | (3.5) | (3.7) | (5.3) | (8.2) | (4.5) | (4.3) | (5.8) | ||
| Epi | −2.6 | −7.9 | −5.2 | −5.0 | −5.2 | −6.3 | −5.7 | −7.8 | −4.7 | −6.1 | −7.5 | −2.6 | −8.1 | −5.1 | −5.8 | |
| (5.7) | (4.0) | (1.8) | (3.5) | (4.1) | (4.6) | (4.0) | (3.5) | (4.3) | (3.9) | (4.9) | (7.3) | (5.7) | (3.3) | (5.4) | ||
| Endo | −7.9 | −11.0 | −11.5 | −10.9 | −10.3 | −8.7 | −15.2 | −14.0 | −9.9 | −12.0 | −5.1 | −11.2 | −9.4 | −9.8 | −8.9 | |
| (4.5) | (3.7) | (2.1) | (2.4) | (3.9) | (3.7) | (2.4) | (2.3) | (2.9) | (3.8) | (4.9) | (8.0) | (3.3) | (7.9) | (6.6) | ||
| LS | Midwall | −7.0 | −11.1 | −11.9 | −10.1 | −10.0 | −5.2 | −10.4 | −10.7 | −5.9 | −8.0 | −7.2 | −5.8 | −8.7 | −9.4 | −7.7 |
| (3.4) | (2.4) | (5.6) | (3.8) | (4.0) | (4.5) | (5.0) | (6.5) | (0.3) | (5.7) | (5.0) | (6.5) | (2.7) | (4.0) | (4.5) | ||
| Epi | −5.9 | −9.5 | −10.4 | −8.6 | −8.6 | −5.3 | −8.1 | −8.3 | −7.9 | −7.4 | −6.1 | −6.1 | −7.0 | −7.2 | −6.6 | |
| (4.9) | (3.3) | (4.8) | (3.0) | (4.1) | (3.7) | (1.4) | (5.2) | (3.2) | (3.5) | (5.6) | (2.7) | (1.4) | (3.9) | (3.4) | ||
The average principal strains in the 12 segments at ES are shown in Table III. We can see that E1 has the maximum positive strain value and E3 has the minimum strain value in each segment. From our experiment, the eigenvector directions associated with the largest eigenvalue have good agreement with the radial directions of the RV myocardium. E1 has maximum at the epicardium in apical segments, while it has maximum at the midwall in both the mid and basal segments. E2 and E3 decrease from the endocardium through the midwall to the epicardium.
TABLE III.
The average principal segment strains (%) of five pigs at ES. The strain are in form of mean(SD). S1 to S12 stand for the RVFW segments. ,, and are the mean of the four apical, mid, and basal segments.
| Apex | Mid | Base | ||||||||||||||
|---|---|---|---|---|---|---|---|---|---|---|---|---|---|---|---|---|
| Strains | S1 | S2 | S3 | S4 | S5 | S6 | S7 | S8 | S9 | S10 | S11 | S12 | ||||
| Endo | 16.8 | 21.4 | 14.6 | 16.0 | 17.2 | 16.1 | 39.1 | 27.5 | 19.1 | 25.4 | 13.0 | 40.8 | 35.9 | 37.0 | 31.7 | |
| (18.1) | (15.7) | (5.0) | (10.3) | (12.2) | (9.7) | (22.9) | (18.8) | (20.8) | (19.1) | (8.1) | (8.8) | (13.1) | (13.8) | (10.5) | ||
| E1 | Midwall | 20.2 | 27.7 | 18.8 | 19.5 | 21.5 | 23.5 | 53.8 | 49.5 | 30.0 | 39.2 | 21.7 | 57.2 | 42.5 | 38.3 | 39.9 |
| (19.1) | (17.7) | (6.9) | (14.2) | (14.1) | (12.4) | (18.9) | (22.0) | (32.8) | (24.2) | (10.3) | (8.9) | (14.5) | (30.6) | (20.9) | ||
| Epi | 22.2 | 28.7 | 22.7 | 19.2 | 23.2 | 25.7 | 47.6 | 48.6 | 28.5 | 37.6 | 25.8 | 45.4 | 34.7 | 29.6 | 33.9 | |
| (18.7) | (13.8) | (12.6) | (13.1) | (13.7) | (12.4) | (11.6) | (19.8) | (34.3) | (22.1) | (13.8) | (2.9) | (14.7) | (20.1) | (14.9) | ||
| Endo | −7.6 | −9.0 | −8.9 | −6.9 | −8.1 | −9.2 | −12.9 | −14.0 | −9.0 | −11.3 | −7.1 | −9.4 | −9.8 | −10.2 | −9.1 | |
| (1.5) | (1.8) | (0.5) | (1.7) | (1.6) | (3.2) | (4.2) | (3.1) | (5.3) | (4.3) | (5.1) | (3.8) | (6.4) | (3.9) | (4.6) | ||
| E2 | Midwall | −5.0 | −7.6 | −7.2 | −6.4 | −6.5 | −5.9 | −8.6 | −10.2 | −5.5 | −7.6 | −1.7 | −4.2 | −7.1 | −6.3 | −4.8 |
| (2.1) | (3.2) | (1.3) | (3.1) | (2.5) | (2.6) | (3.9) | (3.4) | (5.1) | (4.0) | (7.1) | (3.9) | (6.7) | (3.9) | (5.5) | ||
| Epi | −2.5 | −5.8 | −5.1 | −5.4 | −4.7 | −2.2 | −4.3 | −6.0 | −2.1 | −3.7 | −0.7 | −0.6 | −4.2 | −3.2 | −1.9 | |
| (3.0) | (4.2) | (2.1) | (4.2) | (3.4) | (3.4) | (3.7) | (5.1) | (4.9) | (4.2) | (8.1) | (4.1) | (6.7) | (6.1) | (6.1) | ||
| Endo | −15.1 | −17.6 | −17.1 | −14.8 | −16.1 | −19.3 | −20.6 | −22.9 | −19.6 | −20.6 | −21.4 | −21.2 | −21.7 | −16.2 | −20.1 | |
| (2.7) | (2.1) | (4.0) | (5.0) | (3.5) | (3.0) | (4.4) | (3.0) | (1.6) | (3.2) | (6.8) | (4.9) | (1.3) | (6.5) | (5.0) | ||
| E3 | Midwall | −13.0 | −16.0 | −15.7 | −13.7 | −14.6 | −16.1 | −17.3 | −19.9 | −16.1 | −17.4 | −17.4 | −17.6 | −19.7 | −16.4 | −17.8 |
| (2.3) | (2.6) | (5.1) | (4.9) | (3.8) | (4.1) | (4.9) | (4.7) | (2.8) | (4.1) | (7.2) | (4.0) | (0.5) | (7.8) | (5.2) | ||
| Epi | −11.1 | −13.8 | −14.4 | −12.5 | −13.0 | −13.0 | −13.4 | −16.6 | −12.7 | −13.9 | −13.2 | −13.5 | −17.0 | −15.9 | −14.9 | |
| (1.9) | (3.4) | (5.5) | (4.7) | (3.9) | (4.5) | (4.9) | (5.7) | (4.4) | (4.7) | (6.8) | (2.8) | (2.0) | (7.8) | (5.2) | ||
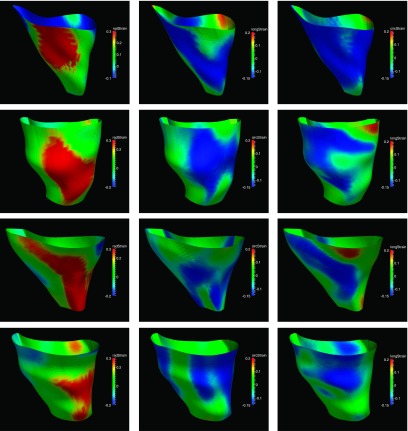
The segmental strain curves with respect to time for a typical pig are shown in Fig. 7. The RS, CS, and LS with colormap on the myocardium in a cardiac cycle generated by using Paraview software56 are shown in Figs. 8, 9, and 10, respectively. Due to limit of space, we display one mesh for every two frames in each cardiac cycle. The RS, CS, and LS generally reach to maximum simultaneously at ES. The RS is more dominant in the six lateral segments. The basal and mid segments have larger RS than the apical segments. The CS and LS are more uniformly distributed in all segments.
FIG. 7.
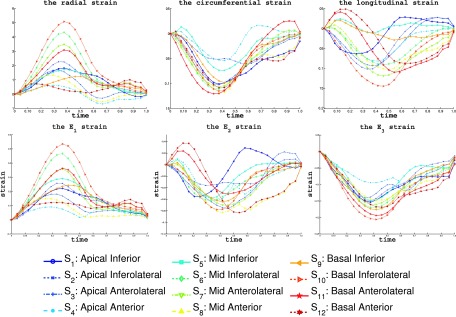
The RVFW segmental strains of a typical echocardiography sequence in a baseline cardiac cycle. The top row shows the average value of RS, CS, and LS of the 12 segments. The bottom rows shows the principal strains E1, E2, and E3. The cardiac time is normalized to 1. The bottom shows the markers for each segments in the strain plots.
FIG. 8.
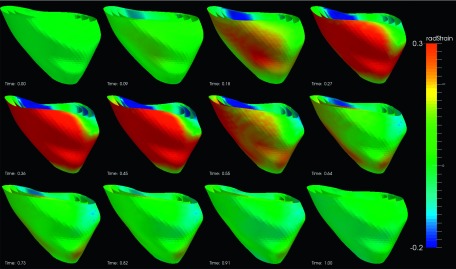
Radial strain of an example echocardiography sequence varying with time in a cardiac cycle. (The cardiac time is normalized between 0 and 1.)
FIG. 9.
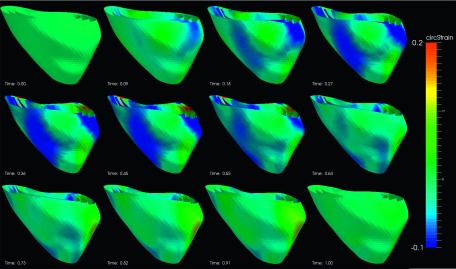
Circumferential strain of an example echocardiography sequence varying with time in a cardiac cycle. (The cardiac time is normalized between 0 and 1.)
FIG. 10.
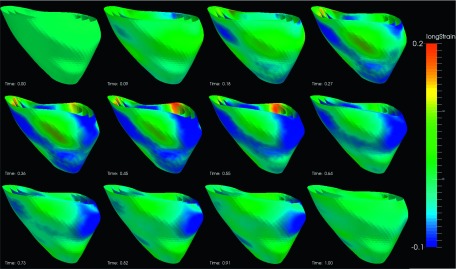
Longitudinal strain of an example echocardiography sequence varying with time in a cardiac cycle. (The cardiac time is normalized between 0 and 1.)
4.D. Transmural myocardial strain
We analyzed the transmural strains variation by using a multiple layer cardiac mesh. The mesh consisted of five layers, of which the three intermediate layers were interpolated from the endocardium to the epicardium along the transmural direction. We denote the five layers from the endocardium to epicardium as L1, L2, L3, L4, and L5. The average RS, CS, and LS in each segments at ES were estimated and listed in the Table IV. We can see that the segmental strains in different transmural layers have similar strain patterns at ES. For RS, in the apical segments, they increase from the endocardium to the epicardium. In the mid segment, they increase first then reach maximum at subepicardium and then decrease at epicardium. In the basal segments, they increase first and reach maximum at midwall then decrease. The CS and LS decrease linearly from endocardium to the epicardium.
TABLE IV.
The RS, CS, and LS (%) in the transmural layers of a typical pig at ES. S1 to S12 are the RVFW segments. , , and are the mean strain of the apical, mid, and basal segments.
| Apex | Mid | Base | ||||||||||||||
|---|---|---|---|---|---|---|---|---|---|---|---|---|---|---|---|---|
| Layers | S1 | S2 | S3 | S4 | S5 | S6 | S7 | S8 | S9 | S10 | S11 | S12 | ||||
| RS | L1 | 8.0 | 7.3 | 5.1 | 5.0 | 6.4 | 18.9 | 24.9 | 8.7 | 6.5 | 14.7 | 5.8 | 28.9 | 17.9 | 3.4 | 9.4 |
| L2 | 12.6 | 12.9 | 9.2 | 6.4 | 10.2 | 21.7 | 42.7 | 26.1 | 15.1 | 26.4 | 3.4 | 49.6 | 33.5 | 1.1 | 21.9 | |
| L3 | 17.3 | 18.7 | 12.6 | 6.9 | 13.9 | 23.5 | 53.9 | 40.4 | 18.6 | 34.1 | 13.3 | 58.1 | 41.3 | 2.7 | 28.8 | |
| L4 | 21.7 | 22.8 | 14.2 | 7.6 | 16.6 | 27.3 | 56.0 | 46.7 | 15.5 | 36.4 | 20.4 | 53.1 | 38.2 | 0.2 | 27.9 | |
| L5 | 25.5 | 25.1 | 14.2 | 7.8 | 18.1 | 29.9 | 49.9 | 41.3 | 9.0 | 32.5 | 22.5 | 41.4 | 27.6 | 3.6 | 22.0 | |
| CS | L1 | −10.6 | −7.6 | −13.0 | −8.0 | −9.8 | −11.5 | −16.1 | −21.7 | −17.0 | −16.5 | −13.5 | −16.0 | −17.2 | −12.4 | −14.8 |
| L2 | −9.3 | −6.3 | −11.3 | −6.3 | −8.3 | −7.6 | −14.3 | −17.3 | −14.6 | −13.4 | −12.3 | −13.3 | −14.2 | −10.8 | −12.7 | |
| L3 | −7.8 | −5.0 | −9.5 | −4.7 | −6.8 | −4.2 | −12.1 | −12.6 | −11.9 | −10.2 | −10.6 | −10.4 | −10.8 | −9.4 | −10.3 | |
| L4 | −6.8 | −3.7 | −7.8 | −4.2 | −5.6 | −2.5 | −9.5 | −7.7 | −9.7 | −7.4 | −8.4 | −7.9 | −7.3 | −8.4 | −8.0 | |
| L5 | −6.1 | −2.2 | −6.0 | −3.8 | −4.5 | −0.8 | −7.2 | −3.2 | −7.8 | −4.7 | −5.9 | −5.9 | −4.6 | −7.7 | −6.0 | |
| LS | L1 | −5.9 | −10.2 | −6.2 | −5.6 | −7.0 | −8.2 | −16.7 | −13.3 | −10.1 | −12.1 | −8.0 | −15.5 | −4.2 | −0.7 | −7.1 |
| L2 | −4.3 | −10.5 | −7.1 | −5.9 | −6.9 | −3.5 | −14.5 | −12.7 | −10.3 | −10.3 | −4.8 | −11.8 | −5.3 | −2.5 | −6.1 | |
| L3 | −2.5 | −10.0 | −7.5 | −6.0 | −6.5 | −0.2 | −11.6 | −10.5 | −9.4 | −7.8 | −1.8 | −8.0 | −6.0 | −3.6 | −4.9 | |
| L4 | −0.5 | −8.7 | −6.9 | −5.8 | −5.5 | −1.9 | −9.0 | −8.3 | −7.9 | −5.8 | −0.4 | −5.5 | −6.1 | −3.5 | −3.7 | |
| L5 | −1.1 | −7.0 | −6.2 | −5.6 | −4.4 | −2.7 | −6.4 | −6.2 | −6.5 | −4.1 | −2.1 | −3.5 | −5.2 | −2.3 | −2.2 | |
4.E. Principal strains direction
The average principal strains in all RVFW segments are shown in the bottom row of the Fig. 7. From Fig. 7, we can see that E1 is most similar to the RS during a cardiac cycle. This means that the largest elongation direction during cardiac cycle is along the radial direction of the myocardium. In Fig. 11, the directions of the E3 are shown as line segments at each vertices. We can see that the directions of E3 become almost uniformly distributed at the time of ES. The E3 directions at the ES are orthogonal to the myofiber orientation14 which indicates that the cross fiber shortening is dominant at the time of ES. Similarly, the E2 directions are also more uniformly distributed in the ES. The directions of the E2 at time ES are mostly consistent with the RV myofiber orientation.
FIG. 11.
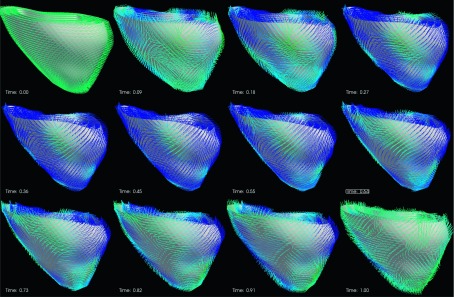
The direction of the E3 strain in a cardiac cycle. (The cardiac time is normalized between 0 and 1.) The strain direction is represented by a line segment at each vertex of the myocardium.
4.F. Pacing steady states
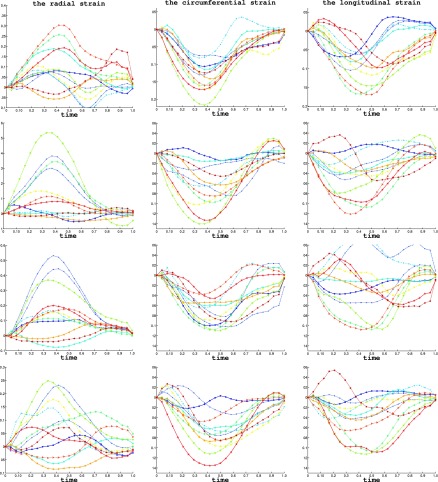
We have observed similar variations of segmental strains under varying steady states for different pigs. We use a typical pig to show its strain pattern variation in different steady states. For simplicity, we use endocardium strains for an example. The strain curves of one cardiac cycle of four steady states are shown in Fig. 12.
FIG. 12.
From top to bottom, it shows the RS, CS, and LS of a same pig under baseline, RV pacing, RV Apex pacing and RVOT pacing steady states. (The color and marker style of the curves are same as in 7.)
The first row shows the average RS, CS, and LS in each segment of the baseline.
The second row in Fig. 12 shows the average segmental strains in the case of RV pacing. The average RS in mid segments was significantly larger than the baseline. The RS was also more dominant in the lateral segments than baseline. The average CS and LS in all segments were smaller than those in the baseline.
The third row in Fig. 12 shows the average segmental strains in the case of RV apex pacing. We can see after RV apex pacing the average RS in apical segments increased significantly over the baseline. However, it was smaller in the basal segments. The radial elongation is more dominant in the lateral segments (S2, S3) than baseline. The average CS in all segments were smaller than the baseline. Similarly, nearly all segments had smaller LS than the baseline.
The fourth row in Fig. 12 shows the strains in the case of RVOT pacing. The average RS in apical is slightly larger than that of baseline. The average CS and LS are smaller than baseline. The region near side segments opposite to right ventricular inflow tract (RVIT) (S5, S9, S10) has negative RS and the segments near RVOT (S3, S4, S7, S8, S11, S12) have larger RS. That means RS is dominant in the segments near RVOT. The average CS of all segments is smaller than that in baseline. The average of LS in all segments is smaller than that of baseline.
The corresponding strains on RVFW at ES are shown in Fig. 13 with colormap and the values of the ES strain and their average in apical, mid, and basal segments are listed in Table V. From Fig. 13, we can see that the maximum variation of the RS occurs at regions near the pacing sites. In Table V, we can see that in RV pacing steady state, the lateral mid segments (S6, S7) have significant increase in RS than baseline. Similarly, in RV apex pacing, the two lateral apical segments (S2, S3) have significant increase in RS than baseline. In RVOT pacing, the apical and mid segments near RVOT (S3, S4, S7, S8) have significant increase in RS than baseline. This might indicate that the electric stimulation makes the RV myofiber stretching most near the pacing sites. However, due to the potential being propagated more slowly though the myofiber rather than through the Purkinje system, the CS and LS are smaller than those of the baseline.
FIG. 13.
The endocardium RVFW of a typical pig colormapped with RS, CS and LS at ES in baseline, RV pacing, RV apex pacing and RVOT pacing.
TABLE V.
The average endocardium segment strains (%) at ES in the four steady states. S1 to S12 are the RVFW segments. , , and are the mean strain of all apical, mid, and basal segments. BSL, RV, RVA, and RVOT stand for baseline, RV pacing, RV apex pacing, and RVOT pacing, respectively.
| Apex | Mid | Base | ||||||||||||||
|---|---|---|---|---|---|---|---|---|---|---|---|---|---|---|---|---|
| States | S1 | S2 | S3 | S4 | S5 | S6 | S7 | S8 | S9 | S10 | S11 | S12 | ||||
| BSL | RS | 8.0 | 7.3 | 5.1 | 5.0 | 6.4 | 18.9 | 24.9 | 8.7 | 6.5 | 14.7 | −5.8 | 28.9 | 17.9 | 3.4 | 9.4 |
| CS | −10.6 | −7.6 | −13.0 | −8.0 | −9.8 | −11.5 | −16.1 | −21.7 | −17.0 | −16.5 | −13.5 | −16.0 | −17.2 | −12.4 | −14.8 | |
| LS | −5.9 | −10.2 | −6.2 | −5.6 | −7.0 | −8.2 | −16.7 | −13.3 | −10.1 | −12.1 | −8.0 | −15.5 | −4.2 | −0.7 | −7.1 | |
| RVP | RS | −1.0 | 38.2 | 30.0 | 0.6 | 16.9 | 0.6 | 34.3 | 53.4 | 13.5 | 25.4 | −2.4 | 11.4 | 8.0 | 0.5 | 4.2 |
| CS | −0.4 | −6.3 | −2.8 | −6.5 | −4.0 | −1.6 | −9.4 | −14.0 | −9.9 | −8.7 | −5.7 | −8.3 | −13.3 | −3.6 | −7.7 | |
| LS | −1.2 | −4.7 | −2.9 | −0.1 | −1.6 | −3.7 | −10.3 | −7.0 | −4.2 | −6.3 | −3.4 | −11.9 | −9.6 | −0.2 | −6.3 | |
| RVA | RS | 9.4 | 41.4 | 50.9 | 16.7 | 29.6 | −7.2 | 11.4 | 36.9 | 14.9 | 14.0 | −1.7 | 15.4 | 19.5 | −4.0 | 7.3 |
| CS | −9.5 | −5.6 | −8.5 | −6.5 | −7.5 | −5.8 | −10.0 | −9.3 | −8.5 | −8.4 | −5.5 | −3.7 | −3.4 | −6.2 | −4.7 | |
| LS | −3.5 | −5.5 | 5.7 | 6.9 | −0.9 | −1.2 | −6.4 | −9.4 | −0.5 | −4.1 | −1.7 | −10.3 | −2.1 | −0.9 | −2.2 | |
| RVOT | RS | 2.9 | 10.7 | 20.8 | 12.7 | 11.8 | −4.9 | 8.5 | 28.0 | 18.7 | 12.6 | −7.7 | −4.0 | 4.7 | 6.3 | −0.02 |
| CS | −2.6 | −0.9 | −5.7 | −4.0 | −2.8 | −6.5 | −6.2 | −10.1 | −7.1 | −7.5 | −6.7 | −6.5 | −11.8 | −6.2 | −7.8 | |
| LS | −0.2 | −0.0 | −2.2 | −2.0 | −1.0 | −3.5 | −7.1 | −7.2 | −1.9 | −4.9 | −4.5 | −7.9 | −10.3 | −0.3 | −5.8 | |
5. DISCUSSION
We have proposed a temporally diffeomorphic motion estimation method and applied it to strain analysis of 3D echocardiography sequences of different steady states.
Our proposed method used an intensity-based approach which was not limited to specific image modality. It was a general method and it has four advantages over the existing methods on RV motion estimation from MRI and LV motion estimation from echocardiography. First, our method automatically searched for a transformation which can maintain spatiotemporal smoothness even under low spatial and temporal image resolutions. Such temporal smoothness was not considered in most of the existing RV motion estimation methods based on MRI.20,21 Although a spatiotemporally smooth 4D transformation was also used in the work of Tustison and Amini,22 it requires intensive human interaction. Methods proposed for LV tracking from 3D echocardiography did not consider the temporal smoothness47,48 either. Second, our method optimized the image similarity by using a frame-to-frame approach. In the LV tracking methods,40,49 they used an approach which optimized the similarity between the reference frame and all of the following frames. The speckle patterns in the distant frames of the RV images were usually unstable which degraded the tracking accuracy. Third, there was no need of feature extraction or surface modeling in our motion estimation method. The results of surface model based methods usually depended on the accuracy of the surface extraction,8,20 while the motion estimation in our method used all of the voxel information and had subvoxel accuracy. For RV images, our method was also more efficient because there is no need to modeling the complex shape of its endocardial and epicardial surfaces. Finally, our method optimized the velocity field in a spatiotemporally smooth functional space, which made the transformation of myocardial wall to be diffeomorphic, which was physically plausible for the heart motion. Our method has a limitation that the physical constraints on myocardium are not included. It has been demonstrated that physical constraints such as myocardium incompressibility40,50 can improve the performance of LV motion estimation. However, a segmentation of the myocardium is necessary, which is not a trivial task.
We used sonomicrometry as ground truth to evaluate the accuracy of motion estimation. It has been used as reference measurement in the LV function studies.51–53 In this study, the high correlation value between the image derived peak two-point strains and those derived by sonomicrometry demonstrated that our estimated motion had good agreement with real motion.
In our study, we estimated both the global and local motions. Longitudinal and total displacement were largest at the base segments. This was similar to reports by other researchers.20,21 Our estimated principal strains of E2 and E3 in apical, mid, and basal segments on endocardium were −8.1%, −11.3%, −9.1% and −16.1%, −20.6%, −20.1%, respectively, and they were close to those estimated by Haber et al.21 by using tagged-MRI, which were −10%, −13%, −9% and −23%, −24%, −19%, respectively. Our estimated maximum principal strain E1 in apical, mid, and basal segments on endocardium were 17.2%, 25.4%, 31.7%, while they were 30%, 33%, 26% in Ref. 21. One of the possible reasons for the large difference in E1 from other research results was that it has larger standard deviation due to the difficulty to labeling the endocardium and epicardium. Another reason may be that the apical strains were underestimated in this study due to two limitations of the image acquisition. First, due to requirement of the frame rate, the cross section of the image was in an acute angle shape, which frequently led to incomplete RV apical images. Second, images at apex where the ultrasound probe contacted with heart wall usually had echoes which were difficult to track due to lack of meaningful information. These phenomenon of underestimation or failure of speckle tracking in the RV apex have also been reported in previous studies.24,51
In our method, the motion estimation and the cardiac model editing were separated. That means the motion estimation complexity did not depend on the cardiac mesh complexity. It was flexible to use different cardiac meshes for different strain analysis requirements with the same estimated displacement field. In our study, we used a 12-segments model by dividing each of the apical, mid, and basal segments into four segments. We have found that the six lateral segments have larger RS than side segments. Our method also provided a general way to evaluate the strains along transmural layers. Our result showed decrease of the CS along transmural direction which was consistent with result of other researcher.52
We used both the geometrical directions (radial, circumferential, longitudinal) and the mathematical directions (eigenvectors of strain tensor) to evaluate the strains. These directions were all defined at each vertex of the cardiac mesh. The maximum principal strain direction has good agreement with that of the radial direction. The directions of E2 and E3 were oblique in the RV myocardium and were closely related to the RV myofiber direction and the cross-fiber direction. The radial, circumferential, and longitudinal directions were estimated when the cardiac mesh was generated. It did not depend on the cardiac deformation. The principal strain directions were acquired after the deformation was estimated.
Most of the studies on RV pacing focused on its effect on the LV function and dyssynchrony.54,55 There were no RV strains study of image sequences under different steady states generated by varying the pacing sites. In our study, we have found that the segments closest to the pacing sites exhibited largest increase of RS. The CS and LS in all segments became smaller than baseline. Our method can be applied to search for the optimal RV pacing site with which myocardium segmental strain patterns are most similar to those of baseline.
6. CONCLUSION
In this paper, we proposed a temporally diffeomorphic motion estimation method and validated with 3D echocardiographic sequences of open-chest pig hearts. The results from the sonomicrometry show that our method has good consistency with sonomicrometry in strain estimation, which means our method has high accuracy under different cardiac conditions. We applied the method to the RVFW strain analysis of the different steady states. Segmental strain of different steady states were studied and possible reasons were analyzed. The consistency of the strain measurements in our method with those from MRI shows our method is feasible to study RV functions from 3D echocardiography.
ACKNOWLEDGMENT
This paper is supported by a NIH/NHLBI Grant No. 1R01HL102407-01 awarded to Xubo Song and David Sahn.
REFERENCES
- 1.Warnes C. A., “Adult congenital heart disease: Importance of the right ventricle,” JACC 54(21), 1903–1910 (2009). 10.1016/j.jacc.2009.06.048 [DOI] [PubMed] [Google Scholar]
- 2.Davlouros P. A., Niwa K., Webb G., and Gatzoulis M. A., “The right ventricle in congenital heart disease,” Heart 92(suppl. 1), i27–i38 (2006). 10.1136/hrt.2005.077438 [DOI] [PMC free article] [PubMed] [Google Scholar]
- 3.Voelkel N. F., Quaife R. A., Leinwand L. A., Barst R. J., McGoon M. D., Meldrum D. R., Dupuis J., Long C. S., Rubin L. J., Smart F. W., Suzuki Y. J., Gladwin M., Denholm E. M., and Gail Dorothy., “Right ventricular function and failure : Report of a national heart, lung, and blood institute working group on cellular and molecular mechanisms of right heart failure,” Circulation 114(6), 1883–1891 (2006). 10.1161/CIRCULATIONAHA.106.632208 [DOI] [PubMed] [Google Scholar]
- 4.Basso C., Corrado D., Marcus F. I., Nava A., and Thiene G., “Arrhythmogenic right ventricular cardiomyopathy,” The Lancet 373(9671), 1289–1300 (2009). 10.1016/S0140-6736(09)60256-7 [DOI] [PubMed] [Google Scholar]
- 5.Lam H. I., Cowan B. R., Nash M. P., and Young A. A., “Interactive cardiac image analysis for biventricular function of the human heart,” in LNCS (Springer, New York, NY, 2010), Vol. 6364, pp. 144–153. [Google Scholar]
- 6.Kempny A., Jiménez R. Fernández., Orwat S., Schuler P., Bunck A. C., Maintz D., Baumgartner H., and Diller G. P., “Quantification of biventricular myocardial function using cardiac magnetic resonance feature tracking, endocardial border delineation and echocardiographic speckle tracking in patients with repaired tetralogy of fallot and healthy controls,” J. Cardiovasc. Magn. Reson. 14(5), 1–14 (2012). 10.1186/1532-429X-14-32 [DOI] [PMC free article] [PubMed] [Google Scholar]
- 7.Kothari S. S. and Ramakrishnan S. R., “Tracking the right ventricle—Working in progress,” JACC: Cardiovasc. Imaging 4(2), 138–140 (2011). 10.1016/j.jcmg.2010.11.010 [DOI] [PubMed] [Google Scholar]
- 8.Frangi A. F., Niessen W. J., and Viergever M. A., “Three-dimensional modeling for functional analysis of cardiac images: A review,” IEEE Trans. Med. Imaging 20(1), 1–25 (2001). 10.1109/42.906421 [DOI] [PubMed] [Google Scholar]
- 9.Buckberg G., Hoffman J. I. E., Mahajan A., Saleh S., and Coghlan C., “Cardiac mechanics revisited the relationship of cardiac architecture to ventricular function,” Circulation 118, 2571–2587 (2008). 10.1161/CIRCULATIONAHA.107.754424 [DOI] [PubMed] [Google Scholar]
- 10.Makela T., Clarysse P., Sipilä O., Pauna N., Pham Q. C., Katila T., and Magnin I. E., “A review of cardiac image registration methods,” IEEE Trans. Med. Imaging 21(9), 1011–1021 (2002). 10.1109/TMI.2002.804441 [DOI] [PubMed] [Google Scholar]
- 11.Haddad F., Hunt S. A., Rosenthal D. N., and Murphy D. J., “Right ventricular function in cardiovascular disease, Part I: Anatomy, physiology, aging, and functional assessment of the right ventricle,” Circulation 117, 1436–1448 (2008). 10.1161/CIRCULATIONAHA.107.653576 [DOI] [PubMed] [Google Scholar]
- 12.Haddad F., Doyle R., Murphy D. J., and Hunt S. A., “Right ventricular function in cardiovascular disease, Part II: Pathophysiology, clinical importance and management of right ventrcular failure,” Circulation 117(13), 1717–1731 (2008). 10.1161/CIRCULATIONAHA.107.653584 [DOI] [PubMed] [Google Scholar]
- 13.Mertens L. L. and Friedberg M. K., “Imaging the right ventricle—Current state of art,” Nat. Rev. Cardiol. 7(10), 551–563 (2010). 10.1038/nrcardio.2010.118 [DOI] [PubMed] [Google Scholar]
- 14.Ho S. Y. and Nihoyannopoulos P., “Anatomy, echocardiography, and normal right ventricular dimensions,” Heart 92(S1), 2–13 (2006). 10.1136/hrt.2005.077875 [DOI] [PMC free article] [PubMed] [Google Scholar]
- 15.Sheehan F. and Redington A., “The right ventricle: Anatomy, physiology and clinical imaging,” Heart 94(11), 1510–1515 (2008). 10.1136/hrt.2007.132779 [DOI] [PubMed] [Google Scholar]
- 16.Rudski L. G., Lai W. W., Afilalo J., Hua L. Q., Handschumacher M. D., Chandrasekaran K., Solomon S. D., Louie E. K., and Schiller N. B., “Guidelines for the echocardiographic assessment of the right heart in adults: A report from the american society of echocardiography,” JASE 23(7), 685–713 (2010). 10.1016/j.echo.2010.05.010 [DOI] [PubMed] [Google Scholar]
- 17.Klein S. S., Graham T. P., and Lorenz C., “Noninvasive delineation of normal right ventricular contractile motion with magnetic resonance imaging myocardial tagging,” Ann. Biomed. Eng. 26, 756–763 (1998). 10.1114/1.75 [DOI] [PubMed] [Google Scholar]
- 18.Naito H., Arisawa J., Harda K., Yamagami H., Kozuka T., and Tamura S., “Assessment of right ventricular regional contraction and comparison with the left ventricle in normal humans: A cine magnetic resonance study with persaturation myocardial tagging,” Br. Heart J. 74(2), 186–191 (1995). 10.1136/hrt.74.2.186 [DOI] [PMC free article] [PubMed] [Google Scholar]
- 19.Menteer J., Weinberg P. M., and Fogel M. A., “Quantifying regional right ventricular function in tetralogy of Fallot,” J. Cardiovasc. Magn. Reson. 7(5), 753–761 (2005). 10.1080/10976640500283439 [DOI] [PubMed] [Google Scholar]
- 20.Young A. A., Fayad Z. A., and Axel L., “Right ventricular midwall surface motion and deformation using magnetic resonance tagging,” Am. J. Physiol. 271(6P2), 2677–2688 (1996). [DOI] [PubMed] [Google Scholar]
- 21.Haber I., Metaxas D. N., and Axel L., “Three-dimensional motion reconstruction and analysis of the right ventricle using tagged MRI,” Med. Image Anal. 4(4), 335–355 (2000). 10.1016/S1361-8415(00)00028-1 [DOI] [PubMed] [Google Scholar]
- 22.Tustison N. J. and Amini A. A., “Biventricular myocardial strains via nonrigid registration of anatomical NURBS models,” IEEE Trans. Med. Imaging 25(1), 94–112 (2006). 10.1109/TMI.2005.861015 [DOI] [PubMed] [Google Scholar]
- 23.Mor-Avi V., Lang R. M., Badano L. P., Belohlavek M., Cardim N. M., Derumeaux G., Galderisi M., Marwick T., Nagueh S. F., Sengupta P. P., Sicari R., Smiseth O. A., Smulevitz B., Takeuchi M., Thomas J. D., Vannan M., Voigt J., and Zamorano J. L., “Current and evolving echocardiographic techniques for the quantitative evaluation of cardiac mechanics: ASE/EAE consensus statement on methodology and indications,” JASE 24(3), 213–277 (2011). 10.1093/ejechocard/jer021 [DOI] [PubMed] [Google Scholar]
- 24.Friedberg M. K. and Mertens L., “Tissue velocities, strain and strain rate for echocardiographic assessment of ventricular function in congenital heart disease,” Eur. J. Echocardiogr. 10(5), 585–593 (2009). 10.1093/ejechocard/jep045 [DOI] [PubMed] [Google Scholar]
- 25.Weidemann F., Eyskens B., Jamal F., Mertens L., Kowalski M., D’Hooge J., Bijnens B., Gewillig M., Rademakers F., Hatle L., and Sutherland G. R., “Quantification of regional left and right ventricular radial and longitudinal function in healthy children using ultrasound-based strain rate and strain imaging,” JASE 15(1), 20–28 (2002). 10.1067/mje.2002.116532 [DOI] [PubMed] [Google Scholar]
- 26.Gondi S. and Dokainish H., “Right ventricular tissue Doppler and strain imaging: Ready for clinical use?,” Echocardiography 24(5), 522–532 (2007). 10.1111/j.1540-8175.2007.00430.x [DOI] [PubMed] [Google Scholar]
- 27.La Gerche A., Jurcut R., and Voigt J. U., “Right ventricular function by strain echocardiography,” Curr. Opin. Cardiol. 25(5), 430–436 (2010). 10.1097/HCO.0b013e32833b5f94 [DOI] [PubMed] [Google Scholar]
- 28.Horton K. D., Meece R. W., and Hill J. C., “Assessment of the right ventricle by echocardiography: A primer for cardiac sonographers,” JASE 22(7), 776–792 (2009). 10.1016/j.echo.2009.04.027 [DOI] [PubMed] [Google Scholar]
- 29.Pettersen E., Helle-Valle T., Edvardsen T., Lindberg H., Smith H. J., Smevik B., Smiseth O. A., and Andersen K., “Contraction pattern of the systemic right ventricle shift from longitudinal to circumferential shortening and absent global ventricular torsion,” JACC 49(25), 2450–2456 (2007). 10.1016/j.jacc.2007.02.062 [DOI] [PubMed] [Google Scholar]
- 30.Meris A., Faletra F., Conca C., Klersy C., Regoli F., Klimusina J., Penco M., Pasotti E., Pedrazzini G. B., Moccetti T., and Auricchio A., “Timing and magnitude of regional right ventricular function: A speckle tracking-derived strain study of normal subjects and patients with right ventricular dysfunction,” JASE 23(8), 823–831 (2010). 10.1016/j.echo.2010.05.009 [DOI] [PubMed] [Google Scholar]
- 31.Cameli M., Righini F. M., Lisi M., and Mondillo S., “Right ventricular strain as a novel approach to analyze right ventricular performance in patients with heart failure,” Heart Failure Rev. 19(5), 603–610 (2014). 10.1007/s10741-013-9414-7 [DOI] [PubMed] [Google Scholar]
- 32.Forsha D., Risum N., Kropf P. A., Rajagopal S., Smith P. B., Kanter R. J., Samad Z., Sogaard P., Barker P., and Kisslo J., “Right ventricular mechanics using a novel comprehensive three-view echocardiographic strain analysis in a normal population,” JASE 27(4), 413–422 (2014). 10.1016/j.echo.2013.12.018 [DOI] [PMC free article] [PubMed] [Google Scholar]
- 33.Yu H. K., Li S. J., Ip J. K., Lam W. M., Wong J., and Cheung Y. F., “Right ventricular mechanics in adults after surgical repair of tetralogy of Fallot: Insights from three-dimensional speckle-tracking echocardiography,” JASE 27(4), 423–429 (2014). 10.1016/j.echo.2013.12.021 [DOI] [PubMed] [Google Scholar]
- 34.Rajagopal S., Forsha D. E., Risum N., Hornik C. P., Poms A. D., Fortin T. A., Tapson V. F., Velazquez E. J., Kisslo J., and Samad Z., “Comprehensive assessment of right ventricular function in patients with pulmonary hypertension with global longitudinal peak systolic strain derived from multiple right ventricular views,” JASE 27(6), 657–665 (2014). 10.1016/j.echo.2014.02.001 [DOI] [PubMed] [Google Scholar]
- 35.Salvo G. D., Russo M. G., Paladini D., Felicetti M., Castaldi B., Tartaglione A., di Pietto L., Ricci C, Morelli C., Pacileo G., and Calabro R., “Two-dimensional strain to assess regional left and right ventricular longitudinal function in 100 normal fetuses,” Eur. J. Echocardiogr 9(6), 754–756 (2008). 10.1093/ejechocard/jen134 [DOI] [PubMed] [Google Scholar]
- 36.Geyer H., Caracciolo G., Abe H., Wilansky S., Carerj S., Gentile F., Nesser H. J., Khandheria B., Narula J., and Sengupta P. P., “Assessment of myocardial mechanics using speckle tracking echocardiography: Fundamentals and clinical applications,” J. Am. Soc. Echocardiogr. 23(4), 351–369 (2010). 10.1016/j.echo.2010.02.015 [DOI] [PubMed] [Google Scholar]
- 37.Jasaityte R., Heyde B., and Dhooge J., “Current state of three-dimensional myocardial strain estimation using echocardiography,” JASE 26(1), 15–28 (2013). 10.1016/j.echo.2012.10.005 [DOI] [PubMed] [Google Scholar]
- 38.Meunier J., “Tissue motion assessment from 3D echographic speckle tracking,” Phys. Med. Biol. 43(5), 1241–1254 (1998). 10.1088/0031-9155/43/5/014 [DOI] [PubMed] [Google Scholar]
- 39.Zhang Z. J., Sahn D. J., and Song X. B., “Right ventricular strain analysis from 3-d echocardiography by using temporally diffeomorphic motion estimation,” in LNCS (Springer, New York, NY, 2013), Vol. 7945, pp. 474–482. [DOI] [PMC free article] [PubMed] [Google Scholar]
- 40.De Craene M., Piella G., Camara O., Duchateaua N., Silvae E., Doltrae A., D’hooge J., Brugadae J., Sitgese M., and Frangi A. F., “Temporal diffeomorphic free-form deformation: Application to motion and strain estimation from 3D echocardiography,” Med. Image Anal. 16(1), 427–450 (2012). 10.1016/j.media.2011.10.006 [DOI] [PubMed] [Google Scholar]
- 41.Ashburner J., “A fast diffeomorphic image registration algorithm,” NeuroImage 38(1), 95–113 (2007). 10.1016/j.neuroimage.2007.07.007 [DOI] [PubMed] [Google Scholar]
- 42.Fung Y. C., First Course in Continuum Mechanics (Prentice Hall, Englewood Cliffs, 2010). [Google Scholar]
- 43.matlab version 8.1.0. (R2013a), The MathWorks, Inc., Natick, MA, 2013.
- 44.http://www.openmp.com.
- 45.http://www.medtronic.com.
- 46.SonoMetrics, Ontario, Canada, http://www.sonometrics.com.
- 47.Papademetris X., Sinusas A. J., Dione D. P., and Duncan J. S., “Estimation of 3D left ventricular deformation from echocardiography,” Med. Image Anal. 5(1), 17–28 (2001). 10.1016/S1361-8415(00)00022-0 [DOI] [PubMed] [Google Scholar]
- 48.Elen A., Choi H. F., Loeckx D., Gao H., Claus P., Suetens P., Maes F., and D’hooge J., “Three-dimensional cardiac strain estimation using spatio-temporal elastic registration of ultrasound images: A feasibility study,” IEEE Trans. Med. Imaging 27(11), 1580–1591 (2008). 10.1109/TMI.2008.2004420 [DOI] [PubMed] [Google Scholar]
- 49.Ledesma-carbayo M. J., Jan K., Manuel D., Andrés S., Sühling M, Hunziker P. R., and Unser M., “Spatio-temporal nonrigid registration for ultrasound cardiac motion estimation,” IEEE Trans. Med. Imaging 24(9), 1113–1126 (2005). 10.1109/TMI.2005.852050 [DOI] [PubMed] [Google Scholar]
- 50.Mansi T., Pennec X., Sermesant M., Delingette H., and Ayache N., “iLogDemons: A demons-based registration algorithm for tracking incompressible elastic biological tissues,” Int. J. Comput. Vision 92(1), 92–111 (2011). 10.1007/s11263-010-0405-z [DOI] [Google Scholar]
- 51.Seo Y., Ishizu T., Enomoto Y., Sugimori H., Yamamoto M., Machino T., Kawamura R., and Aonuma K., “Validation of 3-dimensional speckle tracking imaging to quantify regional myocardial deformation,” JACC: Cardiovasc. imaging 22(2), 451–459 (2009). 10.1161/CIRCIMAGING.109.858480 [DOI] [PubMed] [Google Scholar]
- 52.Ishizu T., Seo Y., Enomoto Y., sugimori H., Yamamoto M., Machino T., Kawamura R., and Aonuma K., “Experimental validation of left ventricular transmural strain gradient with echocardiographic two-dimensional speckle tracking imaging,” Eur. J. Echocardiogr. 11(4), 377–385 (2010). 10.1093/ejechocard/jep221 [DOI] [PubMed] [Google Scholar]
- 53.Zhang Z. J., Ashraf M., Sahn D. J., and Song X. B., “Temporally diffeomorphic cardiac motion estimation from three-dimensional echocardiography by minimization of intensity consistency error,” Med. Phys. 41(5), 052902 (16pp.) (2014). 10.1118/1.4867864 [DOI] [PMC free article] [PubMed] [Google Scholar]
- 54.Tops L. F., Schalij M. J., and Bax J. J., “The effects of right ventricular apical pacing on ventricular function and dyssynchrony,” JACC 54(9), 764–776 (2009). 10.1016/j.jacc.2009.06.006 [DOI] [PubMed] [Google Scholar]
- 55.Oarii S., Electrophysiology - From Plants to Heart (Intech, Croatia, 2012). [Google Scholar]
- 56.Squillacote A., The Paraview Guide (Kitware, Inc., New York, 2008). [Google Scholar]


